QNBFS Weekly Market Report December 6, 2018
•
0 recomendaciones•92 vistas

The Qatar Stock Exchange (QSE) Index gained 233.86 points or 2.26% during the trading week to close at 10,598.40.

Recomendados
Recomendados
Más contenido relacionado
Más de QNB Group
Más de QNB Group (20)
Último
Último (20)
QNBFS Weekly Market Report December 6, 2018
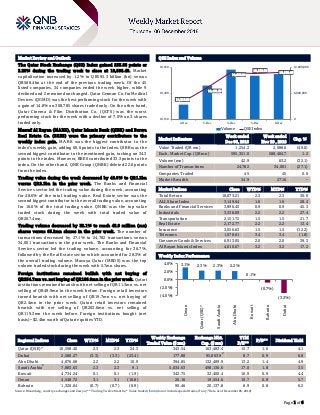
- 1. ` Page 1 of 6 Market Review and Outlook QSE Index and Volume The Qatar Stock Exchange (QSE) Index gained 233.86 points or 2.26% during the trading week to close at 10,598.40. Market capitalization increased by 1.2% to QR595.3 billion (bn) versus QR588.4bn at the end of the previous trading week. Of the 45 listed companies, 34 companies ended the week higher, while 9 declined and 2 remained unchanged. Qatar German Co. for Medical Devices (QGMD) was the best performing stock for the week with a gain of 14.8% on 308,785 shares traded only. On the other hand, Qatar Cinema & Film Distribution Co. (QCFS) was the worst performing stock for the week with a decline of 7.0% on 3 shares traded only. Masraf Al Rayan (MARK), Qatar Islamic Bank (QIBK) and Barwa Real Estate Co. (BRES) were the primary contributors to the weekly index gain. MARK was the biggest contributor to the index’s weekly gain, adding 60.6 points to the index. QIBK was the second biggest contributor to the mentioned gain, tacking on 34.3 points to the index. Moreover, BRES contributed 33.3 points to the index. On the other hand, QNB Group (QNBK) deleted 22.6 points from the index. Trading value during the week decreased by 40.0% to QR1.2bn versus QR2.1bn in the prior week. The Banks and Financial Services sector led the trading value during the week, accounting for 48.6% of the total trading value. Real Estate sector was the second biggest contributor to the overall trading value, accounting for 16.6% of the total trading value. QNBK was the top value traded stock during the week with total traded value of QR207.4mn. Trading volume decreased by 32.1% to reach 42.9 million (mn) shares versus 63.2mn shares in the prior week. The number of transactions decreased by 27.1% to 24,782 transactions versus 34,001 transactions in the prior week. The Banks and Financial Services sector led the trading volume, accounting for 36.7%, followed by the Real Estate sector which accounted for 28.3% of the overall trading volume. Mazaya Qatar (MRDS) was the top volume traded stock during the week with 5.7mn shares. Foreign institutions remained bullish with net buying of QR234.7mn vs. net buying of QR166.9mn in the prior week. Qatari institutions remained bearish with net selling of QR11.3mn vs. net selling of QR49.9mn in the week before. Foreign retail investors turned bearish with net selling of QR19.7mn vs. net buying of QR2.4mn in the prior week. Qatari retail investors remained bearish with net selling of QR203.6mn vs. net selling of QR119.3mn the week before. Foreign institutions bought (net basis) ~$2.4bn worth of Qatari equities YTD. Market Indicators Week ended Dec 06, 2018 Week ended Nov 29 , 2018 Chg. % Value Traded (QR mn) 1,254.2 2,088.6 (40.0) Exch. Market Cap. (QR mn) 595,351.0 588,404.7 1.2 Volume (mn) 42.9 63.2 (32.1) Number of Transactions 24,782 34,001 (27.1) Companies Traded 45 45 0.0 Market Breadth 34:9 27:16 – Market Indices Close WTD% MTD% YTD% Total Return 18,673.21 2.3 2.3 30.6 ALL Share Index 3,149.64 1.6 1.6 28.4 Banks and Financial Services 3,896.45 0.9 0.9 45.3 Industrials 3,338.09 2.2 2.2 27.4 Transportation 2,151.72 1.5 1.5 21.7 Real Estate 2,172.77 2.2 2.2 13.4 Insurance 3,056.63 1.5 1.5 (12.2) Telecoms 1,078.61 3.4 3.4 (1.8) Consumer Goods & Services 6,913.05 2.0 2.0 39.3 Al Rayan Islamic Index 4,010.67 3.2 3.2 17.2 Market Indices Weekly Index Performance Regional Indices Close WTD% MTD% YTD% Weekly Exchange Traded Value ($ mn) Exchange Mkt. Cap. ($ mn) TTM P/E** P/B** Dividend Yield Qatar (QSE)* 10,598.40 2.3 2.3 24.3 343.54 163,483.4 15.7 1.6 4.1 Dubai 2,580.27 (3.3) (3.3) (23.4) 177.88 95,863.9# 8.7 0.9 6.8 Abu Dhabi 4,876.68 2.2 2.2 10.9 394.85 132,489.9 13.2 1.4 4.9 Saudi Arabia# 7,883.63 2.3 2.3 9.1 5,034.63 498,136.6 17.0 1.8 3.5 Kuwait 4,734.24 0.1 0.1 (1.9) 342.75 32,400.4 16.9 0.9 4.4 Oman 4,548.72 3.1 3.1 (10.8) 26.16 19,554.6 10.7 0.8 5.7 Bahrain 1,320.04 (0.7) (0.7) (0.9) 90.46 20,137.8 8.9 0.8 6.2 Source: Bloomberg, country exchanges and Zawya (** Trailing Twelve Months; * Value traded ($ mn) do not include special trades, if any; # Data as of December 05, 2018) 10,316.96 10,451.33 10,602.84 10,589.98 10,598.40 0 6,000,000 12,000,000 10,150 10,400 10,650 2-Dec 3-Dec 4-Dec 5-Dec 6-Dec Volume QSE Index 3.1% 2.3% 2.3% 2.2% 0.1% (0.7%) (3.3%) (4.0%) (2.0%) 0.0% 2.0% 4.0% Oman Qatar(QSE)* SaudiArabia AbuDhabi Kuwait Bahrain Dubai
- 2. Page 2 of 6 News Economic & Market News QAMCO shares will start trading on Sunday December 16 – Qatar Stock Exchange (“QSE”) announced that the admittance of the shares of Qatar Aluminums Manufacturing Company (“QAMCO”) to trading will on Sunday, December 16, 2018. The decision to list QAMCO on QSE is based on the approval of Qatar Financial Markets Authority after the company has fulfilled all necessary administrative and technical requirements. With the listing of QAMCO, the number of listed companies on QE will increase to 46. QSE stated that listing of QAMCO will be in the Industrial Sector with a symbol QAMC. As usual, price floatation for QAMCO will be permitted only for the first day of listing however; price fluctuation on the second day and thereafter will be permitted by 10% up/down as the case for all other listed companies. (QSE) Qatar’s Amir receives Saudi Arabian King’s invite for GCC summit – HH the Amir Sheikh Tamim Bin Hamad Al-Thani received a written message from Saudi Arabia’s King, Salman Bin Abdulaziz Al Saud, that invites HH the Amir to attend the 39th Summit of the Supreme Council of the GCC that will be hosted by the Kingdom on December 9. (Peninsula Qatar) Al Kaabi: Qatar to pull out of OPEC in January 2019 – Qatar will withdraw from the OPEC with effect from January 1, 2019, HE the Minister of State for Energy Affairs, Saad bin Sherida Al- Kaabi said. Qatar joined OPEC in 1961, one year after the organization’s establishment. Al-Kaabi said, “Our strategy is to remain focused on its core business and activities in Qatar and to enhance Qatar’s international standing as the world’s leading natural gas producer. Qatar has worked (through Qatar Petroleum) to develop and increase our LNG production from 77mn tons per year to 110mn tons by 2024. The global oil market will not be affected by the move, since Qatar is not a high volume producer of oil.” He added, “Qatar’s decision to exit OPEC is not political, it was purely a business decision for Qatar’s future strategy towards the energy sector.” Al Kaabi further stated, “Qatar has worked diligently during the past few years to develop a future strategy in the oil & gas sector based on growth and expansion, both in its activities in Qatar and internationally. This strategy has driven the expansion of our international upstream footprint to reach countries like Brazil, Mexico, Argentina, Cyprus, Congo, South Africa, and the Sultanate of Oman, to name a few. Moreover, in the next few months we will be announcing several major international partnerships. Our objective in this strategy was to remain focused on our core business and activities in Qatar, and to enhance Qatar’s international standing as the world’s leading natural gas producer.” (Gulf-Times.com) Moody’s: Qatari banks’ outlook for 2019 remains ‘Stable’ – Qatari banks have a ‘Stable’ outlook for 2019, with improving operating conditions, solid loan performance and strong capital. The Moody’s outlook for ‘GCC Banks for 2019’ showed Qatar’s banking system’s stability in all the seven components of credit drivers, including operating environment, asset risks, capital, profitability & efficiency, funding & liquidity and government support. Qatar is among the two countries in the region which ticked all these boxes as ‘Stable’ in Moody’s outlook for the GCC banks. The rating agency noted Qatari banks are most reliant on confidence-sensitive foreign funding, along with Bahrain, in the region. Current oil prices will support increased government spending, and stimulus packages such as Qatar’s 2022 FIFA World Cup, and will underpin banks’ stable financial performance, according to Moody’s Vice President-Senior Credit Officer, Nitish Bhojnagarwala. (Peninsula Qatar) Qatar's Central Bank issues QR700mn of treasury bills – Qatar's Central Bank stated it sold QR700mn of treasury bills with maturities of three, six and nine months. It issued QR400mn of three-month bills with a 2.29% yield, QR200mn of six-month bills at 2.43% yield and QR100mn of nine-month bills at 2.65% yield. (Zawya) Court judgment issued against BRES by the Supreme Court – Barwa Real Estate Company (BRES) announced the issuance of a judgment by the Supreme Court in Qatar regarding the objection no. 423/2018 filed by BRES against Panceltica for Ready Made Buildings Company ‘Under Liquidation’. The outcome of the said judgment is that BRES is committed to pay Panceltica for Ready Made Buildings Company ‘Under Liquidation’ an amount of QR153,056,303.64, as well as expenses. The facts of the court case subject of the Supreme Court judgment refer to a dispute regarding a construction contract between BRES and Panceltica for Ready Made Buildings Company ‘Under Liquidation’. The dispute related to BRES’ project in Meseimeer and Al Sailiya areas, where both parties exchanged filing cases against each other during 2009 and 2010, a matter which ended with the issuance of the mentioned Supreme Court judgment. By issuance of the said Supreme Court judgment, the judged amount became final. It is expected to pay such amount in cash and additionally it will affect the statement of profit or loss of the company for the fourth quarter of 2018, in the amount of QR133mn as expenses (QSE) Qatar’s fiscal surpluses to continue, says Fitch Solutions report – Qatar’s budget balance “re-entered positive territory” in the first half of this year, Fitch Solutions stated and noted it expects “persistent surpluses” over the quarters ahead, as a result of higher hydrocarbon prices. Hydrocarbons still account for the vast majority of Qatar’s fiscal revenues, an estimated 82.7% of the total in 2017, Fitch Solutions stated. Fitch Solutions analysts have revised down their forecast for hydrocarbon prices on the back of the recent market volatility and the US’ softening approach to sanctions on Iran, expecting the Brent to average $73 a barrel in 2018 and $75 in 2019. This compares to $74.5 and $81 previously. We note that the impact of hydrocarbon price fluctuations on Qatari revenues takes some time to register, as the hydrocarbon investment income is transferred with some lag, and given that Qatari gas exports are priced against a Brent average of up to six months,” Fitch Solutions stated. According to Fitch Solutions, Qatar “looks set to move ahead with selected measures” to diversify its revenues away from hydrocarbons in the coming quarters. (Gulf-Times.com)
- 3. Page 3 of 6 Qatar Stock Exchange Top Gainers Top Decliners Source: Qatar Stock Exchange (QSE) Source: Qatar Stock Exchange (QSE) Most Active Shares by Value (QR Million) Most Active Shares by Volume (Million) Source: Qatar Stock Exchange (QSE) Source: Qatar Stock Exchange (QSE) Investor Trading Percentage to Total Value Traded Net Traded Value by Nationality (QR Million) Source: Qatar Stock Exchange (QSE) Source: Qatar Stock Exchange (QSE) 14.8% 7.0% 6.3% 6.3% 6.0% 0.0% 6.0% 12.0% 18.0% Qatari German Co. for Medical Dev. Qatar National Cement Company Alijarah Holding Doha Bank Masraf Al Rayan -7.0% -4.7% -2.8% -1.7% -1.4% -9.0% -6.0% -3.0% 0.0% Qatar Cinema & FilmDistribution Co. AhliBank The Commercial Bank Qatar Oman InvestmentCo. QNBGroup 207.4 116.7 108.0 101.1 86.4 0.0 70.0 140.0 210.0 QNB Group Barwa Real Estate Company Masraf Al Rayan Industries Qatar Doha Bank 5.7 4.7 4.0 3.9 3.0 0.0 3.0 6.0 9.0 Mazaya Qatar Real Estate Dev. Vodafone Qatar Qatar First Bank Doha Bank Barwa Real Estate Company 0% 20% 40% 60% 80% 100% Buy Sell 27.92% 44.16% 13.23% 14.13% 10.84% 12.42% 48.01% 29.30% Qatari Individuals Qatari Institutions Non-Qatari Individuals Non-Qatari Institutions 516 738 731 523 (215) 215 (400) (200) - 200 400 600 800 Qatari Non-Qatari Net Investment Total Sold Total Bought
- 4. Page 4 of 6 TECHNICAL ANALYSIS OF THE QSE INDEX Source: Bloomberg The General Index closed up by 2.26% from last week and closed at 10,598.40. The index has been creating a rising-wedge price formation, which is a bearish reversal formation (if breached downwards). However, the trend remains and intact. We keep our expected weekly support level to 9,600 points the resistance at the 11,000 level. DEFINITIONS OF KEY TERMS USED IN TECHNICAL ANALYSIS RSI (Relative Strength Index) indicator – RSI is a momentum oscillator that measures the speed and change of price movements. The RSI oscillates between 0 to 100. The index is deemed to be overbought once the RSI approaches the 70 level, indicating that a correction is likely. On the other hand, if the RSI approaches 30, it is an indication that the index may be getting oversold and therefore likely to bounce back. MACD (Moving Average Convergence Divergence) indicator – The indicator consists of the MACD line and a signal line. The divergence or the convergence of the MACD line with the signal line indicates the strength in the momentum during the uptrend or downtrend, as the case may be. When the MACD crosses the signal line from below and trades above it, it gives a positive indication. The reverse is the situation for a bearish trend. Candlestick chart – A candlestick chart is a price chart that displays the high, low, open, and close for a security. The ‘body’ of the chart is portion between the open and close price, while the high and low intraday movements form the ‘shadow’. The candlestick may represent any time frame. We use a one-day candlestick chart (every candlestick represents one trading day) in our analysis. Doji candlestick pattern – A Doji candlestick is formed when a security's open and close are practically equal. The pattern indicates indecisiveness, and based on preceding price actions and future confirmation, may indicate a bullish or bearish trend reversal. Shooting Star/Inverted Hammer candlestick patterns – These candlestick patterns have a small real body (open price and close price are near to each other), and a long upper shadow (large intraday movement on the upside). The Shooting Star is a bearish reversal pattern that forms after a rally. The Inverted Hammer looks exactly like a Shooting Star, but forms after a downtrend. Inverted Hammers represent a potential bullish trend reversal.
- 5. Page 5 of 6 Source: Bloomberg Company Name Price December 06 % Change WTD % Change YTD Market Cap. QR Million TTM P/E P/B Div. Yield Qatar National Bank 196.80 (1.35) 56.18 181,773 14.1 2.7 3.0 Qatar Islamic Bank 156.50 3.03 61.34 36,980 15.2 2.4 3.2 Commercial Bank of Qatar 41.00 (2.84) 41.87 16,594 12.2 1.1 2.4 Doha Bank 22.75 6.26 (20.18) 7,054 12.2 0.8 13.2 Al Ahli Bank 28.60 (4.67) (22.98) 6,016 9.0 1.1 3.3 Qatar International Islamic Bank 67.06 5.44 22.82 10,151 11.7 1.8 6.0 Masraf Al Rayan 42.48 5.96 12.53 31,860 15.2 2.5 4.7 Al Khalij Commercial Bank 11.20 0.63 (21.13) 4,032 7.9 0.7 6.7 Qatar First Bank 4.43 3.26 (32.16) 886 N/A 0.8 N/A National Leasing 9.10 6.31 (15.03) 450 16.1 0.5 5.5 Dlala Holding 10.24 (0.58) (30.34) 291 N/A 1.4 N/A Qatar & Oman Investment 5.85 (1.68) (25.95) 184 44.2 0.6 8.5 Islamic Holding Group 23.15 1.85 (38.27) 131 N/A 1.0 N/A Banking and Financial Services 296,402 Zad Holding 100.00 0.00 35.80 1,439 12.2 1.6 5.9 Qatar German Co. for Medical Devices 5.11 14.83 (20.90) 59 N/A 1.2 N/A Salam International Investment 4.80 5.03 (30.33) 549 N/A 0.4 N/A Medicare Group 64.71 1.91 (7.36) 1,821 21.5 1.9 2.8 Qatar Cinema & Film Distribution 20.05 (7.00) (19.80) 126 18.8 0.9 5.0 Qatar Fuel 171.21 3.12 67.75 17,023 14.8 2.4 4.7 Widam Food Co. 67.51 (0.68) 8.02 1,215 11.3 3.8 6.3 Mannai Corp. 57.57 (0.71) (3.24) 2,626 5.8 1.0 6.9 Al Meera Consumer Goods 149.01 0.01 2.84 2,980 16.7 2.2 5.7 Consumer Goods and Services 27,838 Qatar Industrial Manufacturing 43.50 0.00 (0.46) 2,067 9.7 1.3 6.9 Qatar National Cement 60.99 7.00 (3.04) 3,986 13.2 1.3 7.4 Industries Qatar 137.35 1.37 41.60 83,097 17.4 2.4 3.6 Qatari Investors Group 29.33 0.89 (19.86) 3,647 15.5 1.3 2.6 Qatar Electricity and Water 187.00 3.89 5.06 20,570 14.1 2.0 4.1 Aamal 9.58 3.68 10.37 6,035 12.5 0.8 6.3 Gulf International Services 19.00 3.49 7.34 3,531 34.6 1.0 N/A Mesaieed Petrochemical Holding 16.45 2.11 30.66 20,666 15.8 1.4 4.3 Invesment Holding Group 5.38 1.51 (11.80) 447 10.8 0.5 4.6 Industrials 144,046 Qatar Insurance 36.26 1.20 (19.83) 11,564 23.4 1.5 3.6 Doha Insurance 13.35 (0.22) (4.64) 668 15.6 0.6 5.8 Qatar General Insurance & Reinsurance 46.22 1.83 (5.67) 4,045 11.8 0.7 4.8 Al Khaleej Takaful Insurance 8.65 4.47 (34.67) 221 30.5 0.4 5.8 Qatar Islamic Insurance 55.63 4.08 1.20 834 12.0 2.3 6.3 Insurance 17,331 United Development 14.64 3.83 1.81 5,184 10.6 0.5 8.5 Barw a Real Estate 40.45 5.83 26.41 15,740 10.1 0.8 6.2 Ezdan Real Estate 12.76 0.24 5.63 33,846 44.3 1.1 N/A Mazaya Qatar Real Estate Development 8.21 5.80 (8.78) 950 29.2 0.6 N/A Real Estate 55,720 Ooredoo 81.50 3.18 (10.19) 26,106 17.4 1.2 4.3 Vodafone Qatar 8.60 3.86 7.23 7,270 N/M 1.6 N/A Telecoms 33,377 Qatar Navigation (Milaha) 69.79 1.14 24.76 7,993 15.6 0.5 5.0 Gulf Warehousing 40.88 0.02 (7.07) 2,396 10.3 1.4 4.2 Qatar Gas Transport (Nakilat) 18.50 2.21 14.91 10,249 11.4 1.5 5.4 Transportation 20,638 Qatar Exchange 595,351
- 6. Contacts Saugata Sarkar, CFA, CAIA Shahan Keushgerian Zaid al-Nafoosi , CMT, CFTe Head of Research Senior Research Analyst Senior Research Analyst Tel: (+974) 4476 6534 Tel: (+974) 4476 6509 Tel: (+974) 4476 6535 saugata.sarkar@qnbfs.com.qa shahan.keushgerian@qnbfs.com.qa zaid.alnafoosi@qnbfs.com.qa QNB Financial Services Co. W.L.L. Contact Center: (+974) 4476 6666 PO Box 24025 Doha, Qatar Disclaimer and Copyright Notice: This publication has been prepared by QNB Financial Services Co. W.L.L. (“QNBFS”) a wholly-owned subsidiary of Qatar National Bank (Q.P.S.C.). QNBFS is regulated by the Qatar Financial Markets Authority and the Qatar Exchange. Qatar National Bank (Q.P.S.C.) is regulated by the Qatar Central Bank. This publication expresses the views and opinions of QNBFS at a given time only. It is not an offer, promotion or recommendation to buy or sell securities or other investments, nor is it intended to constitute legal, tax, accounting, or financial advice. QNBFS accepts no liability whatsoever for any direct or indirect losses arising from use of this report. Any investment decision should depend on the individual circumstances of the investor and be based on specifically engaged investment advice. We therefore strongly advise potential investors to seek independent professional advice before making any investment decision. Although the information in this report has been obtained from sources that QNBFS believes to be reliable, we have not independently verified such information and it may not be accurate or complete. QNBFS does not make any representations or warranties as to the accuracy and completeness of the information it may contain, and declines any liability in that respect. For reports dealing with Technical Analysis, expressed opinions and/or recommendations may be different or contrary to the opinions/recommendations of QNBFS Fundamental Research as a result of depending solely on the historical technical data (price and volume). QNBFS reserves the right to amend the views and opinions expressed in this publication at any time. It may also express viewpoints or make investment decisions that differ significantly from, or even contradict, the views and opinions included in this report. This report may not be reproduced in whole or in part without permission from QNBFS COPYRIGHT: No part of this document may be reproduced without the explicit written permission of QNBFS. Page 6 of 6