

Recomendados
Más contenido relacionado
La actualidad más candente
La actualidad más candente (20)
Similar a QE Index Gains 1.24% as Market Cap Rises 2.73
Similar a QE Index Gains 1.24% as Market Cap Rises 2.73 (20)
Más de QNB Group
Más de QNB Group (20)
Último
Último (20)
QE Index Gains 1.24% as Market Cap Rises 2.73
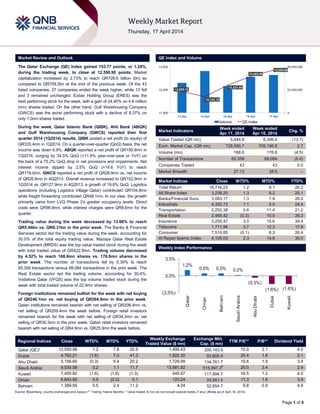
- 1. Page 1 of 5 Market Review and Outlook QE Index and Volume The Qatar Exchange (QE) Index gained 153.77 points, or 1.24%, during the trading week, to close at 12,550.98 points. Market capitalization increased by 2.73% to reach QR728.6 billion (bn) as compared to QR709.2bn at the end of the previous week. Of the 43 listed companies, 27 companies ended the week higher, while 13 fell and 3 remained unchanged. Ezdan Holding Group (ERES) was the best performing stock for the week, with a gain of 24.40% on 4.8 million (mn) shares traded. On the other hand, Gulf Warehousing Company (GWCS) was the worst performing stock with a decline of 8.37% on only 1.0mn shares traded. During the week, Qatar Islamic Bank (QIBK), Ahli Bank (ABQK) and Gulf Warehousing Company (GWCS) reported their first quarter 2014 (1Q2014) results. QIBK posted a net profit (to equity) of QR335.4mn in 1Q2014. On a quarter-over-quarter (QoQ) basis, the net income was down 6.9%. ABQK reported a net profit of QR150.8mn in 1Q2014, surging by 34.5% QoQ (+11.6% year-over-year or YoY) on the back of a 75.2% QoQ drop in net provisions and impairments. Net interest income dipped by 2.5% QoQ (+14.6 YoY) to reach QR179.0mn. GWCS reported a net profit of QR28.9mn vs. net income of QR26.8mn in 4Q2013. Overall revenue increased to QR152.9mn in 1Q2014 vs. QR127.9mn in 4Q2013, a growth of 19.6% QoQ. Logistics operations (including Logistics Village Qatar) contributed QR104.8mn while freight forwarding contributed QR48.1mn. In our view, the growth primarily came from LVQ Phase 3‟s greater occupancy levels. Direct costs were QR98.9mn, while interest charges were QR8.6mn for the quarter. Trading value during the week decreased by 13.66% to reach QR5.44bn vs. QR6.31bn in the prior week. The Banks & Financial Services sector led the trading value during the week, accounting for 30.0% of the total equity trading value. Mazaya Qatar Real Estate Development (MRDS) was the top value traded stock during the week with total traded value of QR422.8mn. Trading volume decreased by 4.52% to reach 168.6mn shares vs. 176.6mn shares in the prior week. The number of transactions fell by 5.39% to reach 65,359 transactions versus 69,084 transactions in the prior week. The Real Estate sector led the trading volume, accounting for 30.4%. Vodafone Qatar (VFQS) was the top volume traded stock during the week with total traded volume of 22.9mn shares. Foreign institutions remained bullish for the week with net buying of QR246.1mn vs. net buying of QR264.9mn in the prior week. Qatari institutions remained bearish with net selling of QR206.4mn vs. net selling of QR209.4mn the week before. Foreign retail investors remained bearish for the week with net selling of QR34.3mn vs. net selling of QR30.3mn in the prior week. Qatari retail investors remained bearish with net selling of QR4.9mn vs. QR25.9mn the week before. Market Indicators Week ended Apr 17, 2014 Week ended Apr 10, 2014 Chg. % Value Traded (QR mn) 5,444.8 6,306.4 (13.7) Exch. Market Cap. (QR mn) 728,590.7 709,196.8 2.7 Volume (mn) 168.6 176.6 (4.5) Number of Transactions 65,359 69,084 (5.4) Companies Traded 43 43 0.0 Market Breadth 27:13 38:5 – Market Indices Close WTD% MTD% YTD% Total Return 18,716.23 1.2 8.1 26.2 All Share Index 3,238.25 1.3 8.2 25.1 Banks/Financial Svcs. 3,083.17 1.3 7.9 26.2 Industrials 4,352.72 1.1 5.5 24.4 Transportation 2,252.38 0.6 11.4 21.2 Real Estate 2,465.42 (0.3) 10.0 26.2 Insurance 3,255.47 3.0 15.6 39.4 Telecoms 1,711.96 3.7 12.3 17.8 Consumer 7,519.85 (0.1) 8.3 26.4 Al Rayan Islamic Index 4,100.03 2.3 14.6 35.0 Market Indices Weekly Index Performance Regional Indices Close WTD% MTD% YTD% Weekly Exchange Traded Value ($ mn) Exchange Mkt. Cap. ($ mn) TTM P/E** P/B** Dividend Yield Qatar (QE)* 12,550.98 1.2 7.8 20.9 1,495.43 200,143.9 15.9 2.1 4.0 Dubai 4,762.21 (1.6) 7.0 41.3 1,922.30 93,805.4 20.4 1.8 2.1 Abu Dhabi 5,156.65 (0.3) 5.4 20.2 1,729.99 134,761.7 15.6 1.9 3.4 Saudi Arabia 9,530.58 0.2 1.1 11.7 13,581.82 515,997.3# 20.0 2.4 2.9 Kuwait 7,450.82 (1.6) (1.6) (1.3) 545.67 117,894.7 16.5 1.2 4.0 Oman 6,843.92 0.5 (0.2) 0.1 123.24 24,581.4 11.3 1.6 3.9 Bahrain 1,389.05 0.5 2.4 11.2 4.04 52,854.7 9.8 0.9 4.9 Source: Bloomberg, country exchanges and Zawya (** Trailing Twelve Months; * Value traded ($ mn) do not include special trades, if any) (#Data as of April 16, 2014) 12,225.19 12,144.19 12,321.89 12,453.86 12,550.98 0 22,500,000 45,000,000 11,900 12,250 12,600 13-Apr 14-Apr 15-Apr 16-Apr 17-Apr Volume QE Index 1.2% 0.5% 0.5% 0.2% (0.3%) (1.6%) (1.6%) (3.5%) 0.0% 3.5% Qatar Oman Bahrain SaudiArabia AbuDhabi Dubai Kuwait
- 2. Page 2 of 5 News Economic News MDPS: Qatar inflation up 2.6% YoY in March – According to the Ministry of Development Planning & Statistics, Qatar‟s consumer price index (CPI) rose 2.6% in March 2014 as compared to the same period in 2013. CPI was estimated at 116.6 in March, indicating an increase of 0.3% month-on- month. Rents & energy costs, which accounts for 32.2% of the overall inflation basket, increased 5.7% year-on-year (up 0.6% month-on-month). Food, beverage & tobacco prices, accounting for 13.2% of the inflation basket, rose 1.0% year-on- year but fell 0.2% month-on-month. (Gulf-Times.com) (Gulf- Times.com) Qatar to invest QR664bn in infrastructure in 5 years – The Minister of Economy & Trade, HE Sheikh Ahmed bin Jassim Al Thani, said that Qatar will invest around QR664bn on infrastructure projects, excluding projects in oil & gas sector, over the next five years. The minister stated that there are 432 building materials manufacturing companies in Qatar worth $10.4bn. These companies employ roughly 37,000 people in the areas of cement, gypsum, sand, stones, glass and fibre glass used in building materials and plastic materials, which has assumed significance in Qatar in light of the unprecedented boom in the construction and real estate sector. (GulfBase.com) Qatar’s real estate price index hits record high – The Qatar Central Bank‟s (QCB) quarterly update of the 2014 real estate price index has confirmed that the country‟s real estate prices are on the uptick. QCB‟s real estate price index reached a record 209.4 points in March 2014 from 180.1 points in the same period last year – an increase of 16.3% year-on-year. The index has been steadily growing over the past three months to hit the record high in March. QNB Group has analyzed data purely on land transactions in Qatar, based on weekly statistics published by the Ministry of Justice which suggests that land prices are a fundamental driver of rent inflation in Qatar with a six-month lag. A recovery in land prices in recent months is expected to increase rents later this year. (QNB Group, Peninsula Qatar) Market & Corporate News QIBK’s net profit drops by 6.9% QoQ in 1Q2014 – QIBK posted a net profit (to equity) of QR335.4mn in 1Q2014 vs. BBG consensus estimate of QR322.2mn. On a QoQ basis, the net income was down 6.9%. However, on a YoY basis the net income was up 15.2%. QIBK‟s loan book expanded by 4.4% year-to-date (YTD) to QR49.2bn from QR47.1bn in 2013. However, equity of unrestricted investment account holders (URIA) jumped by 17.4% YTD to QR44.5bn from QR37.9bn. Furthermore, customers deposits in current accounts increased by 14.2% YTD to QR 14.2bn vs. QR12.5bn at the end of 2013. Hence, the loan-to-deposit ratio dropped 83.8% vs. 93.6% at the end of 2013. In terms of the investment book, total investments decreased by 20.0% YTD. The decline primary came in debt securities, especially the State of Qatar debt, which declined by 28.2%. In our discussions with management of various banks, we have learnt that the recently matured government debt has not yet been fully reinvested. Furthermore, the rate of return is lower than earlier terms. We maintain our estimates; retaining our Market Perform rating and target price of QR73.27. We expect QIBK to post EPS of QR6.19 and QR6.96 for 2014 and 2015, respectively. (QNBFS Research, QE) GWCS’ net profit rises by 7.7% QoQ in 1Q2014 – Gulf Warehousing Co. (GWCS) reported a net profit of QR28.9mn vs. our estimate of QR28.9mn and net income of QR26.8mn in 4Q2013. Overall revenue increased to QR152.9mn in 1Q2014 vs. QR127.9mn in 4Q2013, a growth of 19.6% QoQ. Logistics operations (including LVQ) contributed QR104.8mn while freight forwarding contributed QR48.1mn. In our view, the growth primarily came from LVQ Phase 3‟s greater occupancy levels. Direct costs were QR98.9mn, while interest charges were QR8.6mn for the quarter. Going forward, we expect net income to grow by 20.9% and 44.8% in 2014 and 2015, respectively. (QNBFS Research, QE) ABQK’s 1Q2014 net profit is in line with our estimate – ABQK reported a net profit of QR150.8mn in 1Q2014 (in line with our estimate of QR148.6mn), surging by 34.5% QoQ (+11.6% YoY) on the back of a 75.2% QoQ drop in net provisions and impairments. Net interest income dipped by 2.5% QoQ (+14.6 YoY) to reach QR179.0mn. Annualized NIM receded to 2.87% vs. 3.20% in 4Q2013 (1Q2013: 3.11%). Non- interest income increased by 27.3% QoQ (+21.4% YoY) on the back of robust fees & commissions and investment income. Fees grew by 13.5% QoQ (+18.0% YoY) to reach QR33.9mn, while the bank booked investment income of QR10.2mn vs. QR0.3mn in 4Q2013 (1Q2013: QR5.0mn). Operating expenses improved QoQ, decreasing by 3.9% (+20.0%). Thus the cost- to-income ratio rested at 29.5% in 1Q2014 vs. 31.5% in 4Q2013 (1Q2013: 28.5%). (QNBFS Research, QE) QATI posts net profit of QR316.5mn in 1Q2014 – Qatar Insurance Company (QATI) reported a net profit of QR316.5mn as compared to QR281.6mn for the corresponding period in 1Q2013, up 12.4% YoY. EPS amounted to QR1.97 for 1Q2014 versus QR1.75 for 1Q2013. On a QoQ basis, the net profit is up 44.9%. (QE) DOHI net profit drops 16.6% to QR23.3mn in 1Q2014 – Doha Insurance Co. (DOHI) posted a net profit of QR23.3mn in 1Q2014, down 16.6% QoQ (+9.4% YoY). Net underwriting income decreased by 24.0% QoQ (+3.3% YoY), reaching QR18.4mn. On the other hand, investment & other income jumped 13.2% QoQ (+25.1% YoY), reaching QR19.4mn. (QE) DHBK to buy HSBC Oman’s India business – Doha Bank (DHBK) Chairman Sheikh Fahad bin Mohamed bin Jabor al- Thani said the bank has entered into an agreement with HSBC Bank Oman, to purchase HSBC Oman‟s banking business in India. He stated that all staff working in this operation would be transferred to DHBK as a part of the purchase. The business being acquired consists of HSBC Oman‟s two branches and gross assets of $58mn as on December 31, 2013. Sheikh Fahad also stated that the transaction was subject to approvals from regulatory authorities in Qatar, India, Oman and Jersey. (Gulf-Times.com) QE amends foreign ownership limit for CBQK – The Qatar Exchange has announced that the ownership limit of non-Qatari investors for the Commercial Bank of Qatar (CBQK) would be 25% with effect from April 13, 2014. (QE) ETFs to debut on QE, to boost liquidity – According to sources, exchange traded funds (ETFs) are set to make their debut next week (April 23) on the Qatar Exchange (QE) as the bourse enters the MSCI „emerging‟ market grouping by June. As part of QE‟s measures to enhance liquidity in the market, foreign debt-based and general index-based ETFs are set to be launched initially, which will be followed by Islamic-index based ETFs by the end of summer. (Gulf-Times.com)
- 3. Page 3 of 5 Qatar Exchange Top 5 Gainers Top 5 Decliners Source: Qatar Exchange (QE) Source: Qatar Exchange (QE) Most Active Shares by Value (QR Million) Most Active Shares by Volume (Million) Source: Qatar Exchange (QE) Source: Qatar Exchange (QE) Investor Trading Percentage to Total Value Traded Net Traded Value by Nationality (QR Million) Source: Qatar Exchange (QE) Source: Qatar Exchange (QE) 24.4% 18.0% 15.9% 13.3% 11.9% 0.0% 10.0% 20.0% 30.0% Ezdan Real Estate Vodafone Qatar Qatar General Insurance & Reinsurance Aamal Qatar National Cement -8.4% -6.6% -5.6% -2.4% -2.2% -12.0% -8.0% -4.0% 0.0% Gulf Warehousing Mazaya Qatar Qatar Cinema & Film Distribution Industries Qatar Mesaieed Petrochemical Holding Company 422.8 369.4 364.0 363.9 349.4 0.0 200.0 400.0 600.0 Mazaya Qatar United Development Masraf Al Rayan Barwa Real Estate Vodafone Qatar 22.9 20.4 20.1 16.2 12.0 0.0 10.0 20.0 30.0 Vodafone Qatar Mazaya Qatar Salam International Investment United Development Qatar & Oman Investment 0% 20% 40% 60% 80% 100% Buy Sell 50.38% 50.47% 17.64% 21.43% 16.73% 17.36% 15.25% 10.73% Qatari Individuals Qatari Institutions Non-Qatari Individuals Non-Qatari Institutions 3,704 1,741 3,915 1,529 (211) 212 (1,000) - 1,000 2,000 3,000 4,000 5,000 Qatari Non-Qatari Net Investment Total Sold Total Bought
- 4. Page 4 of 5 TECHNICAL ANALYSIS OF THE QE INDEX Source: Bloomberg The QE Index extended its gains for the fifth consecutive week. The index started on a bearish note, witnessing profit booking on Sunday and Monday. However, it bounced back strongly in the latter part of the week, recovering from a low of 12,045.88 to close at 12,550.98, up 1.2% for the week. This was a nice display of strength as a sustained buying interest pushed the price higher. The QE Index is witnessing strong momentum and is currently on a long- term bull run. The index has broken above its resistance level of 12,514 and Thursday‟s intra-day high of 12,678 will be the next strong resistance level. On the downside, the index has support near 12,375.0 followed by its next important support level near 12,220.0. The MACD continues to trend higher, implying continuation of the uptrend. However, the RSI has just given a negative divergence, as the QE Index made a new high, while the RSI did not. This is concerning, as it points towards a correction in the near term. DEFINITIONS OF KEY TERMS USED IN TECHNICAL ANALYSIS RSI (Relative Strength Index) indicator – RSI is a momentum oscillator that measures the speed and change of price movements. The RSI oscillates between 0 to 100. The index is deemed to be overbought once the RSI approaches the 70 level, indicating that a correction is likely. On the other hand, if the RSI approaches 30, it is an indication that the index may be getting oversold and therefore likely to bounce back. MACD (Moving Average Convergence Divergence) indicator – The indicator consists of the MACD line and a signal line. The divergence or the convergence of the MACD line with the signal line indicates the strength in the momentum during the uptrend or downtrend, as the case may be. When the MACD crosses the signal line from below and trades above it, it gives a positive indication. The reverse is the situation for a bearish trend. Candlestick chart – A candlestick chart is a price chart that displays the high, low, open, and close for a security. The „body‟ of the chart is portion between the open and close price, while the high and low intraday movements form the „shadow‟. The candlestick may represent any time frame. We use a one-day candlestick chart (every candlestick represents one trading day) in our analysis. Doji candlestick pattern – A Doji candlestick is formed when a security's open and close are practically equal. The pattern indicates indecisiveness, and based on preceding price actions and future confirmation, may indicate a bullish or bearish trend reversal. Shooting Star/Inverted Hammer candlestick patterns – These candlestick patterns have a small real body (open price and close price are near to each other), and a long upper shadow (large intraday movement on the upside). The Shooting Star is a bearish reversal pattern that forms after a rally. The Inverted Hammer looks exactly like a Shooting Star, but forms after a downtrend. Inverted Hammers represent a potential bullish trend reversal.
- 5. Contacts Saugata Sarkar Keith Whitney Sahbi Kasraoui Head of Research Head of Sales Manager - HNWI Tel: (+974) 4476 6534 Tel: (+974) 4476 6533 Tel: (+974) 4476 6544 saugata.sarkar@qnbfs.com.qa keith.whitney@qnbfs.com.qa sahbi.alkasraoui@qnbfs.com.qa QNB Financial Services SPC Contact Center: (+974) 4476 6666 PO Box 24025, Doha, Qatar DISCLAIMER: This publication has been prepared by QNB Financial Services SPC (“QNBFS”) a wholly-owned subsidiary of Qatar National Bank (“QNB”). QNBFS is regulated by the Qatar Financial Markets Authority and the Qatar Exchange; QNB is regulated by the Qatar Central Bank. This publication expresses the views and opinions of QNBFS at a given time only. It is not an offer, promotion or recommendation to buy or sell securities or other investments, nor is it intended to constitute legal, tax, accounting, or financial advice. We therefore strongly advise potential investors to seek independent professional advice before making any investment decision. Although the information in this report has been obtained from sources that QNBFS believes to be reliable, we have not independently verified such information and it may not be accurate or complete. While this publication has been prepared with the utmost degree of care by our analysts, QNBFS does not make any representations warranties as to the accuracy and completeness of the information it may contain, and declines any liability in that respect. QNBFS reserves the right to amend the views and opinions expressed in this publication at any time. It may also express viewpoints or make investment decisions that differ significantly from, or even contradict, the views and opinions included in this report. COPYRIGHT: No part of this document may be reproduced without the explicit written permission of QNBFS. Page 5 of 5 Source: Bloomberg Company Name Price (April 17) % Change 5- Day % Change YTD Market Cap. QR Million TTM P/E P/B Div. Yield Qatar National Bank 192.00 (1.99) 11.63 134,348 13.8 2.7 3.6 Qatar Islamic Bank 83.90 5.27 21.59 19,825 14.5 1.8 4.8 Commercial Bank of Qatar 68.70 (1.43) 16.44 20,399 12.7 1.3 2.4 Doha Bank 63.00 1.45 8.25 16,277 10.9 1.4 7.1 Al Ahli Bank 52.20 0.38 23.38 8,623 15.9 2.4 N/A Qatar International Islamic Bank 84.50 1.20 36.95 12,791 17.0 2.4 4.4 Masraf Al Rayan 47.20 7.76 50.80 35,400 20.8 3.4 3.2 Al Khaliji Bank 23.19 2.43 16.01 8,348 15.2 1.5 4.3 National Leasing 32.30 (1.82) 7.13 1,598 18.3 1.2 4.6 Dlala Holding 29.50 5.36 33.48 655 NM 2.9 N/A Qatar & Oman Investment 13.88 2.81 10.86 437 22.0 1.3 4.3 Islamic Holding Group 67.70 2.58 47.17 271 27.4 4.6 2.5 Banking and Financial Services 258,973 Zad Holding 81.40 1.50 17.12 1,065 10.8 0.8 4.9 Qatar German Co. for Medical Devices 13.85 (1.07) 0.00 160 NM 0.9 N/A Salam International Investment 13.97 5.12 7.38 1,597 14.0 0.9 7.2 Medicare Group 81.50 3.30 55.24 2,294 25.6 2.8 2.2 Qatar Cinema & Film Distribution 40.60 (5.58) 1.25 232 20.3 1.6 4.9 Qatar Fuel 257.10 (1.27) 17.65 21,715 17.9 3.4 3.0 Qatar Meat and Livestock 64.70 2.54 25.15 1,165 21.2 4.7 3.2 Al Meera Consumer Goods 182.00 0.55 36.53 3,640 17.7 2.7 4.4 Consumer Goods and Services 31,866 Qatar Industrial Manufacturing 46.70 3.55 10.75 2,219 11.0 1.6 5.4 Qatar National Cement 144.00 11.89 21.01 7,070 16.2 2.7 4.2 Industries Qatar 180.00 (2.44) 6.57 108,900 13.6 3.2 6.1 Qatari Investors Group 61.80 4.75 41.42 7,683 34.0 3.7 1.2 Qatar Electricity and Water 184.00 (0.65) 11.27 20,240 14.6 3.3 3.7 Mannai Corp. 103.00 (0.29) 14.57 4,699 10.6 2.1 5.3 Aamal 19.00 13.30 26.67 11,400 22.6 1.7 N/A Gulf International Services 92.50 1.65 89.55 17,190 25.4 5.6 1.7 Mesaieed Petrochemical Holding 36.00 (2.17) N/A 45,227 N/A N/A 1.0 Industrials 224,630 Qatar Insurance 75.00 0.81 40.98 12,041 15.0 2.3 2.7 Doha Insurance 24.00 (1.23) (4.00) 618 9.2 1.1 8.3 Qatar General Insurance & Reinsurance 47.50 15.85 19.00 3,286 1.5 0.7 2.6 Al Khaleej Takaful Insurance 35.30 0.00 25.73 784 11.9 1.3 1.8 Qatar Islamic Insurance 69.90 0.58 20.73 1,049 16.5 3.8 5.4 Insurance 17,776 United Development 22.60 0.89 4.95 8,002 24.8 0.8 4.2 Barwa Real Estate 37.00 0.00 24.16 14,398 12.2 1.0 5.4 Ezdan Real Estate 31.35 24.40 84.41 83,156 NM 2.9 1.0 Mazaya Qatar Real Estate Development 20.55 (6.59) 83.81 2,055 15.3 1.7 2.9 Real Estate 107,611 Qatar Telecom 149.00 0.74 8.60 47,728 18.5 1.9 2.7 Vodafone Qatar 16.28 17.97 52.01 13,763 NM 2.3 N/A Telecoms 61,491 Qatar Navigation (Milaha) 97.00 0.00 16.87 11,109 11.6 0.9 5.2 Gulf Warehousing 58.00 (8.37) 39.76 2,759 25.1 3.4 2.6 Qatar Gas Transport (Nakilat) 22.10 3.51 9.14 12,376 16.7 2.8 5.0 Transportation 26,243 Qatar Exchange 728,591