

Recomendados
Más contenido relacionado
La actualidad más candente
La actualidad más candente (20)
Destacado
Destacado (10)
Similar a Weekly market report
Similar a Weekly market report (20)
Más de QNB Group
Más de QNB Group (20)
Último
Último (20)
Weekly market report
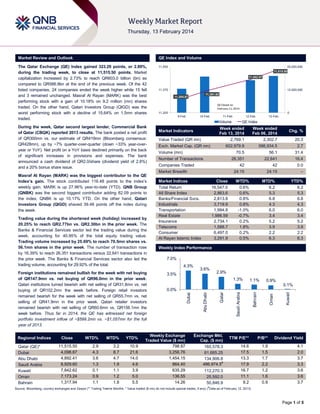
- 1. Market Review and Outlook QE Index and Volume The Qatar Exchange (QE) Index gained 323.29 points, or 2.89%, during the trading week, to close at 11,515.50 points. Market capitalization increased by 2.73% to reach QR603.0 billion (bn) as compared to QR586.9bn at the end of the previous week. Of the 42 listed companies, 24 companies ended the week higher while 15 fell and 3 remained unchanged. Masraf Al Rayan (MARK) was the best performing stock with a gain of 10.18% on 9.2 million (mn) shares traded. On the other hand, Qatari Investors Group (QIGD) was the worst performing stock with a decline of 15.64% on 1.5mn shares traded. 11,550 11,452.97 11,375 12,500,000 11,361.62 11,305.87 QE Closed on February 11, 2014 11,200 0 9-Feb 10-Feb 11-Feb Volume Week ended Feb 06, 2014 2,302.7 602,979.9 586,934.5 2.7 56.1 31.4 26,351 22,641 16.4 42 42 0.0 24:15 24:15 – Exch. Market Cap. (QR mn) Volume (mn) Number of Transactions Companies Traded Regional Indices Qatar (QE)* Dubai Abu Dhabi Saudi Arabia Kuwait Oman Bahrain Close 11,515.50 4,098.67 4,892.41 8,929.60 7,842.62 7,173.24 1,317.94 WTD% MTD% YTD% 2.9 4.3 3.6 1.3 0.1 0.9 1.1 3.2 8.7 4.7 1.9 1.1 1.2 1.8 10.9 21.6 14.0 4.6 3.9 5.0 5.5 Market Indices Close Total Return 16,547.0 All Share Index 2,863.6 Banks/Financial Svcs. 2,813.8 Industrials 3,719.9 Transportation 1,994.8 Real Estate 1,986.59 Insurance 2,734.1 Telecoms 1,588.7 Consumer 6,497.0 Al Rayan Islamic Index 3,291.9 Market Indices Weekly Index Performance WTD% 0.6% 0.6% 0.8% 0.8% -1.0% -0.7% 0.2% 1.8% 0.2% 0.5% Chg. % 20.3 MTD% 6.2 5.3 6.8 4.3 6.0 3.4 5.2 3.9 2.2 6.3 YTD% 6.2 5.3 6.8 4.3 6.0 3.4 5.2 3.9 2.2 6.3 7.0% 4.3% 3.6% 3.5% 2.9% 1.3% 1.1% 0.9% 0.1% Weekly Exchange Traded Value ($ mn) 798.87 3,256.76 1,454.15 864.40 635.29 136.55 14.26 Exchange Mkt. Cap. ($ mn) 165,578.3 81,685.25 134,906.8 486,974.5# 112,270.3 25,592.0 50,846.9 Kuwait Oman Bahrain Qatar 0.0% Abu Dhabi Foreign institutions remained bullish for the week with net buying of QR147.9mn vs. net buying of QR96.0mn in the prior week. Qatari institutions turned bearish with net selling of QR31.8mn vs. net buying of QR102.2mn the week before. Foreign retail investors remained bearish for the week with net selling of QR55.7mn vs. net selling of QR41.9mn in the prior week. Qatari retailer investors remained bearish with net selling of QR60.6mn vs. QR156.1mn the week before. Thus far in 2014, the QE has witnessed net foreign portfolio investment inflow of ~$599.2mn vs. ~$1,057mn for the full year of 2013. QE Index 70.5 Value Traded (QR mn) Dubai Trading value during the shortened week (holiday) increased by 20.25% to reach QR2.77bn vs. QR2.30bn in the prior week. The Banks & Financial Services sector led the trading value during the week, accounting for 40.95% of the total equity trading value. Trading volume increased by 25.69% to reach 70.5mn shares vs. 56.1mn shares in the prior week. The number of transaction rose by 16.39% to reach 26,351 transactions versus 22,641 transactions in the prior week. The Banks & Financial Services sector also led the trading volume, accounting for 29.92% of the total. 13-Feb Week ended Feb 13, 2014 2,769.1 Market Indicators Market Breadth Masraf Al Rayan (MARK) was the biggest contributor to the QE Index’s gain. The stock contributed 116.48 points to the index‟s weekly gain. MARK is up 27.96% year-to-date (YTD). QNB Group (QNBK) was the second biggest contributor adding 82.09 points to the index; QNBK is up 10.17% YTD. On the other hand, Qatari Investors Group (QIGD) shaved 39.48 points off the index during the week. 12-Feb Saudi Arabia During the week, Qatar second largest lender, Commercial Bank of Qatar (CBQK) reported 2013 results. The bank posted a net profit of QR300mn vs. our estimate of QR419mn (Bloomberg consensus: QR428mn), up by ~7% quarter-over-quarter (down ~33% year-overyear or YoY). Net profit on a YoY basis declined primarily on the back of significant increases in provisions and expenses. The bank announced a cash dividend of QR2.0/share (dividend yield of 2.8%) and a 20% bonus share issue. 25,000,000 11,515.50 TTM P/E** P/B** Dividend Yield 14.6 17.5 13.3 17.9 16.7 11.1 9.2 1.9 1.5 1.7 2.2 1.2 1.6 0.9 4.1 2.0 3.7 3.3 3.6 3.6 3.7 # Source: Bloomberg, country exchanges and Zawya (** Trailing Twelve Months; * Value traded ($ mn) do not include special trades, if any) ( Data as of February 12, 2013) Page 1 of 5
- 2. News Economic News QNB Group: Qatar’s inflation may rise to 3.8% in 2014 from 3.1% last year – According to a QNB Group report, Qatar‟s inflation may rise to 3.8% this year from 3.1% last year in view of a recovery in land prices in December and January. A recovery in land prices in December and January could reverse the slowdown in rent inflation by mid-2014. Rent inflation has slowed in recent months in line with QNB Group‟s projections, tracking movements in the underlying price of land. Rent inflation slowed from 6.7% in the year to August 2013 to 4.8% in the year to December 2013, based on the Consumer Price Index (CPI) data released by the Ministry of Development Planning & Statistics (MSDP). QNB Group has analyzed data purely on land transactions in Qatar, based on weekly statistics published by the Ministry of Justice (MoJ). This data suggests that the slowdown in rent inflation tracked land prices with a sixmonth delay. Land prices fell from March to November 2013 on the basis of an average of prices for the last 12 months (which reduces the impact of seasonal factors and single large transactions). QNB Group said as rents tend to follow land prices with a six-month delay, we expect rent inflation to continue to slow to below 4% between now and May 2014. The report added that land prices are a fundamental driver of rents in Qatar and falling land prices are likely to slow rent inflation. Land is the main component of the cost of building, developing and buying real estate. (Gulf-Times.com) Market & Corporate News CBQK: Weak 4Q2013 profitability on the back of significant provisions and expenses – CBQK posted a net profit of QR300mn vs. our estimate of QR419mn (Bloomberg consensus: QR428mn), up by ~7% QoQ (down ~33% YoY). Net profit on a YoY basis declined primarily on the back of significant increases in provisions and expenses. The bank booked provisions of QR267mn in 4Q2013 vs. QR101mn in 4Q2012 (3Q2013: QR231mn). Net interest income dipped by 2% QoQ (+37% YoY) to reach QR632mn. Commercial Bank registered non-interest income (including income from associates) of QR464mn in 4Q2013 vs. QR274mn in 3Q2013 which translates into a growth of 69% QoQ (+15% YoY). This robust performance was mainly due to higher fees & commissions and higher foreign exchange income. Operating expenses (mainly attributed to ABank) hindered the growth stemming from net operating income. Expenses surged by 45% and 83% QoQ and YoY, respectively. Moreover, the bank‟s cost-to-income ratio deteriorated in 4Q2013 (48%) vs. 37% in 4Q2012. The bank announced a cash dividend of QR2.0/share (DY: 2.8%) vs. our estimate of QR5.50/share and a 20% bonus share issue. While the cut makes business sense, we await further color from management to determine the dividend policy going forward. Loans significantly expanded QoQ and YoY. CBQK‟s loan book grew by 3% QoQ (+38% YoY). Moreover, deposits followed suit and expanded by 9% QoQ (+52% YoY). As such, the LDR rested at 106% vs. 112% in 3Q2013 (117% at the end of 2012). The growth in loans and deposits is a onetime occurrence due to the consolidation of ABank. ABank contributed 17% and 13% to overall loans and deposits, respectively. Finally, CBQK‟s investment portfolio expanded by 25% QoQ (+59% YoY). CBQK‟s NPL ratio marginally deteriorated QoQ to 3.6% vs. 3.3% in 3Q2013 (1.1% at the end of 2012). Moreover, the bank issued Tier 1 Capital Notes (QR2bn) which improved the CAR to 14.1% vs. 12.5% in 9M2013 (2012:17.0%). We maintain our target price of QR87.59/share and rate the stock an Outperform. While reported 4Q2013 results were below our estimates, we believe that the reduction in dividends along with the additional provisioning undertaken during the quarter should benefit the bank‟s expansion strategy/profitability going forward. QIMD reports net profit of QR202.1mn in 2013 – QIMD‟s financials revealed a net profit of QR202.1mn in 2013 versus QR208.2mn in 2012. Earnings per Share (EPS) amounted to QR5.11 in 2013 compared to QR5.26 in 2012. The company‟s Board of Directors recommended 20% bonus shares along with the results. (QE) QGRI reports net profit of QR1.37bn in 4Q2013 – Qatar General Insurance & Reinsurance Company (QGRI) has reported a net profit of QR1.37bn in 4Q2013 as compared to QR19.3mn in 3Q2013. The net earned premiums was QR52.8mn in 4Q2013 indicating a fall of 0.1% QoQ. For the full year 2013, EPS amounted to QR36.96 vs. QR3.04 in 2012. The significant increase in 4Q2013 net income is due to fair value gain on investment properties of QR2.0bn in 2013 vs. QR39.9mn in 2012. Meanwhile, QGRI‟s board of directors has recommended a cash dividend of QR1.50 and a 20% stock dividend per share, which will have to be approved by shareholders at the annual general assembly, scheduled on March 16, 2014. (QE) QFLS report net profit QR1.2bn profit in 2013 – Qatar Fuel Company (Woqod) posted a net profit of QR1.2bn in 2013 vs. QR1.1bn in 2012. Earnings per Share (EPS) amounted to QR18.72 in 2013 compared to QR17.70 in 2012. QFLS‟ Board of Directors recommended cash dividends of QR10.0 per share, in addition to 30% bonus shares i.e. 3 shares per 10 outstanding shares. (QE) QIGD post net profit of QR220.6mn for 2013 – Qatari Investors Group (QIGD) posted a net profit of QR220.6mn in 2013 versus QR152.2mnn in 2012. Earnings per Share (EPS) amounted to QR1.77 in 2013 compared to QR1.22 in 2012. The Board has recommended distribution of cash dividends of QR0.75 per share (same as last year). This recommendation will be raised to the Ordinary-General Assembly meeting which will take place at Al Mirqab Hall, Four Seasons Hotel on Wednesday, 26th February, 2014 at 4.00 pm. In case a quorum is not met, the Extra-General Assembly meeting will be held on Wednesday, 5th March 2014 at 4:00pm on the same venue. (QE) QNB Group aims to be top lender in Mideast, Africa by 2017 – QNB Group‟s Chief Financial Officer has said that the bank is aiming to become the largest lender in the Middle East and Africa, as it continues to look beyond its home market for new growth opportunities. QNB Group, currently the biggest bank in the Gulf region, is looking for acquisition targets in Turkey, Morocco and sub-Saharan Africa. He further added that the bank is targeting 31% of its profits and 26% of its lending to come from its international operations in 2014, up from 28% and 19% respectively in 2013. The bank hopes to achieve 40% of its profits from foreign sources by 2017. The bank is targeting a net profit gain of 7-9% and a loan growth of 12-14% in 2014. (Gulf-Times.com) Page 2 of 5
- 3. Qatar Exchange Top 5 Gainers Top 5 Decliners 0.0% 12.0% 10.2% -2.9% -2.7% Mannai Corp. -3.6% Ezdan Real Estate -4.5% 7.7% 8.0% -6.0% 7.2% 5.6% 5.4% 4.0% -12.0% -15.6% 0.0% Masraf Al Rayan Qatar Fuel Vodafone Qatar Qatar General Qatar Insurance & International Reinsurance Islamic Bank Source: Qatar Exchange (QE) -18.0% Qatari Investors Group Dlala Holding National Leasing Source: Qatar Exchange (QE) Most Active Shares by Value (QR Million) Most Active Shares by Volume (Million) 600.0 24.0 18.8 400.0 357.9 16.0 257.6 226.4 9.2 206.9 177.0 200.0 8.0 5.8 5.1 3.7 0.0 0.0 Masraf Al Rayan Commercial Bank of Qatar Vodafone Qatar Industries Qatar Source: Qatar Exchange (QE) Barwa Real Estate Vodafone Qatar Masraf Al Rayan Barwa Real Estate United Development Commercial Bank of Qatar Source: Qatar Exchange (QE) Investor Trading Percentage to Total Value Traded Net Traded Value by Nationality (QR Million) 92 16.01% 100% 21.35% 80% 13.13% 60% 20.42% 21.57% 45.10% 47.29% Non-Qatari 863 15.14% 955 40% (92) 20% Qatari 1,907 1,814 0% Buy Sell Qatari Individuals Qatari Institutions Non-Qatari Individuals Non-Qatari Institutions Source: Qatar Exchange (QE) (500) Net Investment 500 1,000 Total Sold 1,500 2,000 2,500 Total Bought Source: Qatar Exchange (QE) Page 3 of 5
- 4. TECHNICAL ANALYSIS OF THE QE INDEX Source: Bloomberg The QE Index extended its relentless rally in a truncated week, registering gains on every single trading day tagging a new 52-week high. The positive development was that the index managed to cling onto its support near the 11,170.0 level and cleared the (11,200.0, 11,300.0, 11,400.0 and 11,500.0) psychological levels as strong buying interest pushed the index at its highest point since 2008. The index after witnessing a strong rally a couple of weeks back, witnessed correction creating a strong base near the 11,000.0 level and rebounded to record an impressive rally. The index is currently in strong bullrun mode and may continue its bullish momentum toward the 11,600.0-11,700.0-750.0 levels as it has little resistance until then. We believe the bulls may continue their dominance over the bears until the index trades above the support of the ascending trendline. However, traders may need to keep a close watch near the 10,450.0 level for any reversal signs. Any dip below this level may provide a buying opportunity near the 10,340.0 level. Meanwhile, the index has support for a further higher move from the RSI which is trending strongly in the overbought territory, while the MACD has crossed the signal line into the positive territory indicating the possibility of a prolonged near-term uptrend. Thus, traders may adopt a bullish approach, and accumulate on every possible dip, but must also follow strict stop losses. DEFINITIONS OF KEY TERMS USED IN TECHNICAL ANALYSIS RSI (Relative Strength Index) indicator – RSI is a momentum oscillator that measures the speed and change of price movements. The RSI oscillates between 0 to 100. The index is deemed to be overbought once the RSI approaches the 70 level, indicating that a correction is likely. On the other hand, if the RSI approaches 30, it is an indication that the index may be getting oversold and therefore likely to bounce back. MACD (Moving Average Convergence Divergence) indicator – The indicator consists of the MACD line and a signal line. The divergence or the convergence of the MACD line with the signal line indicates the strength in the momentum during the uptrend or downtrend, as the case may be. When the MACD crosses the signal line from below and trades above it, it gives a positive indication. The reverse is the situation for a bearish trend. Candlestick chart – A candlestick chart is a price chart that displays the high, low, open, and close for a security. The „body‟ of the chart is portion between the open and close price, while the high and low intraday movements form the „shadow‟. The candlestick may represent any time frame. We use a one-day candlestick chart (every candlestick represents one trading day) in our analysis. Doji candlestick pattern – A Doji candlestick is formed when a security's open and close are practically equal. The pattern indicates indecisiveness, and based on preceding price actions and future confirmation, may indicate a bullish or bearish trend reversal. Shooting Star/Inverted Hammer candlestick patterns – These candlestick patterns have a small real body (open price and close price are near to each other), and a long upper shadow (large intraday movement on the upside). The Shooting Star is a bearish reversal pattern that forms after a rally. The Inverted Hammer looks exactly like a Shooting Star, but forms after a downtrend. Inverted Hammers represent a potential bullish trend reversal. Page 4 of 5
- 5. Price % Change 5(Feb 06) Day % Change YTD Market Cap. QR Million TTM P/E P/B Div. Yield 189.50 5.28 10.17 132,599 14.0 2.5 3.7 Qatar Islamic Bank 81.00 5.19 17.39 19,140 14.4 1.6 4.6 Commercial Bank of Qatar 71.50 (1.79) 0.99 17,692 11.0 1.1 8.4 Doha Bank 65.40 1.08 12.37 16,898 11.4 1.5 6.3 Al Ahli Bank 64.20 (1.98) 16.73 8,158 15.5 2.3 4.7 Qatar International Islamic Bank 73.90 5.42 19.77 11,186 14.9 2.1 4.7 Masraf Al Rayan 40.05 10.18 27.96 30,038 17.6 2.9 2.5 Al Khaliji Bank 21.20 4.13 6.05 7,632 13.9 1.4 4.7 National Leasing 29.45 (3.60) (2.32) 1,457 16.7 1.1 5.1 Dlala Holding 20.25 (4.48) (8.37) 450 N/M 2.0 N/A Qatar & Oman Investment 12.40 (1.59) (0.96) 391 26.0 1.2 4.0 Islamic Holding Group 45.45 0.11 (1.20) 182 20.1 3.1 2.5 Company Name Qatar National Bank 245,821 Banking and Financial Services Zad Holding 70.00 0.00 0.72 916 9.3 0.7 5.7 Qatar German Co. for Medical Devices 14.50 2.11 4.69 167 N/M 0.9 N/A Salam International Investment 14.37 1.41 10.45 1,643 14.4 1.0 4.9 Medicare Group 57.00 5.36 8.57 1,604 26.1 2.1 3.2 Qatar Cinema & Film Distribution 42.50 4.81 5.99 243 32.5 1.8 4.7 312.60 7.68 10.03 20,309 17.0 3.4 3.2 48.00 0.00 (7.16) 864 14.4 3.5 8.3 152.30 3.61 14.25 3,046 20.9 2.4 5.3 Qatar Fuel Qatar Meat and Livestock Al Meera Consumer Goods 28,792 Consumer Goods and Services 52.00 (0.76) 2.77 2,059 9.8 1.5 5.8 Qatar National Cement 117.00 (0.43) (1.68) 5,745 13.2 2.3 5.1 Industries Qatar 179.20 3.58 6.10 108,416 13.3 3.4 4.3 5,097 23.1 2.4 1.8 0.99 18,370 13.3 3.0 4.0 Qatar Industrial Manufacturing 41.00 Qatari Investors Group (15.64) (6.18) Qatar Electricity and Water 183.70 1.16 Mannai Corp. 102.00 (2.86) 13.46 4,653 10.1 2.0 4.7 Aamal 14.70 (0.41) (2.00) 8,820 14.0 1.3 N/A Gulf International Services 84.30 2.18 12,533 20.7 4.4 1.8 38.20 165,694 Industrials Qatar Insurance 82.00 0.74 23.31 10,531 12.9 2.0 2.5 Doha Insurance 30.50 0.16 22.00 785 11.7 1.4 3.0 Qatar General Insurance & Reinsurance 47.50 5.56 (0.84) 2,738 1.3 0.8 1.8 Al Khaleej Takaful Insurance 38.40 (0.26) 5.21 656 13.7 1.1 2.2 Qatar Islamic Insurance 65.00 3.17 12.26 975 15.3 3.5 5.4 15,685 Insurance United Development 22.43 (0.49) (0.80) 7,564 9.2 0.7 4.5 Barwa Real Estate 30.55 (0.33) 2.52 11,888 17.4 0.9 4.9 Ezdan Real Estate 16.50 (2.65) (2.94) 43,766 N/M 1.6 0.8 Mazaya Qatar Real Estate Development 12.36 (1.12) 10.55 1,236 18.7 1.1 4.9 64,454 Real Estate 148.50 0.20 8.24 47,568 18.0 1.9 3.4 12.36 7.20 15.41 10,449 N/M 1.8 N/A Qatar Navigation (Milaha) 91.60 2.92 10.36 10,491 10.7 0.9 4.1 Gulf Warehousing 42.00 0.00 1.20 1,998 19.7 2.5 N/A Qatar Gas Transport (Nakilat) Transportation 21.48 3.27 6.07 12,029 15.7 3.4 4.7 Qatar Telecom Vodafone Qatar 58,017 Telecoms 24,517 Qatar Exchange 602,980 Source: Bloomberg Contacts Saugata Sarkar Ahmed M. Shehada Keith Whitney Sahbi Kasraoui Head of Research Head of Trading Head of Sales Manager - HNWI Tel: (+974) 4476 6534 Tel: (+974) 4476 6535 Tel: (+974) 4476 6533 Tel: (+974) 4476 6544 saugata.sarkar@qnbfs.com.qa ahmed.shehada@qnbfs.com.qa keith.whitney@qnbfs.com.qa sahbi.alkasraoui@qnbfs.com.qa QNB Financial Services SPC Contact Center: (+974) 4476 6666 PO Box 24025, Doha, Qatar DISCLAIMER: This publication has been prepared by QNB Financial Services SPC (“QNBFS”) a wholly-owned subsidiary of Qatar National Bank (“QNB”). QNBFS is regulated by the Qatar Financial Markets Authority and the Qatar Exchange; QNB is regulated by the Qatar Central Bank. This publication expresses the views and opinions of QNBFS at a given time only. It is not an offer, promotion or recommendation to buy or sell securities or other investments, nor is it intended to constitute legal, tax, accounting, or financial advice. We therefore strongly advise potential investors to seek independent professional advice before making any investment decision. Although the information in this report has been obtained from sources that QNBFS believes to be reliable, we have not independently verified such information and it may not be accurate or complete. While this publication has been prepared with the utmost degree of care by our analysts, QNBFS does not make any representations warranties as to the accuracy and completeness of the information it may contain, and declines any liability in that respect. QNBFS reserves the right to amend the views and opinions expressed in this publication at any time. It may also express viewpoints or make investment decisions that differ significantly from, or even contradict, the views and opinions included in this report. COPYRIGHT: No part of this document may be reproduced without the explicit written permission of QNBFS. Page 5 of 5