1. Page 1 of 5
Market Review and Outlook QE Index and Volume
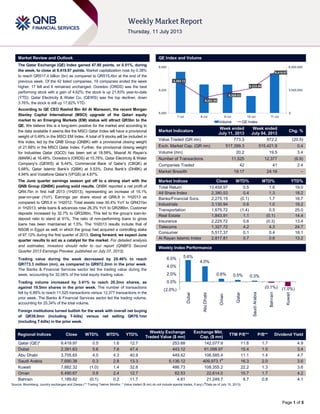
The Qatar Exchange (QE) Index gained 47.80 points, or 0.51%, during
the week, to close at 9,419.97 points. Market capitalization rose by 0.38%
to reach QR517.4 billion (bn) as compared to QR515.4bn at the end of the
previous week. Of the 42 listed companies, 19 companies ended the week
higher, 17 fell and 6 remained unchanged. Ooredoo (ORDS) was the best
performing stock with a gain of 4.62%; the stock is up 21.83% year-to-date
(YTD). Qatar Electricity & Water Co. (QEWS) was the top decliner, down
3.76%; the stock is still up 17.82% YTD.
According to QE CEO Rashid Bin Ali Al Mansoori, the recent Morgan
Stanley Capital International (MSCI) upgrade of the Qatari equity
market to an Emerging Markets (EM) status will attract QR3bn to the
QE. We believe this is a long-term positive for the market and according to
the data available it seems like the MSCI Qatar Index will have a provisional
weight of 0.49% in the MSCI EM Index. A total of 9 stocks will be included in
this index, led by the QNB Group (QNBK) with a provisional closing weight
of 21.68% in the MSCI Qatar Index. Further, the provisional closing weight
for Industries Qatar (IQCD) has been set at 18.59%, Masraf Al Rayan‟s
(MARK) at 16.48%, Ooredoo‟s (ORDS) at 15.78%, Qatar Electricity & Water
Company‟s (QEWS) at 6.44%, Commercial Bank of Qatar‟s (CBQK) at
5.68%, Qatar Islamic Bank‟s (QIBK) at 5.53%, Doha Bank‟s (DHBK) at
4.94% and Vodafone Qatar‟s (VFQS) at 4.87%.
The June quarter earnings season got off to a strong start with the
QNB Group (QNBK) posting solid results. QNBK reported a net profit of
QR4.7bn in first half 2013 (1H2013), representing an increase of 15.1%
year-on-year (YoY). Earnings per share stood at QR6.8 in 1H2013 as
compared to QR5.9 in 1H2012. Total assets rose 30.4% YoY to QR431bn
in 1H2013, while loans & advances rose 26.3% YoY to QR296bn. Customer
deposits increased by 32.7% to QR326bn. This led to the group‟s loan-to-
deposit ratio to stand at 91%. The ratio of non-performing loans to gross
loans has been maintained at 1.5%. The 1H2013 results include that of
NSGB in Egypt as well, in which the group had acquired a controlling stake
of 97.12% during the first quarter of 2013. Going forward, we expect June
quarter results to act as a catalyst for the market. For detailed analysis
and estimates, investors should refer to our report (QNBFS Second
Quarter 2013 Earnings Preview, published on July 07, 2013).
Trading value during the week decreased by 20.46% to reach
QR773.3 million (mn), as compared to QR972.2mn in the prior week.
The Banks & Financial Services sector led the trading value during the
week, accounting for 32.06% of the total equity trading value.
Trading volume increased by 3.41% to reach 20.2mn shares, as
against 19.5mn shares in the prior week. The number of transactions
fell by 6.88% to reach 11,525 transactions versus 12,377 transactions in the
prior week. The Banks & Financial Services sector led the trading volume,
accounting for 25.34% of the total volume.
Foreign institutions turned bullish for the week with overall net buying
of QR38.0mn (including T-bills) versus net selling QR70.1mn
(including T-bills) in the prior week.
Market Indicators
Week ended
July 11, 2013
Week ended
July 04, 2013
Chg. %
Value Traded (QR mn) 773.3 972.2 (20.5)
Exch. Market Cap. (QR mn) 517,399.3 515,421.9 0.4
Volume (mn) 20.2 19.5 3.4
Number of Transactions 11,525 12,377 (6.9)
Companies Traded 42 41 2.4
Market Breadth 19:17 24:16 –
Market Indices Close WTD% MTD% YTD%
Total Return 13,458.97 0.5 1.6 19.0
All Share Index 2,380.53 0.4 1.3 18.2
Banks/Financial Svcs. 2,275.15 (0.1) 1.7 16.7
Industrials 3,130.94 0.6 1.0 19.2
Transportation 1,675.72 (1.4) 0.5 25.0
Real Estate 1,843.91 1.1 (0.1) 14.4
Insurance 2,225.72 0.6 (0.3) 13.4
Telecoms 1,327.72 4.2 4.3 24.7
Consumer 5,517.37 0.1 0.4 18.1
Al Rayan Islamic Index 2,817.81 0.7 0.6 13.2
Market Indices
Weekly Index Performance
Regional Indices Close WTD% MTD% YTD%
Weekly Exchange
Traded Value ($ mn)
Exchange Mkt.
Cap. ($ mn)
TTM P/E** P/B** Dividend Yield
Qatar (QE)* 9,419.97 0.5 1.6 12.7 253.68 142,077.9 11.8 1.7 4.9
Dubai 2,391.63 5.6 7.6 47.4 443.12 61,098.97 15.4 1.0 3.4
Abu Dhabi 3,705.65 4.0 4.3 40.9 449.42 106,585.4 11.1 1.4 4.7
Saudi Arabia 7,690.38 0.3 2.8 13.3 5,136.12 409,973.1#
16.3 2.0 3.6
Kuwait 7,882.32 (1.0) 1.4 32.8 486.73 108,355.2 22.2 1.3 3.6
Oman 6,490.67 0.8 2.4 12.7 62.53 22,614.0 10.7 1.7 4.2
Bahrain 1,189.82 (0.1) 0.2 11.7 4.81 21,249.7 8.7 0.8 4.1
Source: Bloomberg, country exchanges and Zawya (** Trailing Twelve Months; * Value traded ($ mn) do not include special trades, if any) (
#
Data as of July 10, 2013)
9,363.13
9,282.88
9,309.63
9,332.89
9,419.97
0
3,000,000
6,000,000
9,200
9,325
9,450
7-Jul 8-Jul 9-Jul 10-Jul 11-Jul
Volume QE Index
5.6%
4.0%
0.8% 0.5% 0.3%
(0.1%) (1.0%)(2.0%)
0.0%
2.0%
4.0%
6.0%
Dubai
AbuDhabi
Oman
Qatar
SaudiArabia
Bahrain
Kuwait
2. Page 2 of 5
News
Economic News
Qatar trade balance at QR31.3bn in May – According to the
data released by the Statistics Authority, Qatar posted a trade
balance of QR31.3bn in May, up 0.5% YoY backed by higher
revenue from exports. Total exports in May stood at QR39.6bn
and imports were QR8.3bn. Total exports rose in May despite a
drop in exports of some hydrocarbon commodities. The data
also showed that Japan topped among the export destinations
in May and accounted for 29% of Qatar‟s exports, followed by
South Korea (16%) and India (10%). The data also revealed
that among Qatar‟s major import items in May were motor cars,
other vehicles and aircraft spares. The US was the biggest
exporter to Qatar in May (15%), followed by China (10%) and
the UAE (7%). (Gulf-Times.com)
Market & Corporate News
QNB Group’s 1H2013 net profit rises by 15.1% YoY – The
QNB Group has reported a net profit of QR4.7bn in 1H2013,
representing an increase of 15.1% YoY. Earnings per share
stood at QR6.8 in 1H2013 as compared to QR5.9 in 1H2012.
Total assets rose 30.4% YoY to QR431bn in 1H2013, while
loans & advances rose 26.3% YoY to QR296bn. Customer
deposits increased by 32.7% to QR326bn. This led to the
group‟s loan-to-deposit ratio to stand at 91%. The ratio of non-
performing loans to gross loans has been maintained at 1.5%.
Meanwhile, the group‟s conservative policy on provisioning
continued with the coverage ratio reaching 118% in June 2013.
The total equity rose by 10.3% from June 2012 to reach
QR49bn as on June 30, 2013. The 1H2013 results include that
of NSGB in Egypt as well, in which the group had acquired a
controlling stake of 97.12% during the first quarter of 2013.
(QNB Press Release)
QNB Group’s Indian subsidiary to commence in 3Q2013 –
The QNB Group said its fully-owned subsidiary in India will
commence operations in 3Q2013, as it seeks to expand its
presence and take on competition in leading markets. Further,
the group said that it has received all regulatory approvals to
open a representative office in China as well. (Gulf-Times.com)
QNB Group announces HE Ali Shareef Al-Emadi as its BoD
chairman – The QNB Group announced that HE Minister of
Finance Ali Shareef Al-Emadi has been appointed as the
Chairman of its Board of Directors. (QE)
QNB Group appoints new Acting Group CEO – The QNB
Group‟s Board of Directors has appointed Mr. Ali Ahmed Al
Kuwari as its new Acting CEO for the Group. Mr. Ali Al Kuwari
enjoys over 25 years of extensive experience in all aspects of
Business: Strategic Planning, Sales & Marketing, Finance,
Operations, Credit, Human Resources Development,
Information Systems, Systems Analysis and Design,
Programming, Business & Customer Partnership, and Business
& Product Development. He has held several executive
positions with QNB, where he occupied the post of Executive
General Manager – Chief Business Officer with responsibility
for Corporate, Retail, Assets & Wealth Management, Treasury
and International Divisions. (QNB Press Release)
MSCI seeks to limit potential reverse turnover for Qatar,
UAE – Morgan Stanley Capital International (MSCI) has
intended not to implement any changes in MSCI Qatar, MSCI
UAE indices as part of regular index reviews preceding their
reclassification to emerging markets status. MSCI also intends
to implement only deletions from MSCI Qatar, MSCI UAE
caused by either low foreign room, low liquidity or prolonged
suspension. Moreover, MSCI intends to defer implementation of
corporate events not requiring price adjustment factor such as
placements, block sales, recapitalizations and sizable IPOs,
and to exceptionally freeze potential migrations due to
corporate events until the May 2014 semi-annual index review.
MSCI intends to continue implementing corporate events that
require price adjustment factors such as stock splits and
consolidations, as well as deletions resulting from delistings,
bankruptcies and M&As at the time of the event. (Bloomberg)
MSCI Qatar Index assigns provisional weight on Qatari
firms – MSCI said the QNB Group‟s (QNBK) provisional
closing weight is set at 21.68% in the MSCI Qatar Index.
Further, the provisional closing weight for Industries Qatar
(IQCD) has been set at 18.59%, Masraf Al Rayan‟s (MARK) at
16.48%, Ooredoo‟s (ORDS) at 15.78%, Qatar Electricity &
Water Company‟s (QEWS) at 6.44%, Commercial Bank of
Qatar‟s (CBQK) at 5.68%, Qatar Islamic Bank‟s (QIBK) at
5.53%, Doha Bank‟s (DHBK) at 4.94% and Vodafone Qatar‟s
(VFQS) at 4.87%. The list of Qatari stocks expected to be
included in the index falls right in line with our expectations.
(Bloomberg, QNBFS Research)
QE CEO: MSCI upgrade will attract QR3bn to QE – The
Qatar Exchange‟s (QE) CEO Rashid Bin Ali Al Mansoori said
the recent MSCI upgrade of the Qatar market to an Emerging-
Markets status will attract QR3bn to QE. (Bloomberg)
Ooredoo to spend $15bn on Myanmar phone network –
Ooredoo‟s Business Development & Strategy Director Nicholas
Swierzy said the company is planning to spend $15bn in
Myanmar to expand the nation‟s mobile-phone network. He
added that the company is planning to use local partners for
distribution. This amount is likely to be spent over the 15-year
duration of the license. (Bloomberg)
QTEL changed to ORDS – According to the Qatar Exchange,
effective Wednesday 10 July 2013, Qatar Telecom (QTEL) will
be renamed Ooredoo (ORDS). (QE)
Oxy Qatar signs QR273mn deal with GDI for drilling
services – Occidental Petroleum of Qatar (Oxy Qatar) has
signed a contract worth QR273mn with Gulf Drilling
International (GDI) to provide drilling services through the
continued use of „Al Rayyan‟ rig. This contract is for a two-year
period until March 2015. Oxy Qatar is continuing its use of two
drilling rigs, „Al Rayyan‟ and „Al Wajba‟ for its extensive
development programs in the Idd Al Shargi and Al Rayyan
fields. (Gulf-Times.com)
Qatar plans to spin off QP – According to Reuters, Qatar
plans to spin-off Qatar Petroleum (QP) from the Energy Ministry
to allow it to grow more quickly abroad at a time of rising rivalry
from new producers. Industry sources say Qatar believes that
the spinoff will speed up decision making. (Reuters)
IHGS collects 93% of its paid-up capital – Islamic Holding
Group (IHGS) announced the results of collecting the remaining
25% portion of the company's paid-up capital. The company
has so far collected payment for 3.7mn shares from a total of
4mn shares. (QE)
QE announces Ramadan business hours – The Qatar
Exchange (QE) announced that its official business hours
during the holy month of Ramadan will be from 8.30am to
1.30pm, Sunday through Thursday. However, the trading hours
will remain unchanged, from 9.30am to 1.15pm. The pre-
opening session will begin at 9am and end at 9.30am.
Settlement and DvP service timings will also remain
unchanged. (QE)
3. Page 3 of 5
Qatar Exchange
Top 5 Gainers Top 5 Decliners
Source: Qatar Exchange (QE) Source: Qatar Exchange (QE)
Most Active Shares by Value (QR Million) Most Active Shares by Volume (Million)
Source: Qatar Exchange (QE) Source: Qatar Exchange (QE)
Investor Trading Percentage to Total Value Traded Net Traded Value by Nationality (QR Million)
Source: Qatar Exchange (QE) Source: Qatar Exchange (QE)
4.6%
3.0% 2.8%
2.1% 2.0%
0.0%
2.0%
4.0%
6.0%
Ooredoo Qatari
Investors
Group
Barwa Real
Estate
Dlala Holding Industries
Qatar
-3.8%
-3.4%
-2.8%
-2.0% -1.9%
-4.5%
-3.0%
-1.5%
0.0%
Qatar
Electricity and
Water
Mannai Corp. Qatar & Oman
Investment
Medicare
Group
Milaha
162.3
82.4
65.3
46.0 42.6
0.0
60.0
120.0
180.0
Industries
Qatar
QNB Group Barwa Real
Estate
Masraf Al
Rayan
Qatar Gas
Transport
(Nakilat)
2.5
2.4
2.3 2.2
1.8
0.0
1.0
2.0
3.0
Vodafone Qatar Barwa Real
Estate
Qatar Gas
Transport
(Nakilat)
Salam
International
Investment
United
Development
0%
20%
40%
60%
80%
100%
Buy Sell
37.92% 42.58%
20.43%
19.73%
14.72%
15.68%
26.94% 22.02%
Qatari Individuals Qatari Institutions
Non-Qatari Individuals Non-Qatari Institutions
451
322
482
292
(31)
31
(100) - 100 200 300 400 500 600
Qatari
Non-Qatari
Net Investment Total Sold Total Bought
4. Page 4 of 5
TECHNICAL ANALYSIS OF THE QE INDEX
Source: Bloomberg
After threatening to break down on Monday, the QE Index reversed and posted strong gains on Thursday to close near its intraday high for the week. There
was a positive development in the week, as the index breached the 9,400.0 psychological level and made further headway on the back of relatively large
volumes, signifying strength. We believe the index may trend higher and move upward to its next resistance near the 9,450.0 level. This level may be a
crucial level for traders to watch out for as the past two attempts to breach this level failed. However, if the index is able to breach above the 9,450.0 level, it
could spark additional buying interest and a possible upward move toward 9,500.0. The next upside target if this level is surpassed is 9,600.0. Moreover,
the RSI has given a bullish divergence and has enough room before getting overbought, while the MACD is about to cross the signal line into the positive
territory. On the flip side, if the index penetrates below the 9,400.0 level, it could prompt further weakness and cause the index to test the 9,300.0 level.
DEFINITIONS OF KEY TERMS USED IN TECHNICAL ANALYSIS
RSI (Relative Strength Index) indicator – RSI is a momentum oscillator that measures the speed and change of price movements. The RSI oscillates
between 0 to 100. The index is deemed to be overbought once the RSI approaches the 70 level, indicating that a correction is likely. On the other hand, if
the RSI approaches 30, it is an indication that the index may be getting oversold and therefore likely to bounce back.
MACD (Moving Average Convergence Divergence) indicator – The indicator consists of the MACD line and a signal line. The divergence or the
convergence of the MACD line with the signal line indicates the strength in the momentum during the uptrend or downtrend, as the case may be. When the
MACD crosses the signal line from below and trades above it, it gives a positive indication. The reverse is the situation for a bearish trend.
Candlestick chart – A candlestick chart is a price chart that displays the high, low, open, and close for a security. The „body‟ of the chart is portion between
the open and close price, while the high and low intraday movements form the „shadow‟. The candlestick may represent any time frame. We use a one-day
candlestick chart (every candlestick represents one trading day) in our analysis.
Doji candlestick pattern – A Doji candlestick is formed when a security's open and close are practically equal. The pattern indicates indecisiveness, and
based on preceding price actions and future confirmation, may indicate a bullish or bearish trend reversal.
Shooting Star/Inverted Hammer candlestick patterns – These candlestick patterns have a small real body (open price and close price are near to each
other), and a long upper shadow (large intraday movement on the upside). The Shooting Star is a bearish reversal pattern that forms after a rally. The
Inverted Hammer looks exactly like a Shooting Star, but forms after a downtrend. Inverted Hammers represent a potential bullish trend reversal.
5. Contacts
Ahmed M. Shehada Keith Whitney Saugata Sarkar Sahbi Kasraoui
Head of Trading Head of Sales Head of Research Manager - HNWI
Tel: (+974) 4476 6535 Tel: (+974) 4476 6533 Tel: (+974) 4476 6534 Tel: (+974) 4476 6544
ahmed.shehada@qnbfs.com.qa keith.whitney@qnbfs.com.qa saugata.sarkar@qnbfs.com.qa sahbi.alkasraoui@qnbfs.com.qa
QNB Financial Services SPC
Contact Center: (+974) 4476 6666
PO Box 24025, Doha, Qatar
DISCLAIMER: This publication has been prepared by QNB Financial Services SPC (“QNBFS”) a wholly-owned subsidiary of Qatar National Bank (“QNB”). QNBFS is regulated by the Qatar
Financial Markets Authority and the Qatar Exchange; QNB is regulated by the Qatar Central Bank. This publication expresses the views and opinions of QNBFS at a given time only. It is not an
offer, promotion or recommendation to buy or sell securities or other investments, nor is it intended to constitute legal, tax, accounting, or financial advice. We therefore strongly advise potential
investors to seek independent professional advice before making any investment decision. Although the information in this report has been obtained from sources that QNBFS believes to be
reliable, we have not independently verified such information and it may not be accurate or complete. While this publication has been prepared with the utmost degree of care by our analysts,
QNBFS does not make any representations warranties as to the accuracy and completeness of the information it may contain, and declines any liability in that respect. QNBFS reserves the right
to amend the views and opinions expressed in this publication at any time. It may also express viewpoints or make investment decisions that differ significantly from, or even contradict, the views
and opinions included in this report.
COPYRIGHT: No part of this document may be reproduced without the explicit written permission of QNBFS.
Page 5 of 5
Source: Bloomberg
Company Name
Price
(July 11)
% Change 5-
Day
% Change
Monthly
Market Cap.
QR Million TTM P/E P/B Div. Yield
Qatar National Bank 161.50 (0.62) 2.60 113,006 12.6 2.4 3.7
Qatar Islamic Bank 68.90 0.58 1.17 16,281 14.3 1.5 5.4
Commercial Bank of Qatar 71.40 0.71 2.44 17,668 8.6 1.3 8.4
Doha Bank 48.05 1.59 2.45 12,415 8.2 1.2 8.6
Al Ahli Bank 55.00 (0.36) (3.51) 6,989 13.4 2.2 5.5
Qatar International Islamic Bank 53.70 (0.56) (0.37) 8,129 11.8 1.7 6.5
Masraf Al Rayan 27.75 0.00 0.54 20,813 13.4 2.3 3.6
Al Khaliji Bank 16.77 (0.77) (0.77) 6,037 11.6 1.1 6.0
National Leasing 36.95 (0.40) (0.40) 1,828 8.9 1.4 5.4
Dlala Holding 27.15 2.07 1.50 603 23.5 2.6 N/M
Qatar & Oman Investment 13.32 (2.77) (2.70) 420 21.3 1.4 3.8
Islamic Holding Group 43.40 0.00 0.70 174 27.9 4.2 2.6
Banking and Financial Services 204,361
Zad Holding 60.00 0.00 0.67 785 7.4 0.6 6.7
Qatar German Co. for Medical Devices 16.00 0.57 (0.44) 185 N/A 1.0 N/M
Salam International Investment 13.02 0.15 0.15 1,488 21.9 0.9 5.4
Medicare Group 42.70 (1.95) 0.95 1,202 26.0 1.5 4.2
Qatar Cinema & Film Distribution 55.00 (0.72) 0.00 314 27.5 2.4 3.6
Qatar Fuel 254.80 0.35 0.71 16,554 14.4 3.1 3.9
Qatar Meat and Livestock 63.30 0.16 (0.16) 1,139 15.1 3.9 6.3
Al Meera Consumer Goods 135.00 (0.15) (1.17) 2,700 17.5 2.3 5.9
Consumer Goods and Services 24,367
Qatar Industrial Manufacturing 52.00 1.17 (3.70) 2,059 10.5 1.7 5.8
Qatar National Cement 100.50 0.40 (3.37) 4,935 11.6 2.2 6.0
Industries Qatar 161.40 1.96 2.41 97,647 10.8 3.5 4.8
Qatari Investors Group 27.80 2.96 3.54 3,456 20.2 1.7 2.7
Qatar Electricity and Water 156.00 (3.76) (1.83) 15,600 11.6 3.2 4.7
Mannai Corp. 86.00 (3.37) (2.27) 3,923 8.3 1.8 5.5
Aamal 14.35 0.07 (0.42) 8,610 14.0 1.3 N/M
Gulf International Services 41.85 0.00 1.82 6,222 12.2 2.4 3.6
Industrials 142,452
Qatar Insurance 60.80 1.00 (0.33) 7,809 9.8 1.4 3.3
Doha Insurance 26.00 0.39 1.76 669 11.1 1.4 3.5
Qatar General Insurance & Reinsurance 46.60 0.00 0.00 2,686 14.7 1.0 1.9
Al Khaleej Takaful Insurance 43.90 (0.23) (1.35) 750 10.1 1.3 1.9
Qatar Islamic Insurance 60.90 (0.81) (2.09) 914 15.5 3.8 5.7
Insurance 12,827
United Development 22.00 (1.12) (4.35) 7,419 9.3 0.7 4.5
Barwa Real Estate 27.35 2.82 3.01 10,643 13.0 0.8 5.5
Ezdan Real Estate 17.09 (1.78) (2.29) 45,331 N/M 1.6 0.8
Mazaya Qatar Real Estate Development 11.41 0.53 0.80 1,141 20.9 1.1 5.3
Real Estate 64,534
Qatar Telecom 126.70 4.62 4.88 40,585 12.8 1.6 3.9
Vodafone Qatar 9.14 1.56 0.44 7,727 N/A 1.3 N/M
Telecoms 48,312
Qatar Navigation (Milaha) 71.60 (1.92) (0.56) 8,200 9.1 0.8 5.2
Gulf Warehousing 42.00 0.00 2.07 1,998 22.9 2.7 N/M
Qatar Gas Transport (Nakilat) 18.48 (1.28) 0.98 10,349 13.4 6.0 5.4
Transportation 20,546
Qatar Exchange 517,399