
Recomendados
Recomendados
Más contenido relacionado
La actualidad más candente
La actualidad más candente (18)
Destacado
Destacado (19)
Similar a citigroup April 15, 2005 - First Quarter Press Release
Similar a citigroup April 15, 2005 - First Quarter Press Release (20)
Más de QuarterlyEarningsReports
Más de QuarterlyEarningsReports (20)
Último
Último (20)
citigroup April 15, 2005 - First Quarter Press Release
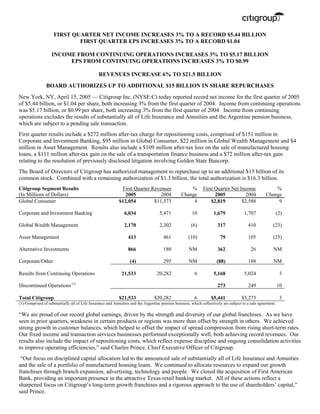
- 1. FIRST QUARTER NET INCOME INCREASES 3% TO A RECORD $5.44 BILLION FIRST QUARTER EPS INCREASES 3% TO A RECORD $1.04 INCOME FROM CONTINUING OPERATIONS INCREASES 3% TO $5.17 BILLION EPS FROM CONTINUING OPERATIONS INCREASES 3% TO $0.99 REVENUES INCREASE 6% TO $21.5 BILLION BOARD AUTHORIZES UP TO ADDITIONAL $15 BILLION IN SHARE REPURCHASES New York, NY, April 15, 2005 — Citigroup Inc. (NYSE:C) today reported record net income for the first quarter of 2005 of $5.44 billion, or $1.04 per share, both increasing 3% from the first quarter of 2004. Income from continuing operations was $5.17 billion, or $0.99 per share, both increasing 3% from the first quarter of 2004. Income from continuing operations excludes the results of substantially all of Life Insurance and Annuities and the Argentine pension business, which are subject to a pending sale transaction. First quarter results include a $272 million after-tax charge for repositioning costs, comprised of $151 million in Corporate and Investment Banking, $95 million in Global Consumer, $22 million in Global Wealth Management and $4 million in Asset Management. Results also include a $109 million after-tax loss on the sale of manufactured housing loans, a $111 million after-tax gain on the sale of a transportation finance business and a $72 million after-tax gain relating to the resolution of previously disclosed litigation involving Golden State Bancorp. The Board of Directors of Citigroup has authorized management to repurchase up to an additional $15 billion of its common stock. Combined with a remaining authorization of $1.3 billion, the total authorization is $16.3 billion. First Quarter Revenues % First Quarter Net Income % Citigroup Segment Results (In Millions of Dollars) 2004 Change 2004 Change 2005 2005 Global Consumer $11,573 4 $2,588 9 $12,054 $2,819 Corporate and Investment Banking 5,471 10 1,707 (2) 6,034 1,679 Global Wealth Management 2,302 (6) 410 (23) 2,170 317 Asset Management 461 (10) 105 (25) 413 79 Alternative Investments 180 NM 26 NM 866 362 Corporate/Other 295 NM 188 NM (4) (88) Results from Continuing Operations 20,282 6 5,024 3 21,533 5,168 Discontinued Operations (1) 249 10 273 $20,282 6 $5,273 3 Total Citigroup $21,533 $5,441 (1) Comprised of substantially all of Life Insurance and Annuities and the Argentine pension business, which collectively are subject to a sale agreement. “We are proud of our record global earnings, driven by the strength and diversity of our global franchises. As we have seen in prior quarters, weakness in certain products or regions was more than offset by strength in others. We achieved strong growth in customer balances, which helped to offset the impact of spread compression from rising short-term rates. Our fixed income and transaction services businesses performed exceptionally well, both achieving record revenues. Our results also include the impact of repositioning costs, which reflect expense discipline and ongoing consolidation activities to improve operating efficiencies,” said Charles Prince, Chief Executive Officer of Citigroup. “Our focus on disciplined capital allocation led to the announced sale of substantially all of Life Insurance and Annuities and the sale of a portfolio of manufactured housing loans. We continued to allocate resources to expand our growth franchises through branch expansion, advertising, technology and people. We closed the acquisition of First American Bank, providing an important presence in the attractive Texas retail banking market. All of these actions reflect a sharpened focus on Citigroup’s long-term growth franchises and a rigorous approach to the use of shareholders’ capital,” said Prince.
- 2. “Citigroup’s businesses continue to generate industry-leading returns and, as a result, substantial capital. Over the past nine months, we have significantly strengthened our capital ratios. Considering our strong capital generation, and with confidence in the strength of our businesses, the Board has authorized management to repurchase up to an additional $15 billion in common shares. The authorization provides management with flexibility to achieve an appropriate balance between growth for our franchises and returning capital to shareholders through dividends and buybacks. We expect to execute up to $15 billion in share repurchases over 18 months,” said Prince. “In addition, in the first quarter we launched our Five Point Plan, which marked the beginning of a very important chapter in Citigroup’s history. The Plan strengthens a foundation of values, priorities and internal controls that are essential for sustained long-term growth. Implementation of the Plan is our top priority,” said Prince. FIRST QUARTER HIGHLIGHTS • Customer volumes. In North America retail banking, average deposits and loans grew 6% and 19%, respectively. Internationally, retail banking deposits and loans increased 17% and 43%, respectively. North America cards receivables increased 3% as sales growth was offset by higher payment rates. In international cards, sales increased 30% and receivables grew 23%. Smith Barney net client flows were the strongest in 12 quarters, at $13 billion, and private bank assets under management outside of Japan increased 13%. In transaction services, assets under custody rose 21% and liability balances increased 25%. • Revenue growth. Revenue growth of 6% reflected record revenues in retail banking, up 15%; fixed income markets, up 16%; and transactions services, up 21%. Growth in these businesses was offset by revenue declines in wealth management, down 6%, due to reduced client transaction volumes and the wind-down of the Japan private bank, and in North America cards, down 5%, due to net interest margin compression and higher payment rates. Lower credit costs in North America cards drove a 7% increase in net credit margin. • Strong international consumer revenue growth. International consumer revenues up 13%, partially driven by performance in Asia, where double-digit growth in consumer balances drove strong revenue gains. • Record revenues in fixed income markets and transaction services. Fixed income markets revenues increased 16% and were driven by increased customer trading activity, strong results in commodities and favorable interest rate positioning. Transaction services revenues grew 21%, including 26% growth in cash management. • Expense growth of 12%. Approximately half of the increase in expenses was driven by repositioning costs and investment spending. The remaining growth was split equally between acquisitions/foreign exchange and organic growth. Expenses were flat versus the fourth quarter of 2004. • Continued favorable credit environment. Global consumer loss rates in the quarter improved to 2.62% on a managed basis, excluding commercial markets, representing an 11 basis point decline from the fourth quarter of 2004. In our corporate businesses, cash basis loans declined 9% from the prior quarter to $1.73 billion. • Investing to expand our core franchises. Investment spending continued in the first quarter and resulted in the addition of 83 new branches, consisting of 69 consumer finance and 14 retail bank branches. The First American Bank acquisition also added 106 branches in Texas. Advertising and marketing expenditures focused on global brand support and new product offerings in consumer and wealth management. • Return on capital. Return on common equity was 20%, while return on risk capital was 40%. • Discontinued Operations. On January 31, 2005, Citigroup announced the sale of substantially all of Life Insurance and Annuities. The sale transaction included the Argentine pension business previously recorded in Asset Management. Financial results for these businesses are presented as discontinued operations. Results of the Mexico life insurance business, which is not included in the sale transaction, are recorded in North America Retail Banking – Mexico. 2
- 3. GLOBAL CONSUMER GROUP First Quarter Revenues % First Quarter Net Income % (In Millions of Dollars) 2005 2004 Change 2005 2004 Change N. America Cards $3,859 (3) $832 9 $3,740 $911 International Cards 739 13 148 18 836 175 Total Cards $4,598 -- $980 11 $4,576 $1,086 N. America Consumer Finance $1,835 1 $444 13 $1,845 $500 International Consumer Finance 853 6 123 5 905 129 Total Consumer Finance $2,688 2 $567 11 $2,750 $629 N. America Retail Banking(1) $2,898 14 $769 22 $3,307 $935 International Retail Banking 1,405 17 366 (4) 1,640 350 Total Retail Banking $4,303 15 $1,135 13 $4,947 $1,285 $(181)(2) Other $(16) NM $(94) (93) $(219) Global Consumer (1) $2,819(3) $11,573 4 $2,588 9 $12,054 (1) Includes revenues and net income from Mexico insurance operations, which were previously recorded in Life Insurance and Annuities. (2) Includes a $109 million after-tax loss on the sale of manufactured housing loans. (3) Includes repositioning costs of $95 million after-tax. • North America Cards – Managed revenues declined 5% from the prior year, as a 6% increase in sales was offset by net interest margin compression, higher payment rates, lower risk-based fees, and increased promotional balances. – Net credit margin increased 7% as favorable credit led to a decline in NCLs of 149 basis points to 5.50%. – Private label receivables declined due to lower sales volumes. • International Cards – Revenue and income growth reflects a 31% increase in accounts and 23% growth in average managed loans. Results include the impact of KorAm, as well as strong organic growth in Australia, Hong Kong, and Brazil. – International consumer credit trends continued to improve as the NCL rate declined 77 basis points to 3.08%. – Net credit margin increased 17%. • North America Consumer Finance – Revenues increased slightly as an 8% increase in average loans was offset by a 46 basis point decline in net interest margin. Spread compression was due to increased risk-based pricing and the repositioning of portfolios toward higher credit quality. – Income growth reflects lower expenses, primarily due to Washington Mutual integration efficiencies, as well as lower credit costs. The net credit loss rate improved 39 basis points to 2.40%. – Investment in branch expansion continued with the opening of 27 new branches in Mexico. • International Consumer Finance – Income growth was primarily driven by continued credit improvements in Japan. Outside of Japan, strong revenue growth was offset by increased investment spending and repositioning costs of $24 million after-tax. – Average loans increased 4%, reflecting a decline in Japan of 8% and growth outside of Japan of 20%. – The NCL ratio improved by 72 basis points to 5.59%. – During the quarter, 42 new branches were added outside of Japan and 11 new automated loan machines were opened in Japan. • North America Retail Banking – Results reflect growth in average customer deposits and loans of 6% and 19%, respectively, reflecting new deposit product offerings and growth in loan originations, and the impact of continuing spread compression. – Income includes a $111 million after-tax gain on the sale of a transportation finance business and a $72 million after- tax gain relating to the resolution of previously disclosed litigation involving Golden State Bancorp. • International Retail Banking – Revenue growth was driven by growth in deposits and loans of 17% and 43%, respectively, and increased investment product sales, reflecting both organic growth and the acquisition of KorAm. – Expenses include repositioning costs of $45 million after-tax, primarily in EMEA, as well as continued investment spending, which led to 15 new branch openings during the quarter. – The NCL ratio, excluding commercial business, improved by 28 basis points to 1.20%. 3
- 4. CORPORATE AND INVESTMENT BANKING First Quarter Revenues % First Quarter Net Income % (In Millions of Dollars) 2005 2004 Change 2005 2004 Change Capital Markets and Banking $4,531 8 $1,477 (3) $4,899 $1,439 Transaction Services 939 21 234 5 1,134 245 Other 1 -- (4) (25) 1 (5) $1,679(1) $ 5,471 10 $ 1,707 (2) Corporate and Investment Banking $ 6,034 (1) Includes repositioning costs of $151 million after-tax. • Capital Markets and Banking – Record fixed income markets revenues, which increased 16%, reflected increased customer activity, favorable interest rate positioning and strong results in commodities. – Equity markets revenues declined 5% as an increase in cash market volumes was offset by weakness in derivative and convertible activity. – Investment banking revenues increased 6%, as strong growth in completed M&A transactions led to a 26% increase in advisory and other fees, which was partially offset by lower equity underwriting market volumes and revenues. – Operating expenses increased 21%, reflecting repositioning costs of $212 million pre-tax, and an increase in other non-compensation expenses. – Net credit recoveries of $46 million reflected the continuing positive credit environment. Cash basis loans decreased to $1.7 billion, a 41% decrease from the prior year period. • Transaction Services – Record revenues were driven by higher customer volumes, reflecting increased liability balances held on behalf of customers, up 25%, and assets under custody, up 21%, and the positive impact of both rising interest rates and acquisitions. – Expenses included $31 million pre-tax of repositioning costs. – Credit costs increased due to the absence of loan loss reserve releases recorded in the prior year period. The credit environment remained favorable. GLOBAL WEALTH MANAGEMENT First Quarter Revenues % First Quarter Net Income % (In Millions of Dollars) 2005 2004 Change 2005 2004 Change Smith Barney $1,729 (4) $251 (22) $1,666 $195 Private Bank 573 (12) 159 (23) 504 122 $317(1) $2,302 (6) $410 (23) Global Wealth Management $2,170 (1) Includes repositioning costs of $22 million after-tax. • Smith Barney – Revenues declined, as a 7% increase in fee-based revenues was more than offset by a 14% decline in transactional revenues due to lower client trading activity. Expenses increased 2% and included a $28 million pre-tax repositioning charge. – Assets under fee-based management increased 9% to $239 billion, and net flows were $13 billion for the quarter. • The Private Bank – Results reflect continued wind-down of the Japan business. Ex-Japan, income declined 2% as a decline in customer trading volumes led to lower transactional revenues. – Client business volumes rose 9%, to $221 billion, led by 19% growth in proprietary managed assets. Ex-Japan, client business volumes rose 13% versus the prior year and were even with the prior quarter. 4
- 5. ASSET MANAGEMENT ALTERNATIVE INVESTMENTS First Quarter Revenues % First Quarter Net Income % (In Millions of Dollars) 2005 2004 Change 2005 2004 Change $79(1) $461 (10) $105 (25) Asset Management $413 $180 NM $26 NM Alternative Investments $866 $ 362 (1) Includes repositioning costs of $4 million after-tax. • Asset Management – Revenues and income declined due to a reduction in customer activity and increased expenses. AUMs declined 3% from the first quarter of 2004, to $460 billion, primarily reflecting the termination of a contract to manage $37 billion of assets for St. Paul Travelers, which was partially offset by positive net flows of $19 billion and increased market valuations. – Net inflows during the quarter were $12 billion. • Alternative Investments (formerly Proprietary Investment Activities) – Income of $362 million primarily reflects positive mark-to-market valuations in private equity portfolios. CORPORATE/OTHER Corporate/Other declined to a loss of $88 million. Results in the first quarter of 2004 included a $180 million after-tax gain on the sale of the electronic funds services business. DISCONTINUED OPERATIONS On January 31, 2005, Citigroup announced the sale of Travelers Life & Annuity, including substantially all international insurance businesses. The sale transaction also includes the Argentine pension business, which was previously recorded in Asset Management. Results for all of the businesses included in the sale transaction are recorded as discontinued operations and are presented below. First Quarter Net Income % (In Millions of Dollars) 2005 2004 Change $249 10 Discontinued Operations $273 5
- 6. INTERNATIONAL OPERATIONS* First Quarter Net Income % (In Millions of Dollars) 2005 2004 Change Consumer……………………………………………………………………... $203 28 $260 Corporate………………………………….…………..……………………… 94 (12) 83 Wealth Management………………………………………………………….. 16 (19) 13 Asset Management……………………………..…………………………….. 26 (35) 17 $339 10 Mexico $373 Consumer……………………………………………………………………... $204 (41) $120 Corporate………………………………….…………..……………………… 264 (29) 188 Wealth Management………………………………………………………….. 9 NM (1) Asset Management……………………………..………………….…………. (1) (100) (2) $ 476 (36) Europe, Middle East and Africa (EMEA) $ 305 Consumer……………………………………………………………………... $ 142 23 $ 175 Corporate………………………………….…………..……………………… 93 (48) 48 Wealth Management………………………………………………………….. 26 NM (8) Asset Management………………………….………..………………………. 2 NM (1) $ 263 (19) Japan $ 214 Consumer……………………………………………………………………... $ 247 26 $ 311 Corporate………………………………….…………..……………………… 308 5 322 Wealth Management………………………………………………………….. 35 -- 35 Asset Management…………………………………...………………………. 2 100 4 $ 592 14 Asia (excluding Japan) $ 672 Consumer……………………………………………………………………... $ 44 9 $ 48 Corporate………………………………….…………..……………………… 202 (28) 145 Wealth Management………………………………………………………….. 10 (30) 7 Asset Management……………………………….…..………………………. 11 -- 11 $ 267 (21) Latin America $ 211 $ 1,937 (8) Total International from Continuing Operations $ 1,775 *International results for the quarter are fully reflected in the product disclosures. • Mexico – Income growth in the consumer business reflects growth in customer deposits and loans, as well as improved spreads in retail banking. – Corporate income declined due to lower sales and trading results, which were only partially offset by revenue and income growth in corporate banking and transaction services. Favorable credit conditions led to lower credit costs. • Europe, Middle East and Africa – Consumer results reflect revenue growth driven by increased customer balances, which was offset by repositioning costs of $66 million after-tax. – Corporate income declined as strong growth in transaction services was offset by repositioning costs of $90 million after-tax. Japan • – Consumer income increased primarily due to lower credit costs in consumer finance. – Corporate income declined as reduced customer transaction volumes and lower volatility led to weaker sales and trading results. – Wealth Management results reflect the continued wind-down of the private bank operations. 6
- 7. Asia • – Consumer income rose strongly, with continued double-digit revenue and income growth across cards, retail banking, and consumer finance reflecting both organic growth and the acquisition of KorAm. During the quarter, branches increased by 35, consisting of 28 consumer finance and 7 retail banking branches. – Corporate income reflects strong growth in transaction services and fixed income markets, which was partially offset by lower income from equity underwriting and trading. • Latin America – Consumer results reflect continued growth in consumer finance and cards receivables and a favorable credit environment. – Corporate income declined as strong growth in transaction services revenues was more than offset by the impact of lower corporate banking results. Citigroup (NYSE: C), the leading global financial services company, has some 200 million customer accounts and does business in more than 100 countries, providing consumers, corporations, governments and institutions with a broad range of financial products and services, including consumer banking and credit, corporate and investment banking, insurance, securities brokerage, and asset management. Major brand names under Citigroup’s trademark red umbrella include Citibank, CitiFinancial, Primerica, Smith Barney, Banamex, and Travelers Life and Annuity. Additional information may be found at www.citigroup.com. A financial summary follows. Additional financial, statistical and business-related information, as well as business and segment trends, is included in a Financial Supplement. Both the earnings release and the Financial Supplement are available on Citigroup’s web site at www.citigroup.com. Certain statements in this document are “forward-looking statements” within the meaning of the Private Securities Litigation Reform Act. These statements are based on management’s current expectations and are subject to uncertainty and changes in circumstances. Actual results may differ materially from those included in these statements due to a variety of factors. More information about these factors is contained in Citigroup’s filings with the Securities and Exchange Commission. Contacts: Press: Leah Johnson (212) 559-9446 Equity Investors: Arthur Tildesley (212) 559-2718 Shannon Bell (212) 793-6206 Fixed Income Investors: John Randel (212) 559-5091 7