
Recomendados
Más contenido relacionado
Destacado
Similar a GM Financial Highlights 2005-2003
Similar a GM Financial Highlights 2005-2003 (20)
Más de QuarterlyEarningsReports3
Más de QuarterlyEarningsReports3 (20)
Último
Último (20)
GM Financial Highlights 2005-2003
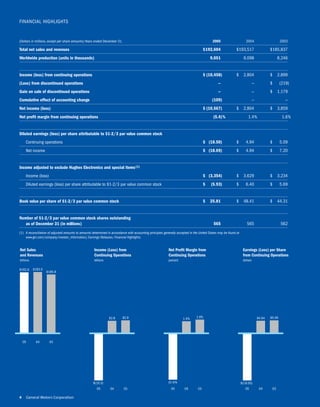
- 1. FINANCIAL HIGHLIGHTS (Dollars in millions, except per share amounts) Years ended December 31, 2005 2004 2003 Total net sales and revenues $192,604 $193,517 $185,837 Worldwide production (units in thousands) 9,051 9,098 8,246 Income (loss) from continuing operations $«(10,458) $÷÷2,804 $÷÷2,899 (Loss) from discontinued operations – – $÷÷÷(219) Gain on sale of discontinued operations – – $÷÷1,179 Cumulative effect of accounting change (109) – – Net income (loss) $«(10,567) $÷÷2,804 $÷÷3,859 Net profit margin from continuing operations (5.4) % 1.4% 1.6% Diluted earnings (loss) per share attributable to $1-2/3 par value common stock Continuing operations $÷«(18.50) $÷÷÷4.94 $÷÷÷5.09 Net income $÷«(18.69) $÷÷÷4.94 $÷÷÷7.20 Income adjusted to exclude Hughes Electronics and special items (1) Income (loss) $÷«(3,354) $÷÷3,629 $÷÷3,234 Diluted earnings (loss) per share attributable to $1-2/3 par value common stock $÷÷«(5.93) $÷÷÷6.40 $÷÷÷5.69 Book value per share of $1-2/3 par value common stock $÷÷25.81 $÷÷48.41 $÷÷44.31 Number of $1-2/3 par value common stock shares outstanding as of December 31 (in millions) 565 565 562 (1) A reconciliation of adjusted amounts to amounts determined in accordance with accounting principles generally accepted in the United States may be found at www.gm.com/company/investor_information/, Earnings Releases, Financial Highlights. Net Sales Income (Loss) from Net Profit Margin from Earnings (Loss) per Share and Revenues Continuing Operations Continuing Operations from Continuing Operations billions billions percent dollars $192.6 $193.5 $185.8 $2.8 $2.9 1.4% 1.6% $4.94 $5.09 05 04 03 $(10.5) (5.4)% $(18.50) 05 04 03 05 04 03 05 04 03 4 General Motors Corporation