Nutritional assessment of community
•Descargar como PPT, PDF•
48 recomendaciones•34,134 vistas

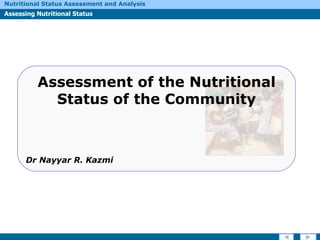
![Introduction Identifying nutritional problems of a population in a clear and measurable way will help to: Define needs, opportunities and constraints, and prioritize solutions. Evaluate programme impact and improve efficiency. Influence decision making in strategic planning, policy formulation and resource allocation. ,[object Object]](data:image/gif;base64,R0lGODlhAQABAIAAAAAAAP///yH5BAEAAAAALAAAAAABAAEAAAIBRAA7)
Recomendados
Más contenido relacionado
La actualidad más candente
La actualidad más candente (20)
Destacado
Destacado (10)
Similar a Nutritional assessment of community
Similar a Nutritional assessment of community (20)
Más de Nayyar Kazmi
Más de Nayyar Kazmi (20)
Último
Último (20)
Nutritional assessment of community
- 1. Assessment of the Nutritional Status of the Community Dr Nayyar R. Kazmi
- 3. To define the nutritional problem of the targeted population, it is necessary to measure its nutritional status. Introduction Nutritional status assessments enable to determine whether the individual is well-nourished or undernourished. ASSESSMENT of the nutritional situation in target population Source: UNICEF, Triple-A Cycle ACTION based on the analysis & available resources ANALYSIS of the causes of the problem
- 5. Assessing Nutritional Status Nutritional status can be assessed through: Body ( anthropometric ) measurements, used to measure growth in children and body weight changes in adults. Clinical examination and biochemical testing , used to diagnose deficiencies of micronutrients (e.g. iodine, vitamin A and iron).
- 10. School Census Data Repeated Surveys Growth Monitoring Four main data collection methodologies that provide anthropometric information are : Sentinel Site Surveillance Anthropometry Multiple Indicator Cluster Survey (MICS) Demographic and Health Surveys (DHS) Two major sources of anthropometric information are:
- 12. GROWTH MONITORING It can be performed at the individual level, or at a group level. It c an also be: Anthropometry On page 7 and 8 of the Learner Notes you may find a table describing the features of growth monitoring, and two relevant case studies. Growth monitoring is the continuous monitoring of growth in children. clinic-based growth monitoring (conducted by health professionals at Maternal and Child Health clinics), or community -based growth monitoring (conducted by trained members of the community in villages )
- 14. The objective is to identify high-risk children with poor health, malnutrition and low socio-economic status. SCHOOL CENSUS DATA Anthropometry On page 10 of the Learner Notes you may find a table describing the features of school census data. School census data relates to nutritional assessment occasionally undertaken in schools .
- 16. Which type of information source should be used? Selecting Nutrition Information Sources In case of multiple objectives, prioritising them will help decide which kind of system is most appropriate. Primary objectives should largely determine the source. Example: If the primary objective is to support households in prevention and treatment of malnutrition, then the appropriate source may be growth monitoring.
- 18. Other key factors to consider are: Response capacity at different levels (household, community, district, national and international). Environmental factors , such as security, geographical terrain and infrastructure. Seasonality of malnutrition in most developing countries. Emergency versus non-emergency contexts. Organizational mandate and implementation capacity. Selecting Nutrition Information Sources
- 20. The conceptual framework developed by FAO’s Food Insecurity and Vulnerability Information and Mapping Systems (FIVIMS): Analysing Underlying Causes
- 21. This means to understand the specific causes of malnutrition in a particular livelihood. Analysing Underlying Causes Participatory appraisal of nutrition will allow an analysis to be carried out from a livelihoods perspective .
- 23. In carrying out the participatory appraisal, the following points deserve particular attention: Analysing Underlying Causes A) Traditional food habits and production systems (and also health and care practices) B) Desired food patterns , or what people prefer to eat and why. C) The ways households cope with seasonal or unexpected food and nutrition problems
- 25. An impact diagram, or a problem tree can be used as a visual summary of the information. It can point out the origins of problems, and show the causes of malnutrition. Analysing Underlying Causes To help explain and make associations with quantitative findings (levels of malnutrition) you can use Qualitative findings.
- 28. Relying simply on measurements of nutritional status can be misleading, and may lead to inappropriate responses. From Analysis to Action It is important to carry out an integrated analysis that combines nutrition data with other kinds of information.
Notas del editor
- Notes for trainers: Nutritional status assessments measure anthropometric, biochemical or physiological characteristics. The findings of these measurements, combined with the analysis of underlying causes , will provide the understanding needed to select the appropriate intervention. This is illustrated by the Triple-A Cycle diagram on the slide.
- Notes for trainers: In fact, n utritional status assessments of individuals make use of measurable criteria. These criteria reflect physical, physiological and biochemical changes as a result of inadequate food intake (quality and quantity) and diseases.
- Notes for trainers: Demographic and Health Surveys (DHS) DHS surveys are nationally-representative household surveys with large sample sizes, usually between 5,000 and 30,000 households, funded by USAID with contributions from other donors. DHS surveys provide data for a wide range of monitoring and impact evaluation indicators in the areas of population, health, and nutrition of women and children in developing countries. The basic approach used in the DHS surveys is to collect and make available data that are comparable across countries. The main objective of DHS surveys is to provide policy-makers and program managers with detailed information on fertility and family planning, childhood mortality, maternal and child health, nutritional status of children and mothers, and awareness of HIV/AIDS. Multiple Indicator Cluster Survey (MICS) MICS are household surveys conducted by UNICEF to support countries in collecting relevant data on child survival and health, child nutrition, maternal health, water and sanitation, immunization, education, child protection and HIV/AIDS. UNICEF developed the Multiple Indicator Cluster Survey (MICS) methodology in the mid-1990s, in response to the need for filling data gaps for indicators used to track progress toward the World Summit for Children goals. The MICS surveys were designed to generate data in a timely and affordable manner. MICS surveys are a major source of data for MDG monitoring, as well as the assessment of progress toward other international goals.
- Notes for trainers: Repeated surveys use standard methodologies to collect quantitative and qualitative data. Their purpose is to support policy makers and managers to design and prioritize geographical areas and types of interventions. They include: National surveys, which are periodically conducted at national level, and Small-scale surveys, which are carried out at local level to gather nutrition information within the shortest time possible.
- Notes for trainers: The growth is usually measured as weight-for-age, once per month. It can be done at the individual level and at group level: at the individual level, the objective is to identify the slowing of growth or of growth faltering in order to correct it quickly through, for example, a health intervention, and at a group level to monitor the general nutritional status in order to mobilize local resources to support nutrition-related activities. Clinic-based growth monitoring is conducted by health professionals at Maternal and Child Health clinics. Community -based growth monitoring is conducted by trained members of the community in villages.
- Notes for trainers: Trends are monitored for various indicators including nutritional status, morbidity, dietary issues, coping strategies and food security. centrally-based sentinel site surveillance : Data can be collated and analysed centrally community-based sentinel site surveillance : Data can be collated and analysed by trained members of the community
- Notes for trainers: first-grade children are measured through censuses that are carried out every two to three years. Results can be used to target school feeding programmes and to support policy making in food-based strategies.
- Notes for trainers: In-depth information: Food consumption surveys : The sources described above measure nutritional outcome, as a result of inadequate intake or poor absorption and utilization of ingested food. Information on food intake may help to better understand the causes of malnutrition and can also be used as a proxy for nutritional outcome. Food intake or consumption surveys assess, as accurately as possible, the types and amounts of food eaten. This can be represented in terms of daily energy and nutrient intake per person. The approach may involve weighing amounts of food eaten or using dietary recall. Difficulties : Weighed intake assessments are very labour-intensive, time consuming and costly. Dietary recall assessments are less invasive but more dependent on memory. The analysis of food intake surveys requireshigh level of skills and the use of specific software, as well as availability of a food composition table. Advantages : The value of food intake surveys is that they can provide invaluable information on quantities, diet quality and on whether energy and nutrient intake are being met. Generally, this type of assessment is undertaken in stable contexts where more information is needed about dietary causes of malnutrition. DIETARY DIVERSITY SCORES Individual dietary diversity (DD) scores is a proxy of nutritional quality of the diet. The DD scores consists of a simple count of the number of food groups consumed by an individual or a household over a given period of time. The assumption is that the higher the score, the better the quality of the diet. Assessinng DD is useful to evaluate the impact of a wide range of programmes on dietary quality. Some examples are livelihoods and crop diversification, nutrition education, school and homestead gardens. These assessments may be carried out in stable situations where there is a known problem of lack of dietary diversity and where efforts to improve agricultural diversification in order to improve diet have been ongoing for many years. The DD assessment can also be used in emergency contexts, where shock can adversely impact the quality of the diet. FOOD BASKET MONITORING (FBM) Food basket monitoring is usually carried out at food distribution sites or at household level in camp situations, e.g. among refugees, in order to ensure that food distribution systems are operating effectively and to help identify any risk of nutrition problems, especially micronutrient deficiency diseases. Where camp populations are dependent on long-term food aid, FBM is critical, especially where the ration diversity is limited and where there is an absence of micronutrient rich foods in the ration, e.g. fortified Corn Soy Blend. Computer programmes to calculate micronutrient content of food rations are available and can be applied to FBM data to help determine whether there is a risk of micronutrient disease and therefore whether to alert authorities to the possibility of outbreaks.
- Notes for trainers: Another example: If the primary objective is to guide decisions on resource targeting at national level, then the appropriate source may be repeated surveys. In case of multiple objectives, prioritising them will help decide which kind of system is most appropriate.
- Notes for trainers: A view on the need to sustain a system over a period of time is also critical. Sentinel site assessment is particularly good for contexts where there will be a need to have a longer-term system in place. Clinic- and community-based growth monitoring programmes frequently lack sufficient resources for data collection and analysis.
- Notes for trainers: 1. Response capacity at different levels (household, community, district, national and international). Response capacity relates to human, physical, financial and social resources, which enables food security and nutrition interventions at various levels ranging from the community to central government level. For example, if there is little response capacity at community level, then there may be little point in implementing community-based growth monitoring or sentinel site surveillance. Response to information is very dependent on credibility of information, which can be enhanced by involving decision makers in the methodology and analysis and also by establishing an inter-agency dialogue for both developing the method and undertaking the analysis. 2. Environmental factors , such as security, geographical terrain and infrastructure. Security, geographical terrain and infrastructure may be key determinants in selecting a method. Insecurity may prevent representative sampling so that surveys are not feasible while poor infrastructure and difficult terrain may constrain regular information collection and flows in community-based systems of data collection. 3. Seasonality of malnutrition in most developing countries. Most developing countries have seasonal patterns of malnutrition. If repeated surveys are to be implemented. it is essential that they be conducted at the same time of the year. Where this is not possible, i.e. in emergencies where the cycle of the intervention will be no more than a year (until the next harvest), there must be awareness of seasonal patterns so that any decline or improvement in the situation can be understood in terms of seasonality. Growth monitoring data are particularly good at demonstrating seasonal patterns. 4. Emergency versus non-emergency contexts. In emergencies, the requirement is to obtain data rapidly and for the data to be credible and to represent the entire affected population. Nutritional cluster surveys are therefore often the preferred method. However, in some situations it is impossible to spend sufficient time on the ground. In these situations, compromise sampling may need to be executed, e.g. gathering all children at a site to be measured. This approach does not give a statistically rigorous prevalence of malnutrition but it will give a sense of whether there are enough children to justify establishing therapeutic feeding centres or a community-based nutrition programme. Sentinel site monitoring is particularly good for early warning purposes and can pick up trends quickly. Triggers can then be invoked for conducting nutritional surveys that determine more accurate levels of malnutrition. 5. Organizational mandate and implementation capacity. The mandate and implementation capacity of an agency will have an influence on the most appropriate form of nutrition assessment. For example, if an agency specializes in selective feeding programmes, e.g. therapeutic and supplementary feeding, then it is essential to know the prevalence of malnutrition as this will indicate whether this type of programme is justified. If, on the other hand, the mandate and implementation capacity of the agency dictate more of a community-based approach to programming, then community-based sentinel site or growth monitoring may be more appropriate.
- Notes for trainers: Among the questions you want to answer: Why dietary intake is inadequate? Why certain diseases are common? Additional information about access to food, health and care practices is needed. For example, looking into care issues may require quantitative data such as rates of exclusive breastfeeding in infants, as well as qualitative information, such as support networks for mothers.
- Notes for trainers: The conceptual framework developed by FAO’s Food Insecurity and Vulnerability Information and Mapping Systems (FIVIMS) corresponds closely to the UNICEF framework. In any nutrition problem analysis or assessment, it is necessary to understand the relative roles of food , health and care factors in the causes of malnutrition. The framework shows that causes of malnutrition are multi-sectoral, embracing food health and caring practices. The causes can be classified as immediate (food consumption, food utilization and health status), underlying (care practices and sanitation, availability, access and stability) and basic (socio-economic environment), whereby factors at one level influence other levels . It is also important to realize that these three causes are not completely independent, but interact in important ways.
- Notes for trainers: In-depth information: Adopting a Livelihoods-oriented approach. Why a Livelihoods-based Approach Nutrition is both an outcome and a determinant of people’s livelihoods. Livelihood refers to people, their capabilities, their assets and activities required for a means of living (including ways to obtain food). Adopting a livelihoods-based approach allows a focus on the way people live, why they live that way, and why and how this way of life changes. A livelihood group refers to a group of people with similar income and food sources and who share similar risks and vulnerabilities to food insecurity and malnutrition. Disaggregating nutrition information by livelihood groups is seen as increasingly useful in the nutrition appraisal and planning process. This is because livelihood approaches have the potential to generate more sensitive and appropriate interventions than is possible with generic policies and programmes that, when based on simple age and sex disaggregated information, are not tailored to local circumstances. Disaggregating nutrition information by livelihood group is essential to: understand the severity, causality and impact of malnutrition; and identify likely entry points for interventions – both short and long term – and their likely impact on people’s lives. Advantages of Adopting a Livelihoods-based Approach The advantages of a dopting a livelihoods-based approach directly stem from the livelihoods fundamental principles on which all livelihoods programming are based, namely: it is people-centred, multi-level, dynamic, and ultimately aims to achieve sustainable livelihoods. A livelihoods-based approach can help to: • gain insight into the factors contributing to poverty by identifying groups of poor people and analysing their livelihoods; • ensure that important livelihood components and constraints are not overlooked; • emphasize issues of vulnerability and the dimensions of sustainability that national macroeconomic plans often fail to integrate adequately; • design effective participatory consultation processes; • highlight where and how government may intervene; and • improve the linkages between micro-level realities and macro-level policies by analysing the impact of macroeconomic policies on the livelihoods of the poor, and by identifying those that discriminate against the poor. Challenges in Adopting a Livelihoods-oriented Approach The feasibility of using a sustainable livelihoods framework in conjunction with nutritional assessment will be determined by a number of factors: Collecting livelihood information or adopting a livelihoods-oriented approach will require spending time with respondents to allow in-depth questioning. This would favour sentinel site surveillance (centrally administered) rather than repeated surveys or growth monitoring programmes. Increasing information demands will increase cost. In-depth information: Adopting a Livelihoods-oriented approach-Cont. Individuals who are able to collect nutritional information, e.g. nurses/health staff at health centres or community-based staff in nutrition surveys, may not be skilled in collecting more analytical information using participatory methods. At the very least substantial training will be required. Carrying out the nutritional assessment on samples that represent specific livelihood or food economy groups allows to integrate the two types of information into an analytical framework.
- Notes for trainers: Concerning traditional food habits and production systems (and also health and care practices): It is important to notice also how they change over time, why they change and whether these changes have resulted in improved nutrition. Concerning the ways households cope with seasonal or unexpected food and nutrition problems : Marginalized households and individuals need special attention. Within a community, the poorest households are likely to have the most serious nutritional problems and the fewest resources.
- Notes for trainers: Several tools and techniques are used such as: resource maps, wealth ranking, institutional Venn diagrams, seasonal calendars, time charts/daily activities, focus group discussions and key informant interviews. Please, remember that a FIELD METHODS TOOL BOX based on FAO methodological guide is available for download. This PDF document provides, for each one of the listed participatory techniques: description, objectives, use, key questions, facilitation guidelines, time and materials needed.
- Notes for trainers: The image shows a "Problem Tree" identifying causes of malnutrition (in selected communities of Kakamega District, Kenya). Problem tree analysis helps identify population/livelihood groups and/or households at risk for each of the nutrition problems identified. Problem trees are commonly converted into solution trees as a basis for objective oriented planning.
- Notes for trainers: Participatory appraisal findings are largely qualitative and descriptive. They can be structured into village profiles and also aggregated in district or regional profiles . A SWOT analysis can provide a good basis for discussions and subsequent planning of interventions. Please, note that there are two examples of village and disctrict profile available for download.
- Notes for trainers: It is important to point out that: it is critical to carry out an integrated analysis that combines nutrition data with other kinds of information. If the malnutrition rates had been interpreted in the absence of morbidity data, the high rate of GAM may have been attributed mainly to food deficit, as there had been a harvest shortfall; the role of the measles epidemic as a major contributing factor may have been overlooked.
- Notes for trainers: In more stable situations there is greater need to analyse basic causes operating at societal level in order to better design interventions.
- Notes for trainers: More information on NCPs and NICS: 1. NCPs: The Nutrition Country Profiles are an example of an integrated multi-sectoral analysis. They are produced by national experts in collaboration with FAO nutritionists. (http://www.fao.org/ag/agn/nutrition/profiles_en.stm). NCPs provide a thorough analysis of the food and nutrition situation in countries, background statistics on food-related factors such as agricultural production, as well as selected health, demographic, education and economic indicators. The outline of the NCPs follows the FIVIMS conceptual framework, including indicators of immediate, underlying and basic causes of malnutrition. The data and indicators used in NCPs come from international sources (United Nations agencies' global data banks) and national sources (Ministry of Health, Ministry of Agriculture and other national institutions). NCP sections usually include: Population (population indicators, population pyramid) Agriculture (land use and irrigation statistics, main crops, agricultural calendar, seasonal food shortage, livestock production and fishery) Economy Social indicators (health indicators, water and sanitation, access to health services, education, level of development, poverty and other social indicators Food and nutrition situation Qualitative aspects of the diet and food (food consumption patterns, food security situation) National food supply data (supply of major food groups, dietary energy supply, distribution by macronutrient and diversity of the food supply, vegetable/animal origin of macronutrients, dietary energy supply by food group, food imports and exports expressed as percentage of DES, food aid) Food consumption (national level surveys) Infant and young child feeding practices Nutritional anthropometry (low birth weight, anthropometry of preschool children, anthropometry of school-age children and adolescents, anthropometry of adult women, anthropometry of adult men) Micronutrient deficiencies (iodine deficiency disorders-IDD, prevalence of goitre and urinary iodine level, iodization of salt at household level, vitamin A deficiency-VAD, prevalence of sub-clinical and clinical vitamin A deficiency, vitamin A supplementation, iron deficiency anemia-IDA, prevalence of IDA, interventions to combat IDA and other micronutrient deficiencies) Policies and programmes aiming to improve nutrition and food security 2. NICS: The NICS classification defines five levels of nutritional risk relating to risk and/or prevalence of malnutrition. The prevalence/risk is indirectly affected by both the underlying causes of malnutrition, relating to food, health and care, and the constraints limiting humanitarian response. The categories are summations of the causes of malnutrition and the humanitarian response. Populations in category I are critical and either have a very high risk of malnutrition or surveys have reported a high prevalence of malnutrition and/or elevated mortality rates. Populations in category II are currently at high risk of becoming malnourished or have a high prevalence of malnutrition. Populations in category III are at moderate risk of malnutrition or have a moderately high prevalence of malnutrition; there may be pockets of high malnutrition in a given area. Populations in category IV are not at an elevated nutritional risk. The risk of malnutrition among populations in category V is not known.
- Notes for trainers: Experiences show us that, where programmes have not been multi-sectoral, there has been little or no impact on population-level nutritional status. Conversely, where interventions have been multi-sectoral, improvements in nutritional status have occurred.
- Notes for trainers: Comment on the example (useful for further discussion): Based on the information on the Ethiopian highland community, an integrated programming would be recommended. Strengthening primary health care or providing nutrition education will have limited impact as isolated interventions. Integrated programming would combine agricultural and income-generating activities with water, health and nutrition education interventions. In order to have a marked impact on nutritional status, the immediate, underlying and basic causes of malnutrition must be addressed simultaneously. As far as possible these interventions should be located within sustainable institutional structures at community and local government levels.
- Notes for trainers: These case studies demonstrate the value of integrating nutritional analysis with broader sector analysis to define the appropriate interventions. He re is another case study: Darfur in 2005 An assessment was carried out to investigate the effects of the current conflict and humanitarian crisis on the livelihoods of selected communities in Darfur, in order to refine strategic humanitarian interventions. The study focused on labour migration, livestock production and trade, and on communities’ links with central and eastern Sudan and with Libya. Key findings of the assessment were as follows: The most fundamental problem affecting livelihoods was insecurity, which was widespread as a result of continued ceasefire violations on the part of both the Government of Sudan and rebel groups. The conflict has caused a dramatic decline in the sending of remittances, a traditionally stable source of income for Darfurian families. In economic terms, livestock had been the primary target of the current conflict. The non-Arab population of Darfur has lost between 50 and 90 percent of its livestock to the government’s armed forces. Increasing hostility between Arabs and non-Arabs, and control by the Sudan Liberation Movement of some critical areas along the traditional migratory routes, had resulted in the restriction of access to the wet-season grazing reserves in the north for the camel-herding Arabs. Similarly, cattle belonging to the Baggara cattle-herding groups have been confined to the railway line close to Nyala town and to the Nyala-Kaz Zalingi road in the west. The disruption of livestock trade both within Darfur and beyond its borders has signalled a downward spiral of the region’s economy. Important secondary markets such as Mellit have been closed. The main recommendations from the study were that major structural changes needed to be addressed at the international, national and state levels. These changes included the process of land restitution and compensation; livestock restitution, reconciliation and compensation; and the opening up of transport routes to provide safe passage for people, livestock and goods. Ideally, the wider processes of reconciliation should be linked with livelihood support.