
Recomendados
Recomendados
Más contenido relacionado
Destacado
Destacado (20)
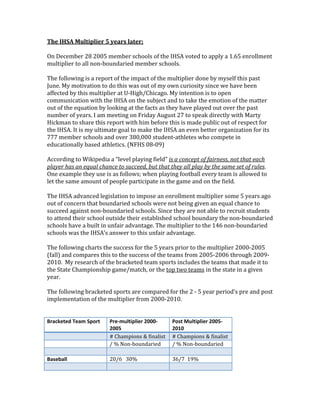
The IHSA Multiplier 5 Years Later
- 2. Boys basketball 19/2 10.5% 32/5 15.6 1 vacated title Girls Basketball 19/5 26.3 % 32/9 28.1 % 1 vacated title Football 1A 10/0 0% 10/0 0% Football 2A 10/1 10% 10/1 10% Football 3A 10/2 20% 10/0 0% Football 4A 10/5 50% 10/7 70% Football 5A 10/7 70% 10/7 70% Football 6A 10/4 40% 10/5 50% Football 7A 8/0 0% 10/2 20% Football 8A 8/0 0% 10/2 20% Boys Soccer 20/8 40% 24/12 50% Girls Soccer 20/6 30% 24/19 79.1 % Girls Softball 20/1 5% 28/1 3.5 % Girls Volleyball 20/10 50% 32/8 25% Average in the Boundaried 74.55 Boundaried 69.32 bracketed team sports Non‐boundaried 25.45 Non‐boundaried 30.68 5.2 % increase in the number of non‐ boundaried teams since the multiplier Non‐Bracketed Team #Champions & # Champions & Sports Finalists / % non‐ finalists / % non‐ boundaried boundaried Boys Cross‐Country 20/1 5% 26/2 7.6%
- 3. Girls Cross‐Country 20/4 20% 24/4 16.6 % Boys Golf 20/10 50% 24/12 50% Girls Golf 10/0 0% 19/7 36.8 % Boys Track and Field 20/4 20% 24/0 0% Girls Track and Field 20/3 15% 24/3 12.5 % Boys Wrestling 20/11 55% 24/6 25% 5 Year averages Boundaried 76.5% Boundaried 78.8 % Non‐Bounded 23.5% Non‐Boundaried 21.2 Decrease in non‐ boundaried 2.3 % The IHSA has expanded the number of classes in 4 sports from 2 classes to 4 classes in baseball, boys and girl’s basketball and volleyball for the past three school years. The sports of boy’s golf, boys and girls cross‐country, boys and girls track and field, boys and girls soccer and wrestling increased from 2 classes to three in the past 3 years. The increase in the number of champions/finalists is due to this increase in the number of offerings within the sports. Also note that girls and boys tennis, girls and boys swimming, girls badminton and boys volleyball have one class of state competition. Summary of the results: Over the past 5 years since the multiplier was instituted there is a 5.2 % average higher percentage of non‐boundaried teams winning championships or being state finalists in the bracketed sports. IF leveling the playing field was defined as “reducing the number/percentage of non‐boundaried teams success on the state level” then the multiplier has failed to accomplish its goal during the first 5 years. The only three bracketed team sports that could argue they meet the goal of reducing the success of non‐boundaried schools would be Baseball, Football 3A and Girls Volleyball. 10 of the 15 bracketed team sports have seen an increase in the success of non‐boundaried schools during this 5‐year period in part due to an increase in the number of opportunities provided by the IHSA. In the non‐bracketed sports there is a decrease in the success by non‐boundaried schools over the same 5‐year period by 2.3 %.
- 4. A look back to the 1990’s For sake of comparison I thought it worthwhile to expand the comparison to include the decade of the 1990’s and examine the trend in comparison to the first decade of the 21st century. Bracketed Sport 1990‐1999 2000‐2010 # state champions and # state champions and finalists/ % non‐ finalists/% non‐ boundaried schools boundaried schools Baseball 40/7 17.5% 56/13 23.2% Boys Basketball 40/11 27.5 % 51/7 13.7% Girls basketball 40/4 10% 51/14 27.4 % Football 1A 20/5 25% 20/0 0% Football 2A 20/0 0% 20/2 10% Football 3A 20/4 20% 20/2 10% Football 4A 20/9 45% 20/12 60% Football 5A 20/11 55% 20/14 70% Football 6A 20/2 10% 20/9 45% Football 7A 0/0 Started 2001 18/2 11% Football 8A 0/0 Started 2001 18/2 11% Boys Soccer 26/4 15.3% 44/20 45.4% Girls Soccer 20/0 0% 44/15 34% Girls Softball 40/4 10% 58/2 3% Girls Volleyball 40/16 40% 52/18 34.6% 15 bracketed sports 366/77 21.0% 512/132 25.7%
- 5. 10 year average 4.6 % increase in non‐ boundaried teams success over the past decade Non‐Bracketed Team 1990‐1999 2000‐2010 Sports # of champions and # champions and finalists / % non‐ finalists / % non‐ boundaried boundaried Boys Cross‐Country 40/4 10% 46/3 6% Girls Cross‐Country 40/2 5% 44/8 18% Boys Golf 40/15 37.5 % 46/24 52.1 % Girls Golf 20/4 20% 29/11 37.9% Boys Track and Field 46/8 17.3% 44/4 9% Girls Track and Field 40/8 20% 44/6 13.6 % Boys Wrestling 42/13 30.9% 44/ 17 38.6 % 7 non‐bracketed sports 268/54 20.1% 297/73 24.5 % 4.4% increase in non‐ boundaried teams success from 1990’s I am quite certain “non‐boundaried schools” did not exist as defined by the IHSA back in the 1990’s. The first language used by the IHSA was “private”. In the decade of 2000 the IHSA language was changed to include all schools without enrollment boundaries or “non‐boundaried schools” including many public schools. 36year history of IHSA Football success The source of this multiplier came to the IHSA via the Football Advisory Committee so I thought it would be interesting to examine the 36‐year history of that sport as a whole. According to IHSA Historian Bob Pruter and Ray Schmidt high school football in Illinois can trace its roots to the late 19th century meaning for nearly 90 years there was not a statewide champions crowned. Many “mythical self proclaimed” football champions but never a statewide “on the field champion.” The
- 6. offering of the state series began in 1974 and coincided with the Chicago Catholic League joining the IHSA for the 75‐76 school year. IHSA Football # of champions and finalists since inception / % no‐ boundaried Football 1A 1974 72/ 5 6.9% Football 2A 1974 72/ 15 20.8% Football 3A 1974 72/ 15 20.8% Football 4A 1974 72/ 31 43% Football 5A 1974 72/ 35 48.6 % Football 6A 1980 60/ 17 28.3 % Football 7A 2001 18/2 11% Football 8A 2001 18/2 11% Summary of football 456/ 122 26.7% 36 year history of IHSA competition Decade of the 90’s 120/31 25.8 % Decade of the 2000 156/43 27.5 % Average of 90/2000 276/ 74 26.65 equals the 36 year average The trend in football success by non‐boundaried schools remains the same over the past 20 years in comparison to all 36 years. The 36 year success rate of football in comparison to the average over all success rate of 15 bracketed sports for the past 20 years is 26.7% in football to 23.8 in all 15 sports 2.9 % higher success rate in football.
- 8. • In my opinion it would be wise for the IHSA to consider opening a Chicago‐ based satellite office. 1 or 2 Compliance Officers would be responsible to visit schools and meet with AD’s and coaches to do a better job of “policing” those schools who do not comply with existing by‐laws. I think schools are not being held accountable for their lack of compliance. Having someone on‐site will help deter some of the problem. Also the AD’s at the CPS Schools need to have a resource close by to help them in regards to all IHSA matters. • I favor an IHSA that has some more teeth behind serious infractions. By doing this it sends a positive message to the majority of the schools that are fully compliant with both the “spirit” and “letter” of the law. • Consider changing the transfer rules especially in boy’s basketball in the Chicagoland area. I would favor a much tighter by‐law for the second transfer at the very least. I would also favor a tighter by‐law for varsity transfers than kids who have never played varsity in any sport. • The AAU coaches need to know that they cannot run the CPS basketball circuit and have kids follow their coach to a specific school. I think AAU coaches need to be registered by the IHSA, identified and held accountable for their actions. The AAU has very little control over their own and this negatively affects basketball in Illinois, I know this is a tall order but something needs to change in regards to the off‐season basketball programs at some schools. Having a compliance officer could help build a better relationship between the IHSA and AAU and stop some of the circus type atmosphere that can exist occasionally. • I feel strongly that having all the schools in the state compete for an IHSA State Championship, I value having all the different types of schools compete is the best approach to interscholastic athletics. Splitting teams into public and private etc…….state championships is not the way to go. • I thank you for reading this document and I look forward to meeting with you tomorrow. David Ribbens Director of Athletics University of Chicago Laboratory Schools