SlideShare una empresa de Scribd logo
1 de 50
Air Pollution:
How do we reduce emissions
So why is air pollution important?
So how do we protect ourselves
from pollution?
 Criteria pollutants
 Hazardous Air Pollutants (HAPs)
 Greenhouse Gases
Ambient criteria pollutant
standards
Pollutant
[final rule cite]
Primary/
Secondary
Averaging Time Level Form
Carbon Monoxide primary
8-hour 9 ppm
Not to be exceeded more than once per
year
1-hour 35 ppm
Lead primary and
secondary
Rolling 3 month average 0.15 μg/m3 (1) Not to be exceeded
Nitrogen Dioxide primary 1-hour 100 ppb 98th percentile, averaged over 3 years
primary and
secondary
Annual 53 ppb (2) Annual Mean
Ozone primary and
secondary
8-hour 0.075 ppm (3) Annual fourth-highest daily maximum 8-hr
concentration, averaged over 3 years
Particulate PM10 primary and
secondary
Annual 15 μg/m3 annual mean, averaged over 3 years
Particulate PM2.5 24-hour 35 μg/m3 98th percentile, averaged over 3 years
24-hour 150 μg/m3 Not to be exceeded more than once per
year on average over 3 years
Sulfur Dioxide primary 1-hour 75 ppb (4)
99th percentile of 1-hour daily maximum
concentrations, averaged over 3 years
secondary 3-hour 0.5 ppm Not to be exceeded more than once per year
Attainment/Nonattainment
State Implementation Plans
Standard Area Attainment Status
PM-2.5 1997
Greensboro-Winston Salem-
High Point, NC
Nonattainment
PM-2.5 1997
Hickory-Morganton-Lenoir,
NC
Nonattainment
8-Hr Ozone
Charlotte-Gastonia-Rock Hill,
NC-SC
Moderate
State Permit Programs
Voluntary programs
AgSTAR Program
Burn Wise
Clean Diesel Campaign
Clean Construction USA
Clean Ports USA
Clean School Bus USA
Diesel Retrofit
Coal Combustion Products Partnership (C2P2)
Coalbed Methane Outreach Program (CMOP)
Combined Heat and Power Partnership
Community-Based Childhood Asthma Programs
Design for the Environment
EnergyStar
Environmental Technology Verification Program
GreenChill
Green Power Partnership
Green Racing Initiative
GreenScapes
Green Suppliers Network
High GWP Partnership Programs
Landfill Methane Outreach Program (LMOP)
Mobile Air Conditioning Partnership
Natural Gas STAR Program
Pesticide Environmental Stewardship Program
SmartWay Transport Partnership
Voluntary Aluminum Industrial Partnership
Regulated HAPs
Hazardous Air Pollutants ( 33/188 Regulated Chemicals)
1. acetaldehyde 18. formaldehyde
2. acrolein 19. hexachlorobenzene
3. acrylonitrile 20. hydrazine
4. arsenic compounds 21. lead compounds
5. benzene 22. manganese compounds
6. beryllium compounds 23. mercury compounds
7. 1, 3-butadiene 24. methylene chloride
8. cadmium compounds 25. nickel compounds
9. carbon tetrachloride 26. perchloroethylene
10. chloroform 27. polychlorinated biphenyls (PCBs)
11. chromium compounds 28. polycyclic organic matter (POM)*
12. coke oven emissions 29. propylene dichloride
13. 1, 3-dichloropropene 30. quinoline
14. diesel particulate matter 31. 1, 1, 2, 2-tetrachloroethane
15. ethylene dibromide 32. trichloroethylene
16. ethylene dichloride 33. vinyl chloride
17. ethylene oxide
Example HAP emission
density
Process- specific regulations
NESHAP (MACT) STANDARD
Aerospace
Acrylic / Modacrylic Fiber (area sources)
Asphalt Processing and
Asphalt Roofing Manufacturing
Auto & Light Duty Truck (surface coating)
Benzene Waste Operations
Boat Manufacturing
Brick and Structural Clay Products Manufacturing
Clay Ceramics Manufacturing
Cellulose Products Manufacturing
Miscellaneous Viscose Processes
Cellulose Food Casing
Rayon
Cellulosic Sponge
Cellophane
Cellulose Ethers Production
Caroxymethyl Cellulose
Methyl Cellulose
Cellulose Ethers
Chromium Electroplating
Chromic Acid Anodizing
Decorative Chromium Electroplating
Hard Chromium Electroplating
Clay Ceramics Manufacturing
Coke Ovens
Combustion Sources at Kraft, Soda, and Sulfite Pulp & Paper Mills
Commercial Sterilizers
Degreasing Organic Cleaners
Dry Cleaning
Commercial dry cleaning dry-to-dry
Commercial dry cleaning transfer machines
Industrial dry cleaning dry-to-dry
Industrial dry cleaning transfer machines
GHGs
So how are we doing?
Reductions over time
So how are we doing
1989 2008
But we still have a long way to
go
2002 National Air Toxics Cancer
Risk Assessment
GHG Trends
What next?
Improvements to
air traffic
Improvements to shipping
More hybrid/electric vehicles
Wind/solar/geothermal
Fuel cell technologies
Hydrogen energy system
Changes in life style to reduce
energy consumption and
emissions
 Smart growth measures
◦ Easier to integrate alternative energy
options
◦ Easier to provide public transportation
◦ Reduced passenger car VMT
◦ Encourage walking and bike riding
◦ Better linkage with community
Example of Smart Growth
changes
Addition of walkways/bike
paths
Better integration of residential
and commercial activities
More integration
Continuing
Continuing
Vegetate buffers
Another example
Again mixing of commercial and
residential activities
More
Better
And better
One more example
Addition of pathways and bike
lanes
Lighting and safety features
Mixing of commercial and
residential
Continuing incrementally
Maturing of beneficial plants
Addition of public
transportation
Summary
 We are able to reduce emissions while
still sustaining growth
 GHG challenges can be addresses
with available technologies to make
US businesses more competitive
 Sustainable cities can be developed
that reduce fuel consumption and
improve quality of life
But what about the rest of the
world?
Population Increasing
Future traffic
Can we develop our green technologies and
sustainable lifestyles quickly enough to save
the world?

Más contenido relacionado

La actualidad más candente (6)

carbon footprint
carbon footprintcarbon footprint
carbon footprint
 
Carbon Footprint
Carbon FootprintCarbon Footprint
Carbon Footprint
 
Introductory Presentation Linked In
Introductory Presentation Linked InIntroductory Presentation Linked In
Introductory Presentation Linked In
 
Air Quality - The National Picture
Air Quality - The National PictureAir Quality - The National Picture
Air Quality - The National Picture
 
Carbon footprint
Carbon footprint Carbon footprint
Carbon footprint
 
Industrial oxygen plants
Industrial oxygen plantsIndustrial oxygen plants
Industrial oxygen plants
 

Destacado

Loadแนวข้อสอบ พนักงานประจำห้องทดลอง โรงพยาบาลขอนแก่น
 Loadแนวข้อสอบ พนักงานประจำห้องทดลอง โรงพยาบาลขอนแก่น Loadแนวข้อสอบ พนักงานประจำห้องทดลอง โรงพยาบาลขอนแก่น
Loadแนวข้อสอบ พนักงานประจำห้องทดลอง โรงพยาบาลขอนแก่น
nawaporn khamseanwong
 
Loadแนวข้อสอบ นักพัฒนาทรัพยากรบุคคล (ปริญญาโท) โรงพยาบาลธรรมศาสตร์เฉลิมพระเกี...
Loadแนวข้อสอบ นักพัฒนาทรัพยากรบุคคล (ปริญญาโท) โรงพยาบาลธรรมศาสตร์เฉลิมพระเกี...Loadแนวข้อสอบ นักพัฒนาทรัพยากรบุคคล (ปริญญาโท) โรงพยาบาลธรรมศาสตร์เฉลิมพระเกี...
Loadแนวข้อสอบ นักพัฒนาทรัพยากรบุคคล (ปริญญาโท) โรงพยาบาลธรรมศาสตร์เฉลิมพระเกี...
nawaporn khamseanwong
 

Destacado (7)

Prezentacyya 8 bereznya (1)
Prezentacyya 8 bereznya (1)Prezentacyya 8 bereznya (1)
Prezentacyya 8 bereznya (1)
 
T3 Swimming Pool Heat Pump Brochure-BLUEWAY
T3 Swimming Pool Heat Pump Brochure-BLUEWAYT3 Swimming Pool Heat Pump Brochure-BLUEWAY
T3 Swimming Pool Heat Pump Brochure-BLUEWAY
 
Дети подготовительных к школе групп № 9,10 посетили библиотеку гбоу школа №185
Дети подготовительных к школе групп № 9,10  посетили библиотеку гбоу школа №185Дети подготовительных к школе групп № 9,10  посетили библиотеку гбоу школа №185
Дети подготовительных к школе групп № 9,10 посетили библиотеку гбоу школа №185
 
Astralpool Wellness Range
Astralpool Wellness RangeAstralpool Wellness Range
Astralpool Wellness Range
 
Loadแนวข้อสอบ พนักงานประจำห้องทดลอง โรงพยาบาลขอนแก่น
 Loadแนวข้อสอบ พนักงานประจำห้องทดลอง โรงพยาบาลขอนแก่น Loadแนวข้อสอบ พนักงานประจำห้องทดลอง โรงพยาบาลขอนแก่น
Loadแนวข้อสอบ พนักงานประจำห้องทดลอง โรงพยาบาลขอนแก่น
 
Loadแนวข้อสอบ นักพัฒนาทรัพยากรบุคคล (ปริญญาโท) โรงพยาบาลธรรมศาสตร์เฉลิมพระเกี...
Loadแนวข้อสอบ นักพัฒนาทรัพยากรบุคคล (ปริญญาโท) โรงพยาบาลธรรมศาสตร์เฉลิมพระเกี...Loadแนวข้อสอบ นักพัฒนาทรัพยากรบุคคล (ปริญญาโท) โรงพยาบาลธรรมศาสตร์เฉลิมพระเกี...
Loadแนวข้อสอบ นักพัฒนาทรัพยากรบุคคล (ปริญญาโท) โรงพยาบาลธรรมศาสตร์เฉลิมพระเกี...
 
知って得する!パブリッククラウドをオンプレミスのように使う裏ワザ
知って得する!パブリッククラウドをオンプレミスのように使う裏ワザ知って得する!パブリッククラウドをオンプレミスのように使う裏ワザ
知って得する!パブリッククラウドをオンプレミスのように使う裏ワザ
 

Similar a Environ Science Presentation

Dipl.-Ing. Thesis Presentation
Dipl.-Ing. Thesis PresentationDipl.-Ing. Thesis Presentation
Dipl.-Ing. Thesis Presentation
Lefteris Andreadis
 
Clean Air Act
Clean Air ActClean Air Act
Clean Air Act
robicuma
 
Air Pollution Presentation
Air  Pollution  PresentationAir  Pollution  Presentation
Air Pollution Presentation
cinsampath
 

Similar a Environ Science Presentation (20)

Dipl.-Ing. Thesis Presentation
Dipl.-Ing. Thesis PresentationDipl.-Ing. Thesis Presentation
Dipl.-Ing. Thesis Presentation
 
Cdm Overview
Cdm OverviewCdm Overview
Cdm Overview
 
Clean Air Act
Clean Air ActClean Air Act
Clean Air Act
 
Aviation industry and environmental impacts
Aviation industry and environmental impactsAviation industry and environmental impacts
Aviation industry and environmental impacts
 
Energy Savings for the London Refrigeration Society
Energy Savings for the London Refrigeration SocietyEnergy Savings for the London Refrigeration Society
Energy Savings for the London Refrigeration Society
 
Power point presentation greens environmental
Power point presentation greens environmentalPower point presentation greens environmental
Power point presentation greens environmental
 
Rosa Cuellar-Franca (University of Manchester) talking about Carbon capture, ...
Rosa Cuellar-Franca (University of Manchester) talking about Carbon capture, ...Rosa Cuellar-Franca (University of Manchester) talking about Carbon capture, ...
Rosa Cuellar-Franca (University of Manchester) talking about Carbon capture, ...
 
Decarbonise Now - Consumption goods.pdf
Decarbonise Now - Consumption goods.pdfDecarbonise Now - Consumption goods.pdf
Decarbonise Now - Consumption goods.pdf
 
The Role of Airports in Addressing Carbon Targets
The Role of Airports in Addressing Carbon TargetsThe Role of Airports in Addressing Carbon Targets
The Role of Airports in Addressing Carbon Targets
 
Air Pollution Presentation
Air  Pollution  PresentationAir  Pollution  Presentation
Air Pollution Presentation
 
Rt 2009
Rt 2009Rt 2009
Rt 2009
 
Capture of CO2
Capture of CO2Capture of CO2
Capture of CO2
 
IRJET- The Impact of Vehicles in Transport and Logistics Services in Gree...
IRJET-  	  The Impact of Vehicles in Transport and Logistics Services in Gree...IRJET-  	  The Impact of Vehicles in Transport and Logistics Services in Gree...
IRJET- The Impact of Vehicles in Transport and Logistics Services in Gree...
 
Unit 3.pptx
Unit 3.pptxUnit 3.pptx
Unit 3.pptx
 
UNDP Bratislava Regional Center goes GREEN
UNDP Bratislava Regional Center goes GREENUNDP Bratislava Regional Center goes GREEN
UNDP Bratislava Regional Center goes GREEN
 
Sustainable development in the Utility Sector
Sustainable development in the Utility SectorSustainable development in the Utility Sector
Sustainable development in the Utility Sector
 
Environmental Managment in Dubai
Environmental Managment in DubaiEnvironmental Managment in Dubai
Environmental Managment in Dubai
 
Harman Ecodesign shorter Knowledge Transfer Partnership (sKTP)
Harman Ecodesign shorter Knowledge Transfer Partnership (sKTP)Harman Ecodesign shorter Knowledge Transfer Partnership (sKTP)
Harman Ecodesign shorter Knowledge Transfer Partnership (sKTP)
 
Green February 2010
Green February 2010Green February 2010
Green February 2010
 
Air pollution and its controll.pdf
Air pollution and its controll.pdfAir pollution and its controll.pdf
Air pollution and its controll.pdf
 

Environ Science Presentation

  • 1. Air Pollution: How do we reduce emissions
  • 2. So why is air pollution important?
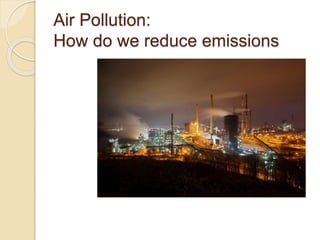
  • 3. So how do we protect ourselves from pollution?  Criteria pollutants  Hazardous Air Pollutants (HAPs)  Greenhouse Gases
  • 4. Ambient criteria pollutant standards Pollutant [final rule cite] Primary/ Secondary Averaging Time Level Form Carbon Monoxide primary 8-hour 9 ppm Not to be exceeded more than once per year 1-hour 35 ppm Lead primary and secondary Rolling 3 month average 0.15 μg/m3 (1) Not to be exceeded Nitrogen Dioxide primary 1-hour 100 ppb 98th percentile, averaged over 3 years primary and secondary Annual 53 ppb (2) Annual Mean Ozone primary and secondary 8-hour 0.075 ppm (3) Annual fourth-highest daily maximum 8-hr concentration, averaged over 3 years Particulate PM10 primary and secondary Annual 15 μg/m3 annual mean, averaged over 3 years Particulate PM2.5 24-hour 35 μg/m3 98th percentile, averaged over 3 years 24-hour 150 μg/m3 Not to be exceeded more than once per year on average over 3 years Sulfur Dioxide primary 1-hour 75 ppb (4) 99th percentile of 1-hour daily maximum concentrations, averaged over 3 years secondary 3-hour 0.5 ppm Not to be exceeded more than once per year
  • 6. State Implementation Plans Standard Area Attainment Status PM-2.5 1997 Greensboro-Winston Salem- High Point, NC Nonattainment PM-2.5 1997 Hickory-Morganton-Lenoir, NC Nonattainment 8-Hr Ozone Charlotte-Gastonia-Rock Hill, NC-SC Moderate
  • 8. Voluntary programs AgSTAR Program Burn Wise Clean Diesel Campaign Clean Construction USA Clean Ports USA Clean School Bus USA Diesel Retrofit Coal Combustion Products Partnership (C2P2) Coalbed Methane Outreach Program (CMOP) Combined Heat and Power Partnership Community-Based Childhood Asthma Programs Design for the Environment EnergyStar Environmental Technology Verification Program GreenChill Green Power Partnership Green Racing Initiative GreenScapes Green Suppliers Network High GWP Partnership Programs Landfill Methane Outreach Program (LMOP) Mobile Air Conditioning Partnership Natural Gas STAR Program Pesticide Environmental Stewardship Program SmartWay Transport Partnership Voluntary Aluminum Industrial Partnership
  • 9. Regulated HAPs Hazardous Air Pollutants ( 33/188 Regulated Chemicals) 1. acetaldehyde 18. formaldehyde 2. acrolein 19. hexachlorobenzene 3. acrylonitrile 20. hydrazine 4. arsenic compounds 21. lead compounds 5. benzene 22. manganese compounds 6. beryllium compounds 23. mercury compounds 7. 1, 3-butadiene 24. methylene chloride 8. cadmium compounds 25. nickel compounds 9. carbon tetrachloride 26. perchloroethylene 10. chloroform 27. polychlorinated biphenyls (PCBs) 11. chromium compounds 28. polycyclic organic matter (POM)* 12. coke oven emissions 29. propylene dichloride 13. 1, 3-dichloropropene 30. quinoline 14. diesel particulate matter 31. 1, 1, 2, 2-tetrachloroethane 15. ethylene dibromide 32. trichloroethylene 16. ethylene dichloride 33. vinyl chloride 17. ethylene oxide
  • 11. Process- specific regulations NESHAP (MACT) STANDARD Aerospace Acrylic / Modacrylic Fiber (area sources) Asphalt Processing and Asphalt Roofing Manufacturing Auto & Light Duty Truck (surface coating) Benzene Waste Operations Boat Manufacturing Brick and Structural Clay Products Manufacturing Clay Ceramics Manufacturing Cellulose Products Manufacturing Miscellaneous Viscose Processes Cellulose Food Casing Rayon Cellulosic Sponge Cellophane Cellulose Ethers Production Caroxymethyl Cellulose Methyl Cellulose Cellulose Ethers Chromium Electroplating Chromic Acid Anodizing Decorative Chromium Electroplating Hard Chromium Electroplating Clay Ceramics Manufacturing Coke Ovens Combustion Sources at Kraft, Soda, and Sulfite Pulp & Paper Mills Commercial Sterilizers Degreasing Organic Cleaners Dry Cleaning Commercial dry cleaning dry-to-dry Commercial dry cleaning transfer machines Industrial dry cleaning dry-to-dry Industrial dry cleaning transfer machines
  • 12. GHGs
  • 13. So how are we doing?
  • 15. So how are we doing 1989 2008
  • 16. But we still have a long way to go
  • 17. 2002 National Air Toxics Cancer Risk Assessment
  • 26. Changes in life style to reduce energy consumption and emissions  Smart growth measures ◦ Easier to integrate alternative energy options ◦ Easier to provide public transportation ◦ Reduced passenger car VMT ◦ Encourage walking and bike riding ◦ Better linkage with community
  • 27. Example of Smart Growth changes
  • 29. Better integration of residential and commercial activities
  • 35. Again mixing of commercial and residential activities
  • 36. More
  • 40. Addition of pathways and bike lanes
  • 42. Mixing of commercial and residential
  • 46. Summary  We are able to reduce emissions while still sustaining growth  GHG challenges can be addresses with available technologies to make US businesses more competitive  Sustainable cities can be developed that reduce fuel consumption and improve quality of life
  • 47. But what about the rest of the world?
  • 50. Can we develop our green technologies and sustainable lifestyles quickly enough to save the world?

Notas del editor

  1. Little history Philosophy/Peace Corps – math/science; Boston air pollution study Engineering degree-Returned to Africa/Europe water and multimedia NC air pollution consulting company (1992) RTP is the U.S. EPA center for air pollution As an air pollution consultant I have traveled to other countries to study solutions they have come up with and problems with which they continue to struggle.  
  2. So why is air pollution important When I first moved to NC , I had an opportunity to work closely with one of the EPA’s branch chiefs John OC One time while waiting for a flight I asked him why he thought air pollution was important water -you consume 2 lts per day but you breath 14,000 lts = 20 queen sized water bed   Also the tissue used in digestive system is designed to block chemicals from entering your system while lung tissue is very different as it facilitates gas transfer so in many ways it is more porous than your digestive track. (picture of a lung)
  3. You have to remember that this was all new territory when Nixon created the EPA in 1970 – there were regulations developed prior to the EPA in fact some of the earliest air pollution rules were developed in 1955, but things didn’t really start to really happen until 1980s. First the EPA identified 6 pollutants that because they were emitted in fairly large amounts had substaintial impacts on public health. Next the EPA looked at compounds that may be emitted in smaller amounts but could have high impacts on health due to their toxicity. And lastly the EPA is starting to look at GHGs which have more of a global impact.
  4. So lets start out wit the 6 criteria pollutants These can have impacts on health or economic impacts such as forest decline or oxidation of building materials. But inorder to study these polluants you need technology to detect their concentrations in the environment and a network to monitor these concentrations. Next you needed to study at what concentrations health and environmental impacts occurred. This would allow you to set an ambient standard
  5. Once you had a ambient testing network in place you could determine where the ambient standards were not being meet. These are called non attainment areas
  6. If you have counties that are classified as nonattainment, you have to develop a state implementation plan (SIP) Develop emission inventory to determine the sources that have the greatest emissions and possibly candidates for control Consider available control technologies that are economically viable These technologies could be very specific such as requiring the use of auto refinishing paints with low emissions or programs that encourge use of bikes to reduce car traffic. Develop targets for facilities or counties to meet over the years to bring the county into compliance This could be implemented through voluntary programs or through state air pollution permits This is interesting approach because it allows states to develop a plan appropriate for their needs Note that the EPA reviews each SIP to ensure that it is reasonable and periodically revisits the state to determine if the plan is working
  7. Stationary sources such as a factory need a air quality permit This could be simple registration for facilities that emit few pollutants State operating permits for facilities that emit more pollutants but nothing that triggers federal requirements Or it can be what is referred to as a Title V permit, which is issued if a facility is considered a major source of pollution. Air pollution permits can have special requirements for facilities that operate in a nonattainment county to help the state reduce emissions and get the county in compliance with criteria pollutant standards
  8. In addition to SIPs, the EPA has a large number of voluntary programs that encourage new technologies. I am sure some of you have seen some of these around such as energy STAR – which shows the actual energy consumption of appliances before you make a purchase My office supports the CMOP and LMOP programs, these programs encourage coal mines and landfill operators to collect methane gas and used it generate electricity which they use in their own operation or sell back to the electric grid. We also support the SmartWay which encourages shippers to use the most efficient methods to move their products to markets. One of my favorites is the green racing initiative, which encourages racing teams to use new automotive technologies and fuels in racing. Periodicially there are races where teams are evaluated not only on how well they did in the race but they are given points for using biofuels, new engine configurations, or control devices.
  9. So everything I have mentioned up to this point is mostly focused on controlling criteria pollutants, but as I mentioned earlier there are air pollutants that are emitted in smaller amounts but can also have significant impact on health. Actually the Clean Air Act Amendment of 1990 identified 188 HAPs HAPs get on the list if they have: Carcinogentic Immune system effects Reproductive effects Respiratory effects This list is constantly tweaked with compounds being removed or speciated to identify the most toxic species.
  10. The EPA collects a lot of data from a variety of sources to assess the impact that HAPs have on public health. As you can see in this mapping of Benzene emissions Benzene is fairly toxic organic compound – 5 sided ring. It is emitted from a variety of sources such as automobiles, refineries, many chemical plants. As you can see these industries are not uniformly spread across the country they are clustered often in communities that have a large portion of their population below the poverty line - these communities tend to have little political clout, but recently state and federal agencies have classifies these areas as environmental justice communities and monitor local health conditions carefully.
  11. Originally the EPA tried to regulate HAPs by looking at one HAP at a time, actually they started out with Benzene found that it was impossible to set a single benzene standard - because it was emitted from so many different sources, the controls were so different. So the EPA took a new approach instead of regulating each pollutant they would look at the industries that were the biggest emitters and develop standards for each industry that were appropriate for each industry. As you can see the EPA has been busy setting and from time to time revising these standards, all together about 250 process specific standards have been developed. In some cases these standards can be use of Low HAP fuels or feed stock or changes in operation to reduce emissions or application of a control device to capture the HAP. Sometimes these approaches co-control emissions, for example a control device that captures VOCs would often control all organic compounds or something that captures PM could control all metals associated with PM emissions.
  12. GHG is the latest set of pollutants the EPA is authorized to control – In hindsight it probably should have been one of the first. Sort of building upon the co-control point I made in the last slide As you can see in this slide most GHG emissions comes from combustion of fuels to produce energy , so if we found ways to burn less energy we would emit less GHGs, but we would also emit less criteria pollutants and HAPs. I probably should point out that Nox is the exception, there are situations (Such as jet engines) where improvements in combustion tends to mean the engines are operating at higher temperatures, air that feeds the engines contrain nitrogen and at high temperatures forms nitrogen oxides., but there are many ways to control Nox – So not really a show stopper. Making things more energy efficient means we spend less on fuel, our industries have higher profits or sell products more cheaply and we are less dependent on foreign oil.
  13. So given the system that we have in place does it work – are emissions going up or down? As you can see in this graph we are doing pretty well emissions are generally going down even though we are producing more, traveling more, have more people and consume more energy. The exception obviously GHGs as they are most closely correlated to energy use.
  14. Lets look at specific pollutants Over the years we have been able to remove a lot of VOCs from products that reduce emissions, The same is true for lead – actually the biggest reduction came when we switched to low lead fuel and even thought the auto and fuel manufactures fought this for years claiming that it would shorten engine life. The opposite happened. Where it was unusual for a car to hit 100,000 miles it is now the minimum many cars can get two or three times that amount. Also fuel switching from high sulfur coal to NG has helped SO2 emissions. CO was reduced through widespread application of catalytic converters. PM2.5 is a new addition to the list and going to be one of the hardest to control, but again it is more directly linked to health problems as they can penetrate more deeply into the lungs and it has recently been linked to climate change – specifically the creation of tornadoes.
  15. This is a good slide as you can see how the EPA’s monitoring network has expanded over the years And also how significantly SO2 emissions have been reduced.
  16. Still 1/3 of people live in a county that is classified as nonattainment – usually urrban counties. Again I want to point out the importance of PM2.5
  17. There are relatively few HAP hotspots again mostly in urban areas or heavily industrialized zones. Not sure what is going on in Alaska.
  18. And as alluded to earlier GHGs are on the increase. But this is our newest challenge and we are in the early phases of emission reduction process. In fact we are sort of at the first step with the GHG reporting rule. Any source that emits more than 25,000 tons of GHG need to report their emissions EPA has developed detailed instruction for 40 industry groups how they should estimate their emissions. Prior to this rule each state developed their own emission inventory which lead to big differences between states – California has a great inventory while Texas has never inventoried their sources. The inventorying of emission sources is necessary to get more detailed information about the sources so appropriate approaches can be developed to control emissions. But it doesn’t take an environmental scientist to realize that many of the best options are going to have a fuel conservation component
  19. I just like this slide as it exemplifies by my European counterparts are perplexed by the US position on GHGs.
  20. 1960 there were 3 billion people - developing world 2 billion 2012 there are 7 billion people (133% growth) - developing world 6 billion. 2050 there will be 9 billion people – developing world 7 billion
  21. Increase demand for the products and lifestyle of the western world
  22. Currently there are 800 million cars operating world wide If we look at China the average commuter in Pejing has a 5 hour commuter every day A couple of summers ago China has a traffic jam that was 100 miles long and took 11 days to clear But what will it be like in 2050 where it is projected that there will be 2-4 billion cars
  23. The big question: can we develop our green technologies and sustainable lifestyles quickly enough to save the world. I think so, but it needs leaders, thinkers and doers at all of levels and in all countries.