SlideShare una empresa de Scribd logo
1 de 6
Descargar para leer sin conexión
Current Hypothesis
- no statistical difference
PV FC MIDW
JAN 2005 49.69 0 46.82
FEB 2005 48.77426 0 48.13
MAR 2005 52.84299 0 51.33
APR 2005 54.7321 0 48.63
MAY 2005 51.42433 0 47.42
JUN 2005 55.62116 0 48.17
JUL 2005 73.9884 0 67.83
AUG 2005 78.85834 0 74.55
SEP 2005 86.27 0 84.96
OCT 2005 92.33 0 85.15
NOV 2005 66.44 0 68.04
DEC 2005 95.28 0 104.85
JAN 2006 61.52792 0 63
FEB 2006 54.53061 0 56.42
MAR 2006 46.90476 0 43.71
APR 2006 52.39229 0 36.82
MAY 2006 52.38075 0 42.46
JUN 2006 59.09957 0 57.2
JUL 2006 91.48587 0 83.27
AUG 2006 65.12907 63.38 61.45
SEP 2006 44.65454 45.31 41.33
OCT 2006 49.62074 49.77 48.83
NOV 2006 54.04011 54.64 53.77
DEC 2006 55.23085 55.86 56.8
JAN 2007 53.53895 55.01 55.43
FEB 2007 58.56741 58.69 61.11
MAR 2007 49.96084 48.92 45.93
APR 2007 57.75829 58.4 51.94
MAY 2007 62.25602 63.64 59.55
JUN 2007 65.45582 70.02 58.93
JUL 2007 88.03434 94.25 75.99
AUG 2007 66.88609 72.57 61.46
SEP 2007 54.7875 57.75 42.84
OCT 2007 60.81668 58.25 45.64
NOV 2007 50.19915 51.53 47.88
DEC 2007 59.85776 62.48 59.71
JAN 2008 52.66597 67.3 59.4
FEB 2008 61.98346 67.35 68.39
MAR 2008 74.61104 76.82 71.79
APR 2008 71.04186 89.34 86.65
MAY 2008 57.43487 83.06 77
JUN 2008 54.49667 99.61 71.51
JUL 2008 69.6367 105.06 96.63
AUG 2008 53.0786 78.19 73.44
SEP 2008 58.98496 56.82 48.41
OCT 2008 46.03902 45.45 41.18
NOV 2008 41.56242 40.28 45.53
DEC 2008 46.00164 45.04 54.1
JAN 2009 49.00709 39.32 52
FEB 2009 46.33944 32.51 47
MAR 2009 41.05925 29.29 39.36
APR 2009 38.03898 27.11 32
MAY 2009 35.01871 34.92 33.89
JUN 2009 29.28895 28.74 27.81
JUL 2009 36.97862 39.76 37
AUG 2009 34.13951 36.6 35.56
SEP 2009 31.22496 33.41 32.95
OCT 2009 34.23255 36.19 39.27
NOV 2009 41.55773 31.96 45.43
DEC 2009 47.99704 50.23 51
JAN 2010 47.51 47.51 52
FEB 2010 46.33944 46.17 47.25
MAR 2010 41.05925 42.77 39.36
APR 2010 35.74 37.18 32
MAY 2010 35.01871 32.47 33.89
JUN 2010 35.67 38.81 37.93
JUL 2010 43.15 47.89 43.91
AUG 2010 40.89 45.77 40.55
SEP 2010 34.91 37.85 37.6
OCT 2010 33.72 31.51 33.32
NOV 2010 33.04 34.29 31.9
DEC 2010 34.57 34.63 37.64
JAN 2011 34.54 33.43 36.53
FEB 2011 35.39 35.86 37.23
MAR 2011 28.13 28.45 31.87
APR 2011 35.14 34.36 32.78
MAY 2011 34.97 35.16 34.63
JUN 2011 38.25 40.28 38
JUL 2011 38.25 38.25 40.09
AUG 2011 42.09 42.77 43.22
SEP 2011 39.94 39.16 35.27
OCT 2011 34.76 32.95 32.92
NOV 2011 32.82 32.69 32.56
DEC 2011 31.42 31.48 36.61
JAN 2012 26.84 29.79 25.565
FEB 2012 26.05 27.41 22.3
MAR 2012 22.78963 17.78 21.78477
APR 2012 21.93 21.13 20.90854
MAY 2012 28.89577 30.03 24.095
JUN 2012 35.85 34.38 24.145
JUL 2012 33.32 35.1 26.745
AUG 2012 43.08 34.77 25.85
SEP 2012 29.93 34.04 23.43
OCT 2012 33.4 32.55 24.585
NOV 2012 29.14 35.02 24.511
DEC 2012 29.86 35.73 29.065
JAN 2013 31.68 33.7 26.56
FEB 2013 31.49 30.85 26.71
MAR 2013 33.38655 33.6875 29.835
APR 2013 37.67 35.42 33.08
MAY 2013 38.59333 37.16667 27.29619
JUN 2013 38.12 37.45 32.86
JUL 2013 48.12 43.29 31.275
AUG 2013 37.95 38.81 28.665
SEP 2013 36.8 40.76 32.595
OCT 2013 34.10967 33.39167 34.66667
NOV 2013 32.65593 33.87963 37.10294
DEC 2013 44.49567 48.34167 46.83333
JAN 2014 40.26032 41.82258 41.73913
FEB 2014 54.43 55.77419 62.63636
MAR 2014 41.81367 38.575 39.28571
APR 2014 39.59484 38.95 42.59259
MAY 2014 42.30613 41.03226 42.5
JUN 2014 45.27586 45.47414 40.07143
JUL 2014 46.19452 48.23387 47.14815
AUG 2014 41.73133 42.125 39.86957
SEP 2014 41.23833 39.35 42.67
OCT 2014 38.62448 39.28448 40.2037
NOV 2014 38.47267 37.725 45.26389
DEC 2014 32.86706 32.23529 40.76923
JAN 2015 26.18133 26.64167 36.77778
FEB 2015 23.69875 23.69042 27.81818
no statistical difference
D Each month PV vs MIDW MIDW vs FC
PV FC MIDW D
0.018429 0.027979 0.96%
0.08342 0.066487 1.69%
0.035749 0.052601 1.69%
0.060436 0.024882 3.56%
0.081612 0.015816 6.58%
0.33022 0.408138 7.79%
0.06582 0.099071 3.33%
0.093987 0.139638 4.57%
0.070245 0.002236 6.80%
0.280407 0.20094 7.95%
0.434076 0.541005 10.69%
0.354241 0.399142 4.49%
0.113726 0.104444 0.93%
0.139845 0.225275 8.54%
0.116993 0.15763 4.06%
0.00022 0.153178 15.30%
0.128269 0.34715 21.89%
0.547996 0.455769 9.22%
0.288097 0.262039 2.61%
0.314369 0.285106 0.327421 1.31% 4.23%
0.111214 0.098433 0.181466 7.03% 8.30%
0.089063 0.09785 0.101167 1.21% 0.33%
0.022034 0.022328 0.056351 3.43% 3.40%
0.030633 0.015217 0.02412 0.65% 0.89%
0.093922 0.066897 0.102472 0.85% 3.56%
0.146952 0.166468 0.248405 10.15% 8.19%
0.156071 0.193786 0.130851 2.52% 6.29%
0.077871 0.089726 0.146515 6.86% 5.68%
0.051397 0.100251 0.010411 4.10% 8.98%
0.344943 0.346044 0.289496 5.54% 5.65%
0.240227 0.230027 0.191209 4.90% 3.88%
0.180883 0.204217 0.302961 12.21% 9.87%
0.110047 0.008658 0.065359 4.47% 5.67%
0.174583 0.115365 0.04908 12.55% 6.63%
0.192406 0.212498 0.247076 5.47% 3.46%
0.120148 0.077145 0.005192 11.50% 7.20%
0.176917 0.000743 0.151347 2.56% 15.06%
0.203725 0.140609 0.049715 15.40% 9.09%
0.047837 0.162978 0.206993 15.92% 4.40%
0.191535 0.070293 0.111368 8.02% 4.11%
0.051157 0.199254 0.071299 2.01% 12.80%
0.277816 0.054713 0.35128 7.35% 29.66%
0.237778 0.255759 0.239988 0.22% 1.58%
0.111276 0.273309 0.340822 22.95% 6.75%
0.219479 0.200106 0.149349 7.01% 5.08%
0.097235 0.113751 0.105634 0.84% 0.81%
0.106808 0.118173 0.188228 8.14% 7.01%
0.065334 0.126998 0.038817 2.65% 8.82%
0.054434 0.173194 0.096154 4.17% 7.70%
0.113946 0.099046 0.162553 4.86% 6.35%
0.073559 0.074428 0.186992 11.34% 11.26%
0.079399 0.288086 0.059063 2.03% 22.90%
0.16362 0.176976 0.179404 1.58% 0.24%
0.262545 0.383438 0.330457 6.79% 5.30%
0.076777 0.079477 0.038919 3.79% 4.06%
0.085372 0.087158 0.073397 1.20% 1.38%
0.09632 0.083209 0.191806 9.55% 10.86%
0.213983 0.116883 0.156863 5.71% 4.00%
0.154948 0.571652 0.122606 3.23% 44.90%
0.010147 0.054151 0.019608 0.95% 3.45%
0.024638 0.028205 0.091346 6.67% 6.31%
0.113946 0.073641 0.166984 5.30% 9.33%
0.129551 0.130699 0.186992 5.74% 5.63%
0.020182 0.126681 0.059063 3.89% 6.76%
0.018598 0.195257 0.119209 10.06% 7.60%
0.2097 0.23396 0.157659 5.20% 7.63%
0.052375 0.044268 0.07652 2.41% 3.23%
0.146246 0.173039 0.07275 7.35% 10.03%
0.034088 0.167503 0.11383 7.97% 5.37%
0.020166 0.088226 0.042617 2.25% 4.56%
0.046308 0.009915 0.179937 13.36% 17.00%
0.000868 0.034652 0.02949 2.86% 0.52%
0.024609 0.072689 0.019162 0.54% 5.35%
0.205143 0.206637 0.14397 6.12% 6.27%
0.2492 0.207733 0.028553 22.06% 17.92%
0.004838 0.023283 0.056437 5.16% 3.32%
0.093795 0.14562 0.097314 0.35% 4.83%
0 0.050397 0.055 5.50% 0.46%
0.100392 0.11817 0.078074 2.23% 4.01%
0.051081 0.084405 0.183943 13.29% 9.95%
0.129695 0.15858 0.066629 6.31% 9.20%
0.055811 0.007891 0.010936 4.49% 0.30%
0.042657 0.037014 0.124386 8.17% 8.74%
0.145767 0.053685 0.301694 15.59% 24.80%
0.029434 0.079893 0.127714 9.83% 4.78%
0.125158 0.351332 0.023105 10.21% 32.82%
0.03772 0.188414 0.040222 0.25% 14.82%
0.317637 0.421202 0.1524 16.52% 26.88%
0.240666 0.144855 0.002075 23.86% 14.28%
0.070572 0.020942 0.107683 3.71% 8.67%
0.292917 0.009402 0.033464 25.95% 2.41%
0.305246 0.020995 0.093617 21.16% 7.26%
0.115937 0.043772 0.049296 6.66% 0.55%
0.127545 0.075883 0.00301 12.45% 7.29%
0.024708 0.020274 0.185794 16.11% 16.55%
0.060951 0.056815 0.086186 2.52% 2.94%
0.005997 0.08457 0.005648 0.03% 7.89%
0.060227 0.091977 0.116997 5.68% 2.50%
0.128299 0.051429 0.108765 1.95% 5.73%
0.024511 0.049313 0.174843 15.03% 12.55%
0.012265 0.007623 0.203831 19.16% 19.62%
0.262329 0.155941 0.048235 21.41% 10.77%
0.211347 0.103488 0.083453 12.79% 2.00%
0.030303 0.050245 0.137101 10.68% 8.69%
0.073107 0.180774 0.063558 0.95% 11.72%
0.04262 0.014613 0.070277 2.77% 5.57%
0.36256 0.426865 0.262254 10.03% 16.46%
0.095186 0.134854 0.108773 1.36% 2.61%
0.351951 0.33359 0.500663 14.87% 16.71%
0.23179 0.308372 0.372797 14.10% 6.44%
0.053065 0.009721 0.084175 3.11% 7.45%
0.068476 0.05346 0.002174 6.63% 5.13%
0.070196 0.108253 0.057143 1.31% 5.11%
0.02029 0.060688 0.176603 15.63% 11.59%
0.096617 0.126651 0.154377 5.78% 2.77%
0.011814 0.065875 0.07024 5.84% 0.44%
0.063384 0.001665 0.057799 0.56% 5.61%
0.003931 0.039697 0.125864 12.19% 8.62%
0.145704 0.145519 0.099299 4.64% 4.62%
0.203417 0.173525 0.097904 10.55% 7.56%
0.094823 0.110776 0.243614 14.88% 13.28%
Both loads are shown to have linear relationships with MIDW which means that there is a direct correlation
Max Min AVG between the how MIDW changes from month to month and how each PV and FC change the same
PV VS MIDW PV VS MIDW PV VS MIDW
25.95% 0.03% 7.35%
FC VS MIDW FC VS MIDW FC VS MIDW There are several months where the difference is almost 50% difference from PV vs MIDW to FC vs MIDW
44.90% 0.24% 8.23% However since the difference average is less than or at 10 % difference then there is a clear and defined correlation
However there will be some of the days that will be out of the range of that average
PV FC MIDW this makes it very risky to try and find the prices using historic data along with the MIDW prices.
Average Average Average
1 Jan 10.9% 8.1% 11.1%
2 Feb 9.7% 10.6% 14.4%
3 MAR 14.9% 18.0% 16.8%
4 APR 11.0% 12.7% 12.6%
5 MAY 8.7% 14.0% 10.2%
6 JUN 9.2% 13.5% 12.1%
7 JUL 22.2% 16.3% 21.9%
8 AUG 17.7% 12.1% 12.9%
9 SEP 13.7% 12.0% 17.8%
10 OCT 10.6% 10.6% 10.4%
11 NOV 9.2% 7.2% 7.4%
12 DEC 12.2% 19.3% 16.3%
PV FC MIDW This Graph is showing the averages of PV FC and MIDW for each month.
Standard Deviation Just by looking at the graph you can see a huge correlation between the graphs
Jan 0.106742061 0.05258199 0.132971 They all seem to follow the same pattern in their up and down trends.
Feb 0.103717604 0.098262823 0.141628 Using just this fact you could use the correlation between PV FC and MIDW
MAY 0.069895609 0.102742018 0.105996 to track huge dips and upturns in the market prices, however due to the fact that these price
JUN 0.072159813 0.073955388 0.065118 changes are different enough in some sections such as april-june september-november you could not use one set of
JUL 0.102250659 0.140358496 0.059437 data to predict the prices in these ranges.
AUG 0.075821899 0.063108232 0.108916
SEP 0.177982967 0.142546236 0.143596
OCT 0.105870234 0.084902749 0.086019
NOV 0.113789231 0.087302308 0.115603
DEC 0.059480304 0.080839854 0.056475
JAN 0.072436806 0.045295125 0.052358
FEB 0.110346312 0.204935255 0.067931
0
0.1
0.2
0.3
0.4
0.5
0.6
0 0.1 0.2 0.3 0.4 0.5 0.6
MIDW VS PV
MIDW VS PV
Linear (MIDW VS PV)
0
0.1
0.2
0.3
0.4
0.5
0.6
0.7
0 0.1 0.2 0.3 0.4
MIDW VS FC
MIDW VS FC
Linear (MIDW VS FC)
0.0%
5.0%
10.0%
15.0%
20.0%
25.0%
0 5 10 15
PV FC and MIDW Averages
PV Average
FC Average
MIDW Average
0
0.05
0.1
0.15
0.2
0.25
0 2 4 6 8 10 12 14
Standard Deviation
PV Stdev
FC stedv
MIDW Stdev
PV FC MIDW PV FC MIDW
Average Average Average Standard Deviation
JAN 43.04014358 43.48532258 45.07472 11.83292 20.50996 12.68514
FEB 44.32667029 44.32677419 45.9086 13.23946 21.95376 15.69478
MAR 43.25579896 39.5365625 41.42555 14.49185 22.91523 13.6224
APR 44.40383591 42.73625 41.74011 14.27255 26.2877 18.17298
MAY 43.82986156 44.68486559 42.27312 11.26427 25.04803 15.93301
JUN 45.71280265 49.34551724 43.66264 12.13688 29.52992 15.05143
JUL 56.91584407 56.47923387 54.98881 21.86124 33.78888 24.10534
AUG 50.38329355 48.950625 48.46146 14.95704 22.23456 17.87523
SEP 45.87402916 42.3925 42.2055 17.03828 15.9418 16.5586
OCT 45.7653145 38.69701868 42.57654 18.70446 15.3801 16.4813
NOV 41.99280078 37.1718287 43.19878 11.73588 14.66366 12.43948
DEC 47.75800088 42.5208701 51.73776 19.59962 17.43209 21.08773

Más contenido relacionado

La actualidad más candente

Tabel Nilai Kritis Distribusi Chi-Square
Tabel Nilai Kritis Distribusi Chi-SquareTabel Nilai Kritis Distribusi Chi-Square
Tabel Nilai Kritis Distribusi Chi-SquareTrisnadi Wijaya
 
106成績人數累計
106成績人數累計106成績人數累計
106成績人數累計中 央社
 
PV, FV, & Annuity tables
PV, FV, & Annuity tablesPV, FV, & Annuity tables
PV, FV, & Annuity tablesDr. Amir Ikram
 
105指考成績人數累計
105指考成績人數累計105指考成績人數累計
105指考成績人數累計中 央社
 
107年指考各科成績累計
107年指考各科成績累計107年指考各科成績累計
107年指考各科成績累計中 央社
 
Tablas de ing_econ._1
Tablas de ing_econ._1Tablas de ing_econ._1
Tablas de ing_econ._1Lilia Estrada
 
109年指考各科成績人數百分比累計表
109年指考各科成績人數百分比累計表109年指考各科成績人數百分比累計表
109年指考各科成績人數百分比累計表中 央社
 
Ee spreadsheet functions and factors
Ee spreadsheet functions and factorsEe spreadsheet functions and factors
Ee spreadsheet functions and factorsjohnjackson319
 
Tabla de comparacion pago de pmg 2020 completa
Tabla de comparacion pago de pmg 2020 completaTabla de comparacion pago de pmg 2020 completa
Tabla de comparacion pago de pmg 2020 completamarcosroa2
 
Matemática financeira 6 tabelas financeiras de alto nível - by prof. shibat...
Matemática financeira   6 tabelas financeiras de alto nível - by prof. shibat...Matemática financeira   6 tabelas financeiras de alto nível - by prof. shibat...
Matemática financeira 6 tabelas financeiras de alto nível - by prof. shibat...prof. Renan Viana
 
Valores para calcular chi cuadrado crítico
Valores para calcular chi cuadrado críticoValores para calcular chi cuadrado crítico
Valores para calcular chi cuadrado críticoLaura Vergaño Payán
 

La actualidad más candente (17)

Tabel Nilai Kritis Distribusi Chi-Square
Tabel Nilai Kritis Distribusi Chi-SquareTabel Nilai Kritis Distribusi Chi-Square
Tabel Nilai Kritis Distribusi Chi-Square
 
106成績人數累計
106成績人數累計106成績人數累計
106成績人數累計
 
PV, FV, & Annuity tables
PV, FV, & Annuity tablesPV, FV, & Annuity tables
PV, FV, & Annuity tables
 
105指考成績人數累計
105指考成績人數累計105指考成績人數累計
105指考成績人數累計
 
Tabel x2
Tabel x2Tabel x2
Tabel x2
 
107年指考各科成績累計
107年指考各科成績累計107年指考各科成績累計
107年指考各科成績累計
 
Tablas de ing_econ._1
Tablas de ing_econ._1Tablas de ing_econ._1
Tablas de ing_econ._1
 
Sanhuu udirdlaga
Sanhuu udirdlagaSanhuu udirdlaga
Sanhuu udirdlaga
 
109年指考各科成績人數百分比累計表
109年指考各科成績人數百分比累計表109年指考各科成績人數百分比累計表
109年指考各科成績人數百分比累計表
 
Ee spreadsheet functions and factors
Ee spreadsheet functions and factorsEe spreadsheet functions and factors
Ee spreadsheet functions and factors
 
Distribucion ji cuadrado
Distribucion ji cuadradoDistribucion ji cuadrado
Distribucion ji cuadrado
 
Appendix a present value tables
Appendix a   present value tablesAppendix a   present value tables
Appendix a present value tables
 
Tabla Chi cuadrado PSPP
Tabla Chi cuadrado PSPPTabla Chi cuadrado PSPP
Tabla Chi cuadrado PSPP
 
Tabla de comparacion pago de pmg 2020 completa
Tabla de comparacion pago de pmg 2020 completaTabla de comparacion pago de pmg 2020 completa
Tabla de comparacion pago de pmg 2020 completa
 
Matemática financeira 6 tabelas financeiras de alto nível - by prof. shibat...
Matemática financeira   6 tabelas financeiras de alto nível - by prof. shibat...Matemática financeira   6 tabelas financeiras de alto nível - by prof. shibat...
Matemática financeira 6 tabelas financeiras de alto nível - by prof. shibat...
 
F.table
F.tableF.table
F.table
 
Valores para calcular chi cuadrado crítico
Valores para calcular chi cuadrado críticoValores para calcular chi cuadrado crítico
Valores para calcular chi cuadrado crítico
 

Destacado

Cisco aironet 3.5 d bi articulated dipole antenna
Cisco aironet 3.5 d bi articulated dipole antennaCisco aironet 3.5 d bi articulated dipole antenna
Cisco aironet 3.5 d bi articulated dipole antennafgonzalez2005
 
W3 c tipos de dominio protocolos de
W3 c tipos de dominio protocolos deW3 c tipos de dominio protocolos de
W3 c tipos de dominio protocolos deKnadeYuu
 
Power Quality Improvement Using GUPFC
Power Quality Improvement Using GUPFCPower Quality Improvement Using GUPFC
Power Quality Improvement Using GUPFCAM Publications
 
Maintenance Managemant-LL
Maintenance Managemant-LLMaintenance Managemant-LL
Maintenance Managemant-LLKyaw Zin Win
 
Zurich machine learning_vicensgaitan
Zurich machine learning_vicensgaitanZurich machine learning_vicensgaitan
Zurich machine learning_vicensgaitanVicens Alcalde
 
Igniting Learner Potential Through Project-Based Learning Modules - Copy
Igniting Learner Potential Through Project-Based Learning Modules - CopyIgniting Learner Potential Through Project-Based Learning Modules - Copy
Igniting Learner Potential Through Project-Based Learning Modules - CopyShafaque Mulla
 
Cuecig.com Tropical Flavored eJuice
Cuecig.com Tropical Flavored eJuice Cuecig.com Tropical Flavored eJuice
Cuecig.com Tropical Flavored eJuice CueCig.com
 
Study of the Effect of Length and Inclination of Tube settler on the Effluent...
Study of the Effect of Length and Inclination of Tube settler on the Effluent...Study of the Effect of Length and Inclination of Tube settler on the Effluent...
Study of the Effect of Length and Inclination of Tube settler on the Effluent...AM Publications
 
Citrix Guida La Virtualizzazione
Citrix Guida La VirtualizzazioneCitrix Guida La Virtualizzazione
Citrix Guida La VirtualizzazioneFilippo Latona
 
ABC Reporter – Central Texas Quarterly Newsletter
ABC Reporter – Central Texas Quarterly NewsletterABC Reporter – Central Texas Quarterly Newsletter
ABC Reporter – Central Texas Quarterly NewsletterAmy Torres
 
Inexpensive ways to boost the value of key biscayne waterfront condos (16)
Inexpensive ways to boost the value of key biscayne waterfront condos (16)Inexpensive ways to boost the value of key biscayne waterfront condos (16)
Inexpensive ways to boost the value of key biscayne waterfront condos (16)Alicia Ale
 
Inexpensive ways to boost the value of key biscayne waterfront condos (5)
Inexpensive ways to boost the value of key biscayne waterfront condos (5)Inexpensive ways to boost the value of key biscayne waterfront condos (5)
Inexpensive ways to boost the value of key biscayne waterfront condos (5)Alicia Ale
 

Destacado (17)

Cisco aironet 3.5 d bi articulated dipole antenna
Cisco aironet 3.5 d bi articulated dipole antennaCisco aironet 3.5 d bi articulated dipole antenna
Cisco aironet 3.5 d bi articulated dipole antenna
 
Amaliapater
AmaliapaterAmaliapater
Amaliapater
 
W3 c tipos de dominio protocolos de
W3 c tipos de dominio protocolos deW3 c tipos de dominio protocolos de
W3 c tipos de dominio protocolos de
 
Power Quality Improvement Using GUPFC
Power Quality Improvement Using GUPFCPower Quality Improvement Using GUPFC
Power Quality Improvement Using GUPFC
 
Wes's resume
Wes's resumeWes's resume
Wes's resume
 
Maintenance Managemant-LL
Maintenance Managemant-LLMaintenance Managemant-LL
Maintenance Managemant-LL
 
Zurich machine learning_vicensgaitan
Zurich machine learning_vicensgaitanZurich machine learning_vicensgaitan
Zurich machine learning_vicensgaitan
 
Igniting Learner Potential Through Project-Based Learning Modules - Copy
Igniting Learner Potential Through Project-Based Learning Modules - CopyIgniting Learner Potential Through Project-Based Learning Modules - Copy
Igniting Learner Potential Through Project-Based Learning Modules - Copy
 
NRF Dryline Proposal.Short.051115
NRF Dryline Proposal.Short.051115NRF Dryline Proposal.Short.051115
NRF Dryline Proposal.Short.051115
 
Cuecig.com Tropical Flavored eJuice
Cuecig.com Tropical Flavored eJuice Cuecig.com Tropical Flavored eJuice
Cuecig.com Tropical Flavored eJuice
 
Certificate Minor IBAC
Certificate Minor IBACCertificate Minor IBAC
Certificate Minor IBAC
 
Study of the Effect of Length and Inclination of Tube settler on the Effluent...
Study of the Effect of Length and Inclination of Tube settler on the Effluent...Study of the Effect of Length and Inclination of Tube settler on the Effluent...
Study of the Effect of Length and Inclination of Tube settler on the Effluent...
 
KhojEZ: Home Repairs Services Provider in Hyderabad
KhojEZ: Home Repairs Services Provider in HyderabadKhojEZ: Home Repairs Services Provider in Hyderabad
KhojEZ: Home Repairs Services Provider in Hyderabad
 
Citrix Guida La Virtualizzazione
Citrix Guida La VirtualizzazioneCitrix Guida La Virtualizzazione
Citrix Guida La Virtualizzazione
 
ABC Reporter – Central Texas Quarterly Newsletter
ABC Reporter – Central Texas Quarterly NewsletterABC Reporter – Central Texas Quarterly Newsletter
ABC Reporter – Central Texas Quarterly Newsletter
 
Inexpensive ways to boost the value of key biscayne waterfront condos (16)
Inexpensive ways to boost the value of key biscayne waterfront condos (16)Inexpensive ways to boost the value of key biscayne waterfront condos (16)
Inexpensive ways to boost the value of key biscayne waterfront condos (16)
 
Inexpensive ways to boost the value of key biscayne waterfront condos (5)
Inexpensive ways to boost the value of key biscayne waterfront condos (5)Inexpensive ways to boost the value of key biscayne waterfront condos (5)
Inexpensive ways to boost the value of key biscayne waterfront condos (5)
 

Similar a CorrelationMIDWPV

富邦投顧研究部核心持股2011年殖利率 02.17.2012
富邦投顧研究部核心持股2011年殖利率 02.17.2012富邦投顧研究部核心持股2011年殖利率 02.17.2012
富邦投顧研究部核心持股2011年殖利率 02.17.2012yo9889
 
Pipe wall thickness and weight
Pipe wall thickness and weightPipe wall thickness and weight
Pipe wall thickness and weightMuralikrishnan C
 
Kedia april commodity seasonality report
Kedia april commodity seasonality reportKedia april commodity seasonality report
Kedia april commodity seasonality reportAjay Kedia
 
Erlang table
Erlang tableErlang table
Erlang tablejesmin256
 
Problem 1 (50 points) All Financial Data should only be obtained from.pdf
Problem 1 (50 points) All Financial Data should only be obtained from.pdfProblem 1 (50 points) All Financial Data should only be obtained from.pdf
Problem 1 (50 points) All Financial Data should only be obtained from.pdfarrowcomputers8700
 
Manufacturing Process Optimization Using Statistical Modeling 2015
Manufacturing Process Optimization Using Statistical Modeling 2015Manufacturing Process Optimization Using Statistical Modeling 2015
Manufacturing Process Optimization Using Statistical Modeling 2015Ronald Ortiz
 
cobb500 broiler performance nutrition supplement 2022
cobb500 broiler performance nutrition supplement 2022 cobb500 broiler performance nutrition supplement 2022
cobb500 broiler performance nutrition supplement 2022 AbdelRahman Yousef
 
Escrutinio Defenitivo Elecciones 2011
Escrutinio Defenitivo Elecciones 2011Escrutinio Defenitivo Elecciones 2011
Escrutinio Defenitivo Elecciones 2011Petroleuse_
 
到都市的權利
到都市的權利到都市的權利
到都市的權利Shuwei Huang
 
BOR COVID-19 8 Agustus 2021
BOR COVID-19 8 Agustus 2021BOR COVID-19 8 Agustus 2021
BOR COVID-19 8 Agustus 2021CIkumparan
 

Similar a CorrelationMIDWPV (20)

Erlang table
Erlang tableErlang table
Erlang table
 
富邦投顧研究部核心持股2011年殖利率 02.17.2012
富邦投顧研究部核心持股2011年殖利率 02.17.2012富邦投顧研究部核心持股2011年殖利率 02.17.2012
富邦投顧研究部核心持股2011年殖利率 02.17.2012
 
Pipe wall thickness and weight
Pipe wall thickness and weightPipe wall thickness and weight
Pipe wall thickness and weight
 
Kedia april commodity seasonality report
Kedia april commodity seasonality reportKedia april commodity seasonality report
Kedia april commodity seasonality report
 
Erlang table
Erlang tableErlang table
Erlang table
 
Erlang table
Erlang tableErlang table
Erlang table
 
Erlang table
Erlang tableErlang table
Erlang table
 
Problem 1 (50 points) All Financial Data should only be obtained from.pdf
Problem 1 (50 points) All Financial Data should only be obtained from.pdfProblem 1 (50 points) All Financial Data should only be obtained from.pdf
Problem 1 (50 points) All Financial Data should only be obtained from.pdf
 
Manufacturing Process Optimization Using Statistical Modeling 2015
Manufacturing Process Optimization Using Statistical Modeling 2015Manufacturing Process Optimization Using Statistical Modeling 2015
Manufacturing Process Optimization Using Statistical Modeling 2015
 
Tabel besi
Tabel besiTabel besi
Tabel besi
 
Anexo 1
Anexo 1Anexo 1
Anexo 1
 
cobb500 broiler performance nutrition supplement 2022
cobb500 broiler performance nutrition supplement 2022 cobb500 broiler performance nutrition supplement 2022
cobb500 broiler performance nutrition supplement 2022
 
Escrutinio Defenitivo Elecciones 2011
Escrutinio Defenitivo Elecciones 2011Escrutinio Defenitivo Elecciones 2011
Escrutinio Defenitivo Elecciones 2011
 
到都市的權利
到都市的權利到都市的權利
到都市的權利
 
Estratificacion(1) dane
Estratificacion(1) daneEstratificacion(1) dane
Estratificacion(1) dane
 
Estratificacion(1) dane
Estratificacion(1) daneEstratificacion(1) dane
Estratificacion(1) dane
 
002 apicasing
002 apicasing002 apicasing
002 apicasing
 
BOR COVID-19 8 Agustus 2021
BOR COVID-19 8 Agustus 2021BOR COVID-19 8 Agustus 2021
BOR COVID-19 8 Agustus 2021
 
Asignatura
AsignaturaAsignatura
Asignatura
 
Asignatura
AsignaturaAsignatura
Asignatura
 

CorrelationMIDWPV

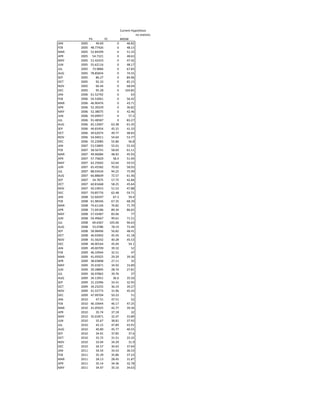
  • 1. Current Hypothesis - no statistical difference PV FC MIDW JAN 2005 49.69 0 46.82 FEB 2005 48.77426 0 48.13 MAR 2005 52.84299 0 51.33 APR 2005 54.7321 0 48.63 MAY 2005 51.42433 0 47.42 JUN 2005 55.62116 0 48.17 JUL 2005 73.9884 0 67.83 AUG 2005 78.85834 0 74.55 SEP 2005 86.27 0 84.96 OCT 2005 92.33 0 85.15 NOV 2005 66.44 0 68.04 DEC 2005 95.28 0 104.85 JAN 2006 61.52792 0 63 FEB 2006 54.53061 0 56.42 MAR 2006 46.90476 0 43.71 APR 2006 52.39229 0 36.82 MAY 2006 52.38075 0 42.46 JUN 2006 59.09957 0 57.2 JUL 2006 91.48587 0 83.27 AUG 2006 65.12907 63.38 61.45 SEP 2006 44.65454 45.31 41.33 OCT 2006 49.62074 49.77 48.83 NOV 2006 54.04011 54.64 53.77 DEC 2006 55.23085 55.86 56.8 JAN 2007 53.53895 55.01 55.43 FEB 2007 58.56741 58.69 61.11 MAR 2007 49.96084 48.92 45.93 APR 2007 57.75829 58.4 51.94 MAY 2007 62.25602 63.64 59.55 JUN 2007 65.45582 70.02 58.93 JUL 2007 88.03434 94.25 75.99 AUG 2007 66.88609 72.57 61.46 SEP 2007 54.7875 57.75 42.84 OCT 2007 60.81668 58.25 45.64 NOV 2007 50.19915 51.53 47.88 DEC 2007 59.85776 62.48 59.71 JAN 2008 52.66597 67.3 59.4 FEB 2008 61.98346 67.35 68.39 MAR 2008 74.61104 76.82 71.79 APR 2008 71.04186 89.34 86.65 MAY 2008 57.43487 83.06 77 JUN 2008 54.49667 99.61 71.51 JUL 2008 69.6367 105.06 96.63 AUG 2008 53.0786 78.19 73.44 SEP 2008 58.98496 56.82 48.41 OCT 2008 46.03902 45.45 41.18 NOV 2008 41.56242 40.28 45.53 DEC 2008 46.00164 45.04 54.1 JAN 2009 49.00709 39.32 52 FEB 2009 46.33944 32.51 47 MAR 2009 41.05925 29.29 39.36 APR 2009 38.03898 27.11 32 MAY 2009 35.01871 34.92 33.89 JUN 2009 29.28895 28.74 27.81 JUL 2009 36.97862 39.76 37 AUG 2009 34.13951 36.6 35.56 SEP 2009 31.22496 33.41 32.95 OCT 2009 34.23255 36.19 39.27 NOV 2009 41.55773 31.96 45.43 DEC 2009 47.99704 50.23 51 JAN 2010 47.51 47.51 52 FEB 2010 46.33944 46.17 47.25 MAR 2010 41.05925 42.77 39.36 APR 2010 35.74 37.18 32 MAY 2010 35.01871 32.47 33.89 JUN 2010 35.67 38.81 37.93 JUL 2010 43.15 47.89 43.91 AUG 2010 40.89 45.77 40.55 SEP 2010 34.91 37.85 37.6 OCT 2010 33.72 31.51 33.32 NOV 2010 33.04 34.29 31.9 DEC 2010 34.57 34.63 37.64 JAN 2011 34.54 33.43 36.53 FEB 2011 35.39 35.86 37.23 MAR 2011 28.13 28.45 31.87 APR 2011 35.14 34.36 32.78 MAY 2011 34.97 35.16 34.63
  • 2. JUN 2011 38.25 40.28 38 JUL 2011 38.25 38.25 40.09 AUG 2011 42.09 42.77 43.22 SEP 2011 39.94 39.16 35.27 OCT 2011 34.76 32.95 32.92 NOV 2011 32.82 32.69 32.56 DEC 2011 31.42 31.48 36.61 JAN 2012 26.84 29.79 25.565 FEB 2012 26.05 27.41 22.3 MAR 2012 22.78963 17.78 21.78477 APR 2012 21.93 21.13 20.90854 MAY 2012 28.89577 30.03 24.095 JUN 2012 35.85 34.38 24.145 JUL 2012 33.32 35.1 26.745 AUG 2012 43.08 34.77 25.85 SEP 2012 29.93 34.04 23.43 OCT 2012 33.4 32.55 24.585 NOV 2012 29.14 35.02 24.511 DEC 2012 29.86 35.73 29.065 JAN 2013 31.68 33.7 26.56 FEB 2013 31.49 30.85 26.71 MAR 2013 33.38655 33.6875 29.835 APR 2013 37.67 35.42 33.08 MAY 2013 38.59333 37.16667 27.29619 JUN 2013 38.12 37.45 32.86 JUL 2013 48.12 43.29 31.275 AUG 2013 37.95 38.81 28.665 SEP 2013 36.8 40.76 32.595 OCT 2013 34.10967 33.39167 34.66667 NOV 2013 32.65593 33.87963 37.10294 DEC 2013 44.49567 48.34167 46.83333 JAN 2014 40.26032 41.82258 41.73913 FEB 2014 54.43 55.77419 62.63636 MAR 2014 41.81367 38.575 39.28571 APR 2014 39.59484 38.95 42.59259 MAY 2014 42.30613 41.03226 42.5 JUN 2014 45.27586 45.47414 40.07143 JUL 2014 46.19452 48.23387 47.14815 AUG 2014 41.73133 42.125 39.86957 SEP 2014 41.23833 39.35 42.67 OCT 2014 38.62448 39.28448 40.2037 NOV 2014 38.47267 37.725 45.26389 DEC 2014 32.86706 32.23529 40.76923 JAN 2015 26.18133 26.64167 36.77778 FEB 2015 23.69875 23.69042 27.81818
  • 3. no statistical difference D Each month PV vs MIDW MIDW vs FC PV FC MIDW D 0.018429 0.027979 0.96% 0.08342 0.066487 1.69% 0.035749 0.052601 1.69% 0.060436 0.024882 3.56% 0.081612 0.015816 6.58% 0.33022 0.408138 7.79% 0.06582 0.099071 3.33% 0.093987 0.139638 4.57% 0.070245 0.002236 6.80% 0.280407 0.20094 7.95% 0.434076 0.541005 10.69% 0.354241 0.399142 4.49% 0.113726 0.104444 0.93% 0.139845 0.225275 8.54% 0.116993 0.15763 4.06% 0.00022 0.153178 15.30% 0.128269 0.34715 21.89% 0.547996 0.455769 9.22% 0.288097 0.262039 2.61% 0.314369 0.285106 0.327421 1.31% 4.23% 0.111214 0.098433 0.181466 7.03% 8.30% 0.089063 0.09785 0.101167 1.21% 0.33% 0.022034 0.022328 0.056351 3.43% 3.40% 0.030633 0.015217 0.02412 0.65% 0.89% 0.093922 0.066897 0.102472 0.85% 3.56% 0.146952 0.166468 0.248405 10.15% 8.19% 0.156071 0.193786 0.130851 2.52% 6.29% 0.077871 0.089726 0.146515 6.86% 5.68% 0.051397 0.100251 0.010411 4.10% 8.98% 0.344943 0.346044 0.289496 5.54% 5.65% 0.240227 0.230027 0.191209 4.90% 3.88% 0.180883 0.204217 0.302961 12.21% 9.87% 0.110047 0.008658 0.065359 4.47% 5.67% 0.174583 0.115365 0.04908 12.55% 6.63% 0.192406 0.212498 0.247076 5.47% 3.46% 0.120148 0.077145 0.005192 11.50% 7.20% 0.176917 0.000743 0.151347 2.56% 15.06% 0.203725 0.140609 0.049715 15.40% 9.09% 0.047837 0.162978 0.206993 15.92% 4.40% 0.191535 0.070293 0.111368 8.02% 4.11% 0.051157 0.199254 0.071299 2.01% 12.80% 0.277816 0.054713 0.35128 7.35% 29.66% 0.237778 0.255759 0.239988 0.22% 1.58% 0.111276 0.273309 0.340822 22.95% 6.75% 0.219479 0.200106 0.149349 7.01% 5.08% 0.097235 0.113751 0.105634 0.84% 0.81% 0.106808 0.118173 0.188228 8.14% 7.01% 0.065334 0.126998 0.038817 2.65% 8.82% 0.054434 0.173194 0.096154 4.17% 7.70% 0.113946 0.099046 0.162553 4.86% 6.35% 0.073559 0.074428 0.186992 11.34% 11.26% 0.079399 0.288086 0.059063 2.03% 22.90% 0.16362 0.176976 0.179404 1.58% 0.24% 0.262545 0.383438 0.330457 6.79% 5.30% 0.076777 0.079477 0.038919 3.79% 4.06% 0.085372 0.087158 0.073397 1.20% 1.38% 0.09632 0.083209 0.191806 9.55% 10.86% 0.213983 0.116883 0.156863 5.71% 4.00% 0.154948 0.571652 0.122606 3.23% 44.90% 0.010147 0.054151 0.019608 0.95% 3.45% 0.024638 0.028205 0.091346 6.67% 6.31% 0.113946 0.073641 0.166984 5.30% 9.33% 0.129551 0.130699 0.186992 5.74% 5.63% 0.020182 0.126681 0.059063 3.89% 6.76% 0.018598 0.195257 0.119209 10.06% 7.60% 0.2097 0.23396 0.157659 5.20% 7.63% 0.052375 0.044268 0.07652 2.41% 3.23% 0.146246 0.173039 0.07275 7.35% 10.03% 0.034088 0.167503 0.11383 7.97% 5.37% 0.020166 0.088226 0.042617 2.25% 4.56% 0.046308 0.009915 0.179937 13.36% 17.00% 0.000868 0.034652 0.02949 2.86% 0.52% 0.024609 0.072689 0.019162 0.54% 5.35% 0.205143 0.206637 0.14397 6.12% 6.27% 0.2492 0.207733 0.028553 22.06% 17.92% 0.004838 0.023283 0.056437 5.16% 3.32%
  • 4. 0.093795 0.14562 0.097314 0.35% 4.83% 0 0.050397 0.055 5.50% 0.46% 0.100392 0.11817 0.078074 2.23% 4.01% 0.051081 0.084405 0.183943 13.29% 9.95% 0.129695 0.15858 0.066629 6.31% 9.20% 0.055811 0.007891 0.010936 4.49% 0.30% 0.042657 0.037014 0.124386 8.17% 8.74% 0.145767 0.053685 0.301694 15.59% 24.80% 0.029434 0.079893 0.127714 9.83% 4.78% 0.125158 0.351332 0.023105 10.21% 32.82% 0.03772 0.188414 0.040222 0.25% 14.82% 0.317637 0.421202 0.1524 16.52% 26.88% 0.240666 0.144855 0.002075 23.86% 14.28% 0.070572 0.020942 0.107683 3.71% 8.67% 0.292917 0.009402 0.033464 25.95% 2.41% 0.305246 0.020995 0.093617 21.16% 7.26% 0.115937 0.043772 0.049296 6.66% 0.55% 0.127545 0.075883 0.00301 12.45% 7.29% 0.024708 0.020274 0.185794 16.11% 16.55% 0.060951 0.056815 0.086186 2.52% 2.94% 0.005997 0.08457 0.005648 0.03% 7.89% 0.060227 0.091977 0.116997 5.68% 2.50% 0.128299 0.051429 0.108765 1.95% 5.73% 0.024511 0.049313 0.174843 15.03% 12.55% 0.012265 0.007623 0.203831 19.16% 19.62% 0.262329 0.155941 0.048235 21.41% 10.77% 0.211347 0.103488 0.083453 12.79% 2.00% 0.030303 0.050245 0.137101 10.68% 8.69% 0.073107 0.180774 0.063558 0.95% 11.72% 0.04262 0.014613 0.070277 2.77% 5.57% 0.36256 0.426865 0.262254 10.03% 16.46% 0.095186 0.134854 0.108773 1.36% 2.61% 0.351951 0.33359 0.500663 14.87% 16.71% 0.23179 0.308372 0.372797 14.10% 6.44% 0.053065 0.009721 0.084175 3.11% 7.45% 0.068476 0.05346 0.002174 6.63% 5.13% 0.070196 0.108253 0.057143 1.31% 5.11% 0.02029 0.060688 0.176603 15.63% 11.59% 0.096617 0.126651 0.154377 5.78% 2.77% 0.011814 0.065875 0.07024 5.84% 0.44% 0.063384 0.001665 0.057799 0.56% 5.61% 0.003931 0.039697 0.125864 12.19% 8.62% 0.145704 0.145519 0.099299 4.64% 4.62% 0.203417 0.173525 0.097904 10.55% 7.56% 0.094823 0.110776 0.243614 14.88% 13.28%
  • 5. Both loads are shown to have linear relationships with MIDW which means that there is a direct correlation Max Min AVG between the how MIDW changes from month to month and how each PV and FC change the same PV VS MIDW PV VS MIDW PV VS MIDW 25.95% 0.03% 7.35% FC VS MIDW FC VS MIDW FC VS MIDW There are several months where the difference is almost 50% difference from PV vs MIDW to FC vs MIDW 44.90% 0.24% 8.23% However since the difference average is less than or at 10 % difference then there is a clear and defined correlation However there will be some of the days that will be out of the range of that average PV FC MIDW this makes it very risky to try and find the prices using historic data along with the MIDW prices. Average Average Average 1 Jan 10.9% 8.1% 11.1% 2 Feb 9.7% 10.6% 14.4% 3 MAR 14.9% 18.0% 16.8% 4 APR 11.0% 12.7% 12.6% 5 MAY 8.7% 14.0% 10.2% 6 JUN 9.2% 13.5% 12.1% 7 JUL 22.2% 16.3% 21.9% 8 AUG 17.7% 12.1% 12.9% 9 SEP 13.7% 12.0% 17.8% 10 OCT 10.6% 10.6% 10.4% 11 NOV 9.2% 7.2% 7.4% 12 DEC 12.2% 19.3% 16.3% PV FC MIDW This Graph is showing the averages of PV FC and MIDW for each month. Standard Deviation Just by looking at the graph you can see a huge correlation between the graphs Jan 0.106742061 0.05258199 0.132971 They all seem to follow the same pattern in their up and down trends. Feb 0.103717604 0.098262823 0.141628 Using just this fact you could use the correlation between PV FC and MIDW MAY 0.069895609 0.102742018 0.105996 to track huge dips and upturns in the market prices, however due to the fact that these price JUN 0.072159813 0.073955388 0.065118 changes are different enough in some sections such as april-june september-november you could not use one set of JUL 0.102250659 0.140358496 0.059437 data to predict the prices in these ranges. AUG 0.075821899 0.063108232 0.108916 SEP 0.177982967 0.142546236 0.143596 OCT 0.105870234 0.084902749 0.086019 NOV 0.113789231 0.087302308 0.115603 DEC 0.059480304 0.080839854 0.056475 JAN 0.072436806 0.045295125 0.052358 FEB 0.110346312 0.204935255 0.067931 0 0.1 0.2 0.3 0.4 0.5 0.6 0 0.1 0.2 0.3 0.4 0.5 0.6 MIDW VS PV MIDW VS PV Linear (MIDW VS PV) 0 0.1 0.2 0.3 0.4 0.5 0.6 0.7 0 0.1 0.2 0.3 0.4 MIDW VS FC MIDW VS FC Linear (MIDW VS FC) 0.0% 5.0% 10.0% 15.0% 20.0% 25.0% 0 5 10 15 PV FC and MIDW Averages PV Average FC Average MIDW Average 0 0.05 0.1 0.15 0.2 0.25 0 2 4 6 8 10 12 14 Standard Deviation PV Stdev FC stedv MIDW Stdev
  • 6. PV FC MIDW PV FC MIDW Average Average Average Standard Deviation JAN 43.04014358 43.48532258 45.07472 11.83292 20.50996 12.68514 FEB 44.32667029 44.32677419 45.9086 13.23946 21.95376 15.69478 MAR 43.25579896 39.5365625 41.42555 14.49185 22.91523 13.6224 APR 44.40383591 42.73625 41.74011 14.27255 26.2877 18.17298 MAY 43.82986156 44.68486559 42.27312 11.26427 25.04803 15.93301 JUN 45.71280265 49.34551724 43.66264 12.13688 29.52992 15.05143 JUL 56.91584407 56.47923387 54.98881 21.86124 33.78888 24.10534 AUG 50.38329355 48.950625 48.46146 14.95704 22.23456 17.87523 SEP 45.87402916 42.3925 42.2055 17.03828 15.9418 16.5586 OCT 45.7653145 38.69701868 42.57654 18.70446 15.3801 16.4813 NOV 41.99280078 37.1718287 43.19878 11.73588 14.66366 12.43948 DEC 47.75800088 42.5208701 51.73776 19.59962 17.43209 21.08773