Output Examples - Language Accent Bias Research.pptx
1. 10%
5%
69%
3%
8%
5%
Manager
6%
1%
61%
7%
20%
4%
Employee
ACCENT BIAS RESEARCH PROJECT
Supported by Company Inc
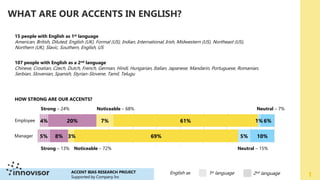
15 people with English as 1st language
American, British, Diluted, English (UK), Formal (US), Indian, International, Irish, Midwestern (US), Northeast (US),
Northern (UK), Slavic, Southern, English, US
107 people with English as a 2nd language
Chinese, Croatian, Czech, Dutch, French, German, Hindi, Hungarian, Italian, Japanese, Mandarin, Portuguese, Romanian,
Serbian, Slovenian, Spanish, Styrian-Slovene, Tamil, Telugu
1
Strong – 24% Noticeable – 68% Neutral – 7%
Strong – 13% Neutral – 15%
English as 1st language 2nd language
WHAT ARE OUR ACCENTS IN ENGLISH?
HOW STRONG ARE OUR ACCENTS?
Noticeable – 72%
2. 2
ACCENT BIAS RESEARCH PROJECT
Supported by Company Inc
TO
FROM
Strong Noticeable Neutral
Strong 16% 76% 7%
Noticeable 13% 75% 12%
Neutral 15% 85% 0%
Group
size
20% 70% 10%
Unknown accent
WHERE DO WE FIND ENERGY?
The interaction matrix shows how your team interacts across
different accent groups. It tells you how many nominations
have been given by one accent group to another. The table is
read from row to column.
The network visualization shows employees as circles, and managers as
squares.. The larger the shape, the more nominations a person
received from his or her peers in the network. The arrowed lines
show nominations from coworkers.
3. 4.0
4.2
4.4
4.6
4.8
5.0
Strong Noticeable Neutral
Level
of
comfort
speaking
English
ACCENT BIAS RESEARCH PROJECT
Supported by Company Inc 3
50%
60%
70%
80%
90%
100%
Time
speaking
English
at
work
English as
1st language
English as
2nd language
HOW COMFORTABLE ARE WE WITH
SPEAKING ENGLISH?
HOW OFTEN DO WE SPEAK ENGLISH AT
WORK?
English as
1st language
English as
2nd language
HOW DO WE USE ENGLISH AT WORK?
Very
comfortable
Comfortable
Strong Noticeable Neutral
Strong Noticeable Neutral
The bars show the average for each accent group. The lines show the
average for people with English as a 1st language and English as a
nd
4. 0
1
2
3
4
5
0 1 2 3 4 5
Help
&
Advice
nominations
Energy nominations
Strong
Noticeable
Neutral
HOW OFTEN ARE WE SOUGHT OUT BY COWORKERS?
4
Strong
Noticeable
Neutral
Managers Employees
The bubble chart shows the average number
of nominations the people in each accent
group have received from their
coworkers. It is based on the input on
the questions “Please select the
coworkers you most often reach out to
for help and advice”, and “Please select
the coworkers who energize you in your
daily work”.
The size of the bubbles are based on the
size of each group.
6. 100%
84%
64%
14%
20%
2%
16%
Neutral
Noticeable
Strong
I have received comments from coworkers about my
accent
I avoid speaking up at work because of my accent
I worry that my coworkers perceive me as less competent
because of my accent
6
ACCENT BIAS RESEARCH PROJECT
Supported by Company Inc
All the time Often Sometimes Rarely Never
100%
79%
36%
18%
32%
4%
24%
8%
Neutral
Noticeable
Strong
92%
76%
36%
16%
32%
8%
6%
28%
1%
4%
Neutral
Noticeable
Strong
HOW DO ACCENTS AFFECT US?