
Recomendados
Más contenido relacionado
La actualidad más candente
La actualidad más candente (20)
Similar a China as trading superpower
Similar a China as trading superpower (20)
Último
Último (20)
China as trading superpower
- 1. China as a Trading Superpower Xiaojun Li Just over three decades ago, when Deng Xiaoping announced the policy of reform and opening up in 1978, China’s total imports and exports of $20.6 billion ranked 32nd among all nations and accounted for less than one percent of global trade. In 2010, China’s total merchandise trade exceeded $3 trillion, 143 times the level of 1978. With an annual growth of 17.2 percent in exports and 16.4 percent in imports, China now account for 10.4 percent and 9.1 percent of global exports and imports, making it the world’s largest commodity exporter and second largest commodity importer.1 China’s meteoric rise to trading superpower status have raised concerns from foreign policymakers as they evaluate how China’s increased economic clout will affect their economies and the global trade regime as a whole. In this context, this article assesses China’s evolving trade policies in the reform era, the sustainability of its exportled growth amidst the global economic downturn, and the implications for global trading governance. CHINA’S RISE TO TRADING SUPERPOWER Under the centrally planned economy prior to 1978, China conducted minimal trade with the rest of the world, exporting just enough raw materials and simple manufactured goods to cover payments for imports of strategic minerals and other production materials not available at home. This inwardlooking, planned economic development strategy was reversed with the policy of reform and openingup beginning at the end of 1978, which committed China to widen its foreign economic relations with the outside world. The reform period witnessed a series of structural and economic policy changes that reorganised and decentralised foreign trade institutions, promoted foreign economic relations and foreign direct investment, expanded foreign trade, and ushered China into a number of international organisations. Through most of the 1980s, both imports and exports rose steadily, albeit unevenly, under an import substitution strategy aimed at promoting local production of industrialised products. Exports grew faster than imports from 1980 to 1983, leading to trade surpluses in those years. Over the next six years, however, imports surged due to the expansion of foreign reserves, the decentralised management of foreign trade and large purchases of foreign plant and equipment for domestic industries. In order to reduce the resulting trade deficits, a series of policies were introduced, including an import and export licensing system, stricter controls on foreign exchange expenditures, and the gradual devaluation of the renminbi by over 60 percent over the decade (see Figure 1). Overall, foreign trade reforms in the 1980s focused on transforming China’s highly centralised system to incorporate elements of a marketbased economy. The gradual liberalisation of trade resulted in incredible growth of the economy in terms of GDP, trade and foreign investment. By the end of the 1980s, Chinese trade totalled $115.4 billion, representing 24 percent of China’s GDP and 3 percent of total world trade and catapulting China to the
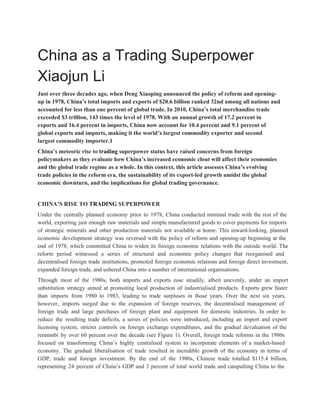
- 2. 16th largest trader in the world. 1 Note: Data used in this article are drawn from the following sources: China General Administration of Customs, the Chinese Ministry of Commerce, China Statistical Yearbook, the International Monetary Fund, the World Bank World Development Indicators and the World Trade Organisation. With major reforms in taxation, banking, exchange rates and foreign exchange management that took place in the 1990s, China’s trade volume continued to grow as Beijing gradually moved toward an exportled development strategy. Two aspects that contributed significantly to the expansion in exports and imports during this period are worth highlighting. First, China abolished the dualtrack exchange rate system in 1994 and created a unified rate pegged to the US dollar, depreciating the renminbi by 44 percent from the previous year (see Figure 1). The renminbi exchange rate remained stable for the next 11 years, granting a competitive edge to China’s already cheap exports and, at the same time, fuelling foreign criticism of currency manipulation. Second, to pave way for China’s bid to join the World Trade Organisation (WTO), Beijing engaged in a series of voluntary tariff cuts on over 5,000 products, driving down the simple average of tariffs from 47.2 percent in 1990 to 15.8 percent in 1999 (see Figure 2). Figure 1: China's Trade and Exchange Rate, 19782010 Figure 2: China’s Average Tariff Rate, 19782010 Thus, despite government intervention to cool down the economy in the mid1990s and the Asian Financial Crisis of 1997, Chinese imports and exports achieved remarkable annual growth rates of 14 percent and 16 percent, respectively, and reached $474.3 billion in 2000, putting China sixth in the global trade ranking. On November 11, 2001, China formally joined the WTO as the 143rd member of the multilateral economic institution that governs over 90 percent of global traders. In its accession package, China promised to offer WTO members greater market access to its agriculture, manufacture and service sectors by lowering tariff barriers, removing nontariff measures and bringing its domestic laws, regulations and other traderelated measures into conformity with WTO rules. WTO membership enabled China to become fully integrated into the global market and unleashed its potential as a trading power. Consequently, between 2001 and 2008, China’s trade grew exponentially (see Figure 1) with imports and exports both crossing the $1 trillion mark in 2008. CHALLENGES TO CHINA’S TRADELED GROWTH The speed of China’s rise to trading superpower status has been nothing short of phenomenal. Foreign trade has become China’s main engine of economic growth, contributing to over 50 percent of China’s GDP since 2002. Notwithstanding these remarkable achievements, there remain a number of important social and economic challenges, including various economic imbalances that stem from the rapid tradeled growth, which could jeopardise the stability of the economy and thus the achievement of the Communist Party’s ultimate goal of ‘harmonious society’. First, throughout the reform period, China’s exports have grown at a much faster rate than its imports, contributing to everwidening trade surpluses that peaked at $298 billion in 2008 (see Figure 1). This has prompted Western countries to accuse China of currency manipulation since it joined the WTO. The United States, in particular, charged that the renminbi was significantly undervalued by as much as 40
- 3. percent, making Chinese exports to the United States cheaper than they would be if exchange rates were determined by market forces. Although in July 2005 the renminbi was revalued by 2.1 percent in relation to the US dollar – allegedly as a result of increased international pressures – and the value of the renminbi has increased by 30 percent since China moved to a managed floating exchange rate regime with respect to a basket of currencies , the trade surpluses continued to rise, leading to the passage of two currency bills at the US Congress and Senate in 2010 and 2011. Heavy dependence on manufactured exports has also left China vulnerable to import Figure 3: Antidumping and Countervailing Investigations Against China, 19952008 (trading company) restrictive measures from its trading partners. Since 1995, for example, China has consistently ranked as the country that is subjected to the highest number of antidumping and countervailing measures. According to the statistics released by the WTO, 35 percent of all antidumping investigations and 71 percent of all countervailing investigations since 2008 have been targeted at Chinese products (see Figure 3). Second, China’s trade has long been structurally unbalanced, with overreliance on exports from traditional low skilled, low technology, and resource and labourintensive industries. These industries are beginning to lose their external competitiveness as labour force growth slows and labour costs rise, and because of bottlenecks in land, water, and energy resources exacerbated by overextraction and duplicate investments. In addition, until 2008 the majority of China’s exports were from trade processing industries with low value added. For instance, China earns only two percent of the total value for each iPad it assembles and exports to the rest of the world. Such structural imbalances cast doubt on the longterm sustainability of growth in trade and the economy. Third, China’s trade is conducted disproportionally with a small group of countries (see Figure 4). In 2001, China’s ten largest trading partners – Japan, the United States, the European Union, Hong Kong Special, the ASEAN countries, South Korea, Taiwan, Australia, Russia and Canada – accounted for 87.3 percent of exports and 84.5 percent of imports. These numbers dropped to 80.7 percent and 72.3 percent by 2008, but were still much higher compared to the United States (61.4 percent and 65.9 percent). Such heavy trade dependence exposes China to much greater risks during economic slowdowns resulting from systemic and structural shocks in the global economy, such as the most recent financial crisis in 2008. Finally, the pace of China’s growth has exacerbated a number of domestic social and economic problems. Income inequality has widened, especially between urban and rural residents and between the coastal and inland regions. The GINI index, measures inequalities within a population, has risen from 0.28 at the beginning of the reform period to 0.52 in 2010, making China the fourth most unequal country in the world. China has also paid a high environmental premium for its growth, which has been fuelled by unsustainable, energyinefficient industries, leading to severe and widespread environmental problems. According to a World Bank report in 2007, 16 of the 20 most polluted cities in the world are Chinese. If left unattended, these problems may seriously hamper China’s longterm development goals and its effort to maintain social and economic stability. Figure 4: China’s Trade with its Top 10 Trading Partners, 20012010
- 4. RESPONSES TO THE GLOBAL FINANCIAL CRISIS The global economic recession that began in late 2008 posed the most serious challenge to China’s dependence on exportled growth. In 2009, China’s exports fell by 16 percent and imports fell by 11 percent due to sluggish demand both at home and abroad. Real GDP growth declined from 9.6 percent in 2008 to a yearonyear rate of 6.2 percent in the first quarter of 2009, the lowest rate in more than a decade. Meanwhile, Chinese exports also became the major target of worldwide protectionist measures. According to one study, of the 2,197 importdistorting measures such as state bailouts, local content requirement and subsidies taken by countries during the current global downturn since March 2009, 1,053 – or 49 percent – directly or indirectly affected exports from China. At the same time, however, the crisis also provided China with the opportunity and reinforced its intention to tackle many of the challenges described in the previous section by introducing a series of structural reforms aimed at diversifying its economic structure, making the labour market more flexible, strengthening social safety nets, promoting greater private sector participation and competition in the economy, and developing a more efficient capital market. The centrepiece of China’s response to the global financial crisis was its fourtrillion renminbi ($570 billion) stimulus package unveiled at the end of 2008. The stimulus financed programmes in areas such as lowincome housing, rural infrastructure, water, electricity, transportation, the environment, technological innovation and disaster rebuilding, among others. Its goal was to offset slowing exports and investment amidst global economic conditions by raising domestic consumption, a shift long advocated by analysts of the Chinese economy and by some within the government. In addition to boosting consumption, the stimulus package was also designed to address the various structural imbalances in the economy. For instance, priority was placed on investments and projects in clean technology and indigenous innovation. Social services such as health and education were expanded to improve human capital and facilitate the movement of surplus labour from lowproductivity sectors into other activities, notably services. Simultaneously, China sought to further expand its trade with developing and emerging markets. Since becoming a member of the WTO in 2001, China has been actively exploring trade opportunities in these markets through bilateral and free trade agreements (FTAs), signing the Framework Agreement on ChinaAssociation of Southeast Asian Nations (ASEAN) Comprehensive Economic Cooperation in as early as November 2002. Since then, China has signed nine additional FTAs and Economic Partnership Arrangements (EPAs) with Singapore, Pakistan, New Zealand, Chile, Peru, Costa Rica, Hong Kong, Macao and, most recently, Taiwan. In addition, FTAs between China and the Gulf Cooperation Council, Australia, Norway, Iceland and the Southern African Customs Union are being negotiated while joint feasibility studies on regional trade arrangements with India, South Korea, Japan and Switzerland have been completed (see Table 1). Overall, China’s existing and proposed FTAs cover 28 economies in five continents. Trading with emerging markets and FTA members allowed China to recoup some of the losses in exports that resulted from depressed demand in developed markets such as the European Union and the United States. In the first quarter of 2009, for instance, China’s exports to Pakistan grew by 32 percent in the context of a 12 percent drop in that country’s total imports. In the same year, China also became Brazil’s largest trading partner. With the help of the stimulus package and trade diversification, China was one of the first countries to
- 5. recover from the global economic recession, achieving yearonyear GDP growth of 8.7 percent in 2009, surpassing the level predicted by most analysts a year earlier. China’s trade also rebounded in 2010 (see figure 1), with trade volumes with the emerging markets growing at a much faster rate than with its traditional markets: China’s trade with the ASEAN countries, Brazil, Russia, South Africa, and India during the year increased by 37.5 percent, 47.5 percent, 43.1 percent, 59.5 percent and 42.4 percent, respectively, while the numbers for traditional trading partners such as Japan, the European Union and the United States hovered around 30 percent. Table 1: China’s Free Trade Agreements FTAs and EPAs in Force First Agreement Signed ChinaASEAN FTA November 4, 2002 ChinaPakistan FTA November 24, 2006 ChinaChile FTA November 18, 2005 ChinaNew Zealand FTA April 7, 2008 ChinaSingapore FTA October 23, 2008 ChinaPeru FTA April 28, 2009 ChinaCosta Rica FTA April 8, 2010 Mainland and Hong Kong Closer EPA June 29, 2003 Mainland and Macau Closer EPA October 18, 2003 Mainland and Taiwan Economic Cooperation Framework Agreement (ECFA) MOVING FORWARD As emphasised in Premier Wen’s Government Work Report delivered at the annual session of the National People’s Congress in 2012, while it is important to expand domestic demand, foreign trade has been a key driver of China’s economy and will continue to be so for the years to come. The 12th FiveYear Plan (20112015) further stipulates that China should maintain an annual growth rate of 10 percent in trade and that total trade volume should reach $4.8 trillion in 2015. Given the pace of trade growth in the past three decades and the trend of the recent rebound, there is no reason to believe that the goals set in the five year plan cannot be achieved, or, more likely, exceeded. According to a recent report by Citigroup, China is expected to overtake the United States to become the world’s largest trader by 2015 and remain in the top spot until at least 2050. June 29, 2010 FTAs under Negotiation Latest Round of Negotiation ChinaGCC(Gulf Cooperation Council) FTA June 22, 2009 ChinaAustralia FTA February 28, 2010 ChinaIceland FTA May 5, 2008 ChinaNorway FTA September 16, 2010 ChinaSACU(Southern African Customs Union) FTA July 2, 2004 FTAs under Consideration
- 6. ChinaIndia Regional Trade Arrangement Joint Feasibility Study ChinaKorea FTA Joint Feasibility Study ChinaJapanKorea Joint Study ChinaSwitzerland FTA Joint St As its share in global trade continues to rise, China as a trading superpower is likely to encounter even more frictions with its trading partners, particularly for policies that have already been repeatedly criticised by foreign governments, such as currency devaluation, widespread violation of intellectual property rights, and a number of discriminatory measures in trade, innovation and investment. Recent cases of such policies include China’s export restrictions on rare earths and its indigenous innovation product measures and the China Compulsory Certification (CCC) mark, which, according to the European Union’s Ambassador to China, created significant obstacles to imports in China. These tradedistorting policies leave Chinese consumers worse off, stoke up protectionism abroad, and could potentially lead to a downward protectionist spiral and further weaken the global recovery. Fortunately, while there is still a long way to go, things seem to be improving. On various occasions, Chinese leaders have expressed their willingness to address these issues and contribute to the stability of the global economy. In addition, China’s recent experience with the WTO’s Dispute Settlement Body (DSB) suggests that the country is gradually internalising the principles of fairness and nondiscrimination embodied by the multilateral trading regime, committing to comply with all DSB rulings and redress its WTOinconsistent policies in a number of cases. It is therefore critically important for the rest of the world to continue to engage China in the WTO and other regional and multilateral institutions, and refrain from unilateral measures such as the US currency bills which could backfire and trigger trade wars. The rise of China as a responsible trading superpower can not only strengthen China’s economic relations with the world and the global trade regime as a whole, but, at the same time, help China accomplish its own domestic economic reform goals. ■ 31