SlideShare una empresa de Scribd logo
1 de 82
Where'd all my memory go?
Joshua Miller
SCALE 12x – 22 FEB 2014
The Incomplete Story

Computers have memory, which they use to run
applications.
Cruel Reality
●

swap

●

caches

●

buffers

●

shared

●

virtual

●

resident

●

more...
Topics
●

Memory basics
–

Paging, swapping, caches, buffers

●

Overcommit

●

Filesystem cache

●

Kernel caches and buffers

●

Shared memory
top is awesome
top - 15:57:33 up 131 days, 8:02, 3 users, load average: 0.00, 0.00, 0.00
Tasks: 129 total,
1 running, 128 sleeping,
0 stopped,
0 zombie
Cpu(s): 0.2%us, 0.3%sy, 0.3%ni, 99.0%id, 0.2%wa, 0.0%hi, 0.0%si, 0.0%st
Mem:
3858692k total, 3149296k used,
709396k free,
261556k buffers
Swap:
0k total,
0k used,
0k free, 1081832k cached
PID
8131
8153
8154
7767
7511
3379
7026

USER
root
root
root
root
root
root
root

PR
30
30
30
30
30
20
20

NI VIRT RES SHR
10 243m 50m 3748
10 238m 19m 7840
10 208m 15m 14m
10 50704 8748 1328
10 140m 7344 580
0 192m 4116 652
0 113m 3992 3032

S %CPU %MEM
S 0.0 1.3
S 0.0 0.5
S 0.0 0.4
S 1.0 0.2
S 0.0 0.2
S 0.0 0.1
S 0.0 0.1

TIME+
0:51.97
1:35.48
0:08.03
1559:39
13:06.29
48:20.28
0:00.02

COMMAND
chef-client
sssd_be
sssd_nss
munin-asyncd
munin-node
snmpd
sshd
top is awesome
top - 15:57:33 up 131 days, 8:02, 3 users, load average: 0.00, 0.00, 0.00
Tasks: 129 total,
1 running, 128 sleeping,
0 stopped,
0 zombie
Cpu(s): 0.2%us, 0.3%sy, 0.3%ni, 99.0%id, 0.2%wa, 0.0%hi, 0.0%si, 0.0%st
Mem:
3858692k total, 3149296k used,
709396k free,
261556k buffers
Swap:
0k total,
0k used,
0k free, 1081832k cached
PID
8131
8153
8154
7767
7511
3379
7026

USER
root
root
root
root
root
root
root
●
●

PR
30
30
30
30
30
20
20

NI VIRT RES SHR
10 243m 50m 3748
10 238m 19m 7840
10 208m 15m 14m
10 50704 8748 1328
10 140m 7344 580
0 192m 4116 652
0 113m 3992 3032

S %CPU %MEM
S 0.0 1.3
S 0.0 0.5
S 0.0 0.4
S 1.0 0.2
S 0.0 0.2
S 0.0 0.1
S 0.0 0.1

Physical memory used and free
Swap used and free

TIME+
0:51.97
1:35.48
0:08.03
1559:39
13:06.29
48:20.28
0:00.02

COMMAND
chef-client
sssd_be
sssd_nss
munin-asyncd
munin-node
snmpd
sshd
top is awesome
top - 15:57:33 up 131 days, 8:02, 3 users, load average: 0.00, 0.00, 0.00
Tasks: 129 total,
1 running, 128 sleeping,
0 stopped,
0 zombie
Cpu(s): 0.2%us, 0.3%sy, 0.3%ni, 99.0%id, 0.2%wa, 0.0%hi, 0.0%si, 0.0%st
Mem:
3858692k total, 3149296k used,
709396k free,
261556k buffers
Swap:
0k total,
0k used,
0k free, 1081832k cached
PID
8131
8153
8154
7767
7511
3379
7026

USER
root
root
root
root
root
root
root

PR
30
30
30
30
30
20
20

NI VIRT RES SHR
10 243m 50m 3748
10 238m 19m 7840
10 208m 15m 14m
10 50704 8748 1328
10 140m 7344 580
0 192m 4116 652
0 113m 3992 3032

S %CPU %MEM
S 0.0 1.3
S 0.0 0.5
S 0.0 0.4
S 1.0 0.2
S 0.0 0.2
S 0.0 0.1
S 0.0 0.1

TIME+
0:51.97
1:35.48
0:08.03
1559:39
13:06.29
48:20.28
0:00.02

COMMAND
chef-client
sssd_be
sssd_nss
munin-asyncd
munin-node
snmpd
sshd

Percentage of RES/total memory
Per-process breakdown of virtual, resident, and shared memory
top is awesome
top - 15:57:33 up 131 days, 8:02, 3 users, load average: 0.00, 0.00, 0.00
Tasks: 129 total,
1 running, 128 sleeping,
0 stopped,
0 zombie
Cpu(s): 0.2%us, 0.3%sy, 0.3%ni, 99.0%id, 0.2%wa, 0.0%hi, 0.0%si, 0.0%st
Mem:
3858692k total, 3149296k used,
709396k free,
261556k buffers
Swap:
0k total,
0k used,
0k free, 1081832k cached
PID
8131
8153
8154
7767
7511
3379
7026

USER
root
root
root
root
root
root
root

PR
30
30
30
30
30
20
20

NI VIRT RES SHR
10 243m 50m 3748
10 238m 19m 7840
10 208m 15m 14m
10 50704 8748 1328
10 140m 7344 580
0 192m 4116 652
0 113m 3992 3032

S %CPU %MEM
S 0.0 1.3
S 0.0 0.5
S 0.0 0.4
S 1.0 0.2
S 0.0 0.2
S 0.0 0.1
S 0.0 0.1

TIME+
0:51.97
1:35.48
0:08.03
1559:39
13:06.29
48:20.28
0:00.02

COMMAND
chef-client
sssd_be
sssd_nss
munin-asyncd
munin-node
snmpd
sshd

Kernel buffers and caches (no association with swap,
despite being on the same row)
/proc/meminfo
[jmiller@meminfo]$ cat /proc/meminfo
MemTotal:
3858692 kB
MemFree:
3445624 kB
Buffers:
19092 kB
Cached:
128288 kB
SwapCached:
0 kB
...
/proc/meminfo
[jmiller@meminfo]$ cat /proc/meminfo
MemTotal:
3858692 kB
MemFree:
3445624 kB
Buffers:
19092 kB
Cached:
128288 kB
SwapCached:
0 kB
...
Many useful values which we'll refer to throughout
the presentation
Overcommit
top - 14:57:44 up 137 days, 7:02, 6 users, load average: 0.03, 0.02, 0.00
Tasks: 141 total,
1 running, 140 sleeping,
0 stopped,
0 zombie
Cpu(s): 0.0%us, 0.2%sy, 0.0%ni, 99.8%id, 0.0%wa, 0.0%hi, 0.0%si, 0.0%st
Mem:
3858692k total, 3075728k used,
782964k free,
283648k buffers
Swap:
0k total,
0k used,
0k free, 1073320k cached
PID USER
22385 jmiller

PR
20

NI VIRT
0 18.6g

RES
572

SHR S %CPU %MEM
308 S 0.0 0.0

TIME+ COMMAND
0:00.00 bloat

4G of physical memory and no swap , so how can “bloat” have 18.6g virtual?
●

●

Virtual memory is not “physical memory plus swap”

A process can request huge amounts of memory, but it
isn't mapped to “real memory” until actually referenced
Linux filesystem caching
Free memory is used to cache filesystem contents.
Over time systems can appear to be out of memory
because all of the free memory is used for cache.
top is awesome
top - 15:57:33 up 131 days, 8:02, 3 users, load average: 0.00, 0.00, 0.00
Tasks: 129 total,
1 running, 128 sleeping,
0 stopped,
0 zombie
Cpu(s): 0.2%us, 0.3%sy, 0.3%ni, 99.0%id, 0.2%wa, 0.0%hi, 0.0%si, 0.0%st
Mem:
3858692k total, 3149296k used,
709396k free,
261556k buffers
Swap:
0k total,
0k used,
0k free, 1081832k cached
PID
8131
8153
8154
7767
7511
3379
7026

USER
root
root
root
root
root
root
root

PR
30
30
30
30
30
20
20

NI VIRT RES SHR
10 243m 50m 3748
10 238m 19m 7840
10 208m 15m 14m
10 50704 8748 1328
10 140m 7344 580
0 192m 4116 652
0 113m 3992 3032

S %CPU %MEM
S 0.0 1.3
S 0.0 0.5
S 0.0 0.4
S 1.0 0.2
S 0.0 0.2
S 0.0 0.1
S 0.0 0.1

TIME+
0:51.97
1:35.48
0:08.03
1559:39
13:06.29
48:20.28
0:00.02

COMMAND
chef-client
sssd_be
sssd_nss
munin-asyncd
munin-node
snmpd
sshd

About 25% of this system's memory is from page cache
Linux filesystem caching
Additions and removals from the cache are transparent to
applications
Tunable through swappiness

Can be dropped - echo 1 > /proc/sys/vm/drop_caches
Under memory pressure, memory is freed automatically*
*usually
Where'd my memory go?
top - 16:40:53 up 137 days, 8:45, 5 users, load average: 0.88, 0.82, 0.46
Tasks: 138 total,
1 running, 137 sleeping,
0 stopped,
0 zombie
Cpu0 : 0.0%us, 0.0%sy, 0.0%ni,100.0%id, 0.0%wa, 0.0%hi, 0.0%si, 0.0%st
Cpu1 : 0.0%us, 0.0%sy, 0.0%ni,100.0%id, 0.0%wa, 0.0%hi, 0.0%si, 0.0%st
Mem:
3858692k total, 1549480k used, 2309212k free,
25804k buffers
Swap:
0k total,
0k used,
0k free,
344280k cached
PID
28285
7767
7511
3379

USER
root
root
root
root

PR
30
30
30
20

NI VIRT RES SHR S %CPU %MEM
10 238m 17m 6128 S 0.0 0.5
10 50704 8732 1312 S 0.0 0.2
10 140m 7344 580 S 0.0 0.2
0 192m 4116 652 S 0.0 0.1

TIME+
1:39.42
1659:37
13:56.68
50:31.44

COMMAND
sssd_be
munin-asyncd
munin-node
snmpd
Where'd my memory go?
top - 16:40:53 up 137 days, 8:45, 5 users, load average: 0.88, 0.82, 0.46
Tasks: 138 total,
1 running, 137 sleeping,
0 stopped,
0 zombie
Cpu0 : 0.0%us, 0.0%sy, 0.0%ni,100.0%id, 0.0%wa, 0.0%hi, 0.0%si, 0.0%st
Cpu1 : 0.0%us, 0.0%sy, 0.0%ni,100.0%id, 0.0%wa, 0.0%hi, 0.0%si, 0.0%st
Mem:
3858692k total, 1549480k used, 2309212k free,
25804k buffers
Swap:
0k total,
0k used,
0k free,
344280k cached
PID
28285
7767
7511
3379

USER
root
root
root
root

1.5G used

PR
30
30
30
20

NI VIRT RES SHR S %CPU %MEM
10 238m 17m 6128 S 0.0 0.5
10 50704 8732 1312 S 0.0 0.2
10 140m 7344 580 S 0.0 0.2
0 192m 4116 652 S 0.0 0.1

TIME+
1:39.42
1659:37
13:56.68
50:31.44

COMMAND
sssd_be
munin-asyncd
munin-node
snmpd
Where'd my memory go?
top - 16:40:53 up 137 days, 8:45, 5 users, load average: 0.88, 0.82, 0.46
Tasks: 138 total,
1 running, 137 sleeping,
0 stopped,
0 zombie
Cpu0 : 0.0%us, 0.0%sy, 0.0%ni,100.0%id, 0.0%wa, 0.0%hi, 0.0%si, 0.0%st
Cpu1 : 0.0%us, 0.0%sy, 0.0%ni,100.0%id, 0.0%wa, 0.0%hi, 0.0%si, 0.0%st
Mem:
3858692k total, 1549480k used, 2309212k free,
25804k buffers
Swap:
0k total,
0k used,
0k free,
344280k cached
PID
28285
7767
7511
3379

USER
root
root
root
root

PR
30
30
30
20

NI VIRT RES SHR S %CPU %MEM
10 238m 17m 6128 S 0.0 0.5
10 50704 8732 1312 S 0.0 0.2
10 140m 7344 580 S 0.0 0.2
0 192m 4116 652 S 0.0 0.1

1.5G used - 106MB RSS

...

TIME+
1:39.42
1659:37
13:56.68
50:31.44

COMMAND
sssd_be
munin-asyncd
munin-node
snmpd
Where'd my memory go?
top - 16:40:53 up 137 days, 8:45, 5 users, load average: 0.88, 0.82, 0.46
Tasks: 138 total,
1 running, 137 sleeping,
0 stopped,
0 zombie
Cpu0 : 0.0%us, 0.0%sy, 0.0%ni,100.0%id, 0.0%wa, 0.0%hi, 0.0%si, 0.0%st
Cpu1 : 0.0%us, 0.0%sy, 0.0%ni,100.0%id, 0.0%wa, 0.0%hi, 0.0%si, 0.0%st
Mem:
3858692k total, 1549480k used, 2309212k free,
25804k buffers
Swap:
0k total,
0k used,
0k free,
344280k cached
PID
28285
7767
7511
3379

USER
root
root
root
root

PR
30
30
30
20

NI VIRT RES SHR S %CPU %MEM
10 238m 17m 6128 S 0.0 0.5
10 50704 8732 1312 S 0.0 0.2
10 140m 7344 580 S 0.0 0.2
0 192m 4116 652 S 0.0 0.1

...

TIME+
1:39.42
1659:37
13:56.68
50:31.44

1.5G used - 106MB RSS - 345MB cache - 25MB buffer

COMMAND
sssd_be
munin-asyncd
munin-node
snmpd
Where'd my memory go?
top - 16:40:53 up 137 days, 8:45, 5 users, load average: 0.88, 0.82, 0.46
Tasks: 138 total,
1 running, 137 sleeping,
0 stopped,
0 zombie
Cpu0 : 0.0%us, 0.0%sy, 0.0%ni,100.0%id, 0.0%wa, 0.0%hi, 0.0%si, 0.0%st
Cpu1 : 0.0%us, 0.0%sy, 0.0%ni,100.0%id, 0.0%wa, 0.0%hi, 0.0%si, 0.0%st
Mem:
3858692k total, 1549480k used, 2309212k free,
25804k buffers
Swap:
0k total,
0k used,
0k free,
344280k cached
PID
28285
7767
7511
3379

USER
root
root
root
root

PR
30
30
30
20

NI VIRT RES SHR S %CPU %MEM
10 238m 17m 6128 S 0.0 0.5
10 50704 8732 1312 S 0.0 0.2
10 140m 7344 580 S 0.0 0.2
0 192m 4116 652 S 0.0 0.1

...

TIME+
1:39.42
1659:37
13:56.68
50:31.44

COMMAND
sssd_be
munin-asyncd
munin-node
snmpd

1.5G used - 106MB RSS - 345MB cache - 25MB buffer = ~1GB mystery
What is consuming a GB of memory?
kernel slab cache
●

The kernel uses free memory for its own caches.

●

Some include:
–
–
–

dentries (directory cache)
inodes
buffers
kernel slab cache
[jmiller@mem-mystery ~]$ slabtop -o
Active / Total Objects (% used)
Active / Total Slabs (% used)
Active / Total Caches (% used)
Active / Total Size (% used)
Minimum / Average / Maximum Object
OBJS
624114
631680
649826
494816
186
4206
6707
2296

-s c
: 2461101 / 2468646 (99.7%)
: 259584 / 259586 (100.0%)
: 104 / 187 (55.6%)
: 835570.40K / 836494.74K (99.9%)
: 0.02K / 0.34K / 4096.00K

ACTIVE USE OBJ SIZE SLABS OBJ/SLAB CACHE SIZE NAME
624112 99%
1.02K 208038
3
832152K nfs_inode_cache
631656 99%
0.19K 31584
20
126336K dentry
649744 99%
0.06K 11014
59
44056K size-64
494803 99%
0.03K
4418
112
17672K size-32
186 100%
32.12K
186
1
11904K kmem_cache
4193 99%
0.58K
701
6
2804K inode_cache
6163 91%
0.20K
353
19
1412K vm_area_struct
2290 99%
0.55K
328
7
1312K radix_tree_node

1057MB of kernel slab cache
Where'd my memory go?
top - 16:40:53 up 137 days, 8:45, 5 users, load average: 0.88, 0.82, 0.46
Tasks: 138 total,
1 running, 137 sleeping,
0 stopped,
0 zombie
Cpu0 : 0.0%us, 0.0%sy, 0.0%ni,100.0%id, 0.0%wa, 0.0%hi, 0.0%si, 0.0%st
Cpu1 : 0.0%us, 0.0%sy, 0.0%ni,100.0%id, 0.0%wa, 0.0%hi, 0.0%si, 0.0%st
Mem:
3858692k total, 1549480k used, 2309212k free,
25804k buffers
Swap:
0k total,
0k used,
0k free,
344280k cached
PID
28285
7767
7511
3379

USER
root
root
root
root

PR
30
30
30
20

NI VIRT RES SHR S %CPU %MEM
10 238m 17m 6128 S 0.0 0.5
10 50704 8732 1312 S 0.0 0.2
10 140m 7344 580 S 0.0 0.2
0 192m 4116 652 S 0.0 0.1

...

TIME+
1:39.42
1659:37
13:56.68
50:31.44

COMMAND
sssd_be
munin-asyncd
munin-node
snmpd

1.5G used - 106MB RSS - 345MB cache - 25MB buffer = ~1GB mystery
What is consuming a GB of memory?
Answer: kernel slab cache

→

1057MB
kernel slab cache
Additions and removals from the cache are
transparent to applications
Tunable through procs vfs_cache_pressure
Under memory pressure, memory is freed
automatically*

*usually
kernel slab cache
network buffers example
[jmiller@mem-mystery2 ~]$ slabtop -s c -o
Active / Total Objects (% used)
: 2953761 / 2971022 (99.4%)
Active / Total Slabs (% used)
: 413496 / 413496 (100.0%)
Active / Total Caches (% used)
: 106 / 188 (56.4%)
Active / Total Size (% used)
: 1633033.85K / 1635633.87K (99.8%)
Minimum / Average / Maximum Object : 0.02K / 0.55K / 4096.00K
OBJS ACTIVE USE OBJ SIZE SLABS OBJ/SLAB CACHE SIZE NAME
1270200 1270170 99%
1.00K 317550
4
1270200K size-1024
1269480 1269406 99%
0.25K 84632
15
338528K skbuff_head_cache
325857 325746 99%
0.06K
5523
59
22092K size-64

~1.5G used , this time for in-use network buffers (SO_RCVBUF)
Unreclaimable slab
[jmiller@mem-mystery2 ~]$ grep -A 2 ^Slab /proc/meminfo
Slab:
1663820 kB
SReclaimable:
9900 kB
SUnreclaim:
1653920 kB
Unreclaimable slab
[jmiller@mem-mystery2 ~]$ grep -A 2 ^Slab /proc/meminfo
Slab:
1663820 kB
SReclaimable:
9900 kB
SUnreclaim:
1653920 kB

Some slab objects can't be reclaimed, and memory pressure won't
automatically free the resources
Nitpick Accounting
Now we can account for all memory utilization:
[jmiller@postgres ~]$ ./memory_explain.sh
"free" buffers (MB) : 277
"free" caches (MB) : 4650
"slabtop" memory (MB) : 109.699
"ps" resident process memory (MB) : 366.508

"free" used memory (MB) : 5291
buffers+caches+slab+rss (MB) :
difference (MB) : -112.207

5403.207

But sometimes we're using more memory than we're using?!
And a cache complication...
top - 12:37:01 up 66 days, 23:38, 3 users, load average: 0.08, 0.02, 0.01
Tasks: 188 total,
1 running, 187 sleeping,
0 stopped,
0 zombie
Cpu(s): 0.3%us, 0.6%sy, 0.0%ni, 98.9%id, 0.1%wa, 0.0%hi, 0.1%si, 0.0%st
Mem:
7673860k total, 6895008k used,
778852k free,
300388k buffers
Swap:
0k total,
0k used,
0k free, 6179780k cached
PID USER
2189 postgres

PR
20

NI VIRT RES SHR S %CPU %MEM
0 5313m 2.8g 2.8g S 0.0 38.5

TIME+ COMMAND
7:09.20 postgres
And a cache complication...
top - 12:37:01 up 66 days, 23:38, 3 users, load average: 0.08, 0.02, 0.01
Tasks: 188 total,
1 running, 187 sleeping,
0 stopped,
0 zombie
Cpu(s): 0.3%us, 0.6%sy, 0.0%ni, 98.9%id, 0.1%wa, 0.0%hi, 0.1%si, 0.0%st
Mem:
7673860k total, 6895008k used,
778852k free,
300388k buffers
Swap:
0k total,
0k used,
0k free, 6179780k cached
PID USER
2189 postgres

PR
20

~7G used

NI VIRT RES SHR S %CPU %MEM
0 5313m 2.8g 2.8g S 0.0 38.5

TIME+ COMMAND
7:09.20 postgres
And a cache complication...
top - 12:37:01 up 66 days, 23:38, 3 users, load average: 0.08, 0.02, 0.01
Tasks: 188 total,
1 running, 187 sleeping,
0 stopped,
0 zombie
Cpu(s): 0.3%us, 0.6%sy, 0.0%ni, 98.9%id, 0.1%wa, 0.0%hi, 0.1%si, 0.0%st
Mem:
7673860k total, 6895008k used,
778852k free,
300388k buffers
Swap:
0k total,
0k used,
0k free, 6179780k cached
PID USER
2189 postgres

PR
20

~7G used ,

NI VIRT RES SHR S %CPU %MEM
0 5313m 2.8g 2.8g S 0.0 38.5

~6G cached ,

TIME+ COMMAND
7:09.20 postgres

so how can postgres have 2.8G resident?
Shared memory
●

Pages that multiple processes can access

●

Resident, shared, and in the page cache

●

Not subject to cache flush

●

shmget()

●

mmap()
Shared memory
shmget() example
Shared memory
shmget()
top - 21:08:20 up 147 days, 13:12, 9 users, load average: 0.03, 0.04, 0.00
Tasks: 150 total,
1 running, 149 sleeping,
0 stopped,
0 zombie
Cpu(s): 0.3%us, 1.5%sy, 0.4%ni, 96.7%id, 1.2%wa, 0.0%hi, 0.0%si, 0.0%st
Mem:
3858692k total, 1114512k used, 2744180k free,
412k buffers
Swap:
0k total,
0k used,
0k free,
931652k cached
PID USER
20599 jmiller

PR
20

NI
0

VIRT RES SHR S %CPU %MEM
884m 881m 881m S 0.0 23.4

TIME+ COMMAND
0:06.52 share

Shared memory is in the page cache!
Shared memory
shmget()
top - 21:21:29 up 147 days, 13:25, 9 users, load average: 0.34, 0.18, 0.06
Tasks: 151 total,
1 running, 150 sleeping,
0 stopped,
0 zombie
Cpu(s): 0.0%us, 0.6%sy, 0.4%ni, 98.9%id, 0.2%wa, 0.0%hi, 0.0%si, 0.0%st
Mem:
3858692k total, 1099756k used, 2758936k free,
844k buffers
Swap:
0k total,
0k used,
0k free,
914408k cached
PID
22058
22059
22060

USER
jmiller
jmiller
jmiller

PR
20
20
20

NI
0
0
0

VIRT RES SHR S %CPU %MEM
884m 881m 881m S 0.0 23.4

TIME+
0:05.00
0:03.35
0:03.40

COMMAND
share
share
share

3x processes, but same resource utilization
- about 1GB
Shared memory
shmget()
top - 21:21:29 up 147 days, 13:25, 9 users, load average: 0.34, 0.18, 0.06
Tasks: 151 total,
1 running, 150 sleeping,
0 stopped,
0 zombie
Cpu(s): 0.0%us, 0.6%sy, 0.4%ni, 98.9%id, 0.2%wa, 0.0%hi, 0.0%si, 0.0%st
Mem:
3858692k total, 1099756k used, 2758936k free,
844k buffers
Swap:
0k total,
0k used,
0k free,
914408k cached
PID
22058
22059
22060

USER
jmiller
jmiller
jmiller

PR
20
20
20

NI
0
0
0

VIRT RES SHR S %CPU %MEM
884m 881m 881m S 0.0 23.4

From /proc/meminfo:
Mapped:
Shmem:

TIME+
0:05.00
0:03.35
0:03.40

912156 kB
902068 kB

COMMAND
share
share
share
Shared memory
mmap() example
Shared memory
mmap()
top - 21:46:04 up 147 days, 13:50, 10 users, load average: 0.24, 0.21, 0.11
Tasks: 152 total,
1 running, 151 sleeping,
0 stopped,
0 zombie
Cpu(s): 0.3%us, 1.6%sy, 0.2%ni, 94.9%id, 3.0%wa, 0.0%hi, 0.0%si, 0.0%st
Mem:
3858692k total, 1648992k used, 2209700k free,
3048k buffers
Swap:
0k total,
0k used,
0k free, 1385724k cached
PID USER
24569 jmiller

PR
20

NI VIRT RES SHR S %CPU %MEM
0 2674m 1.3g 1.3g S 0.0 35.4

TIME+ COMMAND
0:03.04 mapped

From /proc/meminfo:
Mapped:
1380664 kB
Shmem:
212 kB
Shared memory
mmap()
top - 21:48:06 up 147 days, 13:52, 10 users, load average: 0.21, 0.18, 0.10
Tasks: 154 total,
1 running, 153 sleeping,
0 stopped,
0 zombie
Cpu(s): 0.2%us, 0.7%sy, 0.2%ni, 98.8%id, 0.0%wa, 0.0%hi, 0.2%si, 0.0%st
Mem:
3858692k total, 1659936k used, 2198756k free,
3248k buffers
Swap:
0k total,
0k used,
0k free, 1385732k cached
PID
24592
24586
24599

USER
jmiller
jmiller
jmiller

PR
20
20
20

NI VIRT RES SHR
0 2674m 1.3g 1.3g
0 2674m 1.3g 1.3g
0 2674m 1.3g 1.3g

S %CPU %MEM
S 0.0 35.4
S 0.0 35.4
S 0.0 35.4

TIME+
0:01.26
0:01.28
0:01.29

From /proc/meminfo:
Mapped:
1380664 kB
Shmem:
212 kB

COMMAND
mapped
mapped
mapped
Shared memory
mmap()
top - 21:48:06 up 147 days, 13:52, 10 users, load average: 0.21, 0.18, 0.10
Tasks: 154 total,
1 running, 153 sleeping,
0 stopped,
0 zombie
Cpu(s): 0.2%us, 0.7%sy, 0.2%ni, 98.8%id, 0.0%wa, 0.0%hi, 0.2%si, 0.0%st
Mem:
3858692k total, 1659936k used, 2198756k free,
3248k buffers
Swap:
0k total,
0k used,
0k free, 1385732k cached
PID
24592
24586
24599

USER
jmiller
jmiller
jmiller

PR
20
20
20

NI VIRT RES SHR
0 2674m 1.3g 1.3g
0 2674m 1.3g 1.3g
0 2674m 1.3g 1.3g

S %CPU %MEM
S 0.0 35.4
S 0.0 35.4
S 0.0 35.4

TIME+
0:01.26
0:01.28
0:01.29

COMMAND
mapped
mapped
mapped

Not counted as shared, but mapped

From /proc/meminfo:
Mapped:
1380664 kB
Shmem:
212 kB
Shared memory
mmap()
top - 21:48:06 up 147 days, 13:52, 10 users, load average: 0.21, 0.18, 0.10
Tasks: 154 total,
1 running, 153 sleeping,
0 stopped,
0 zombie
Cpu(s): 0.2%us, 0.7%sy, 0.2%ni, 98.8%id, 0.0%wa, 0.0%hi, 0.2%si, 0.0%st
Mem:
3858692k total, 1659936k used, 2198756k free,
3248k buffers
Swap:
0k total,
0k used,
0k free, 1385732k cached
PID
24592
24586
24599

USER
jmiller
jmiller
jmiller

PR
20
20
20

NI VIRT RES SHR
0 2674m 1.3g 1.3g
0 2674m 1.3g 1.3g
0 2674m 1.3g 1.3g

S %CPU %MEM
S 0.0 35.4
S 0.0 35.4
S 0.0 35.4

TIME+
0:01.26
0:01.28
0:01.29

105%!

From /proc/meminfo:
Mapped:
1380664 kB
Shmem:
212 kB

COMMAND
mapped
mapped
mapped
A subtle difference between
shmget() and mmap()...
Locked shared memory
●

Memory from shmget() must be explicitly
released by a shmctl(..., IPC_RMID, …) call

●

Process termination doesn't free the memory

●

Not the case for mmap()
Locked shared memory
shmget()
top - 11:36:35 up 151 days, 3:41, 3 users, load average: 0.09, 0.10, 0.03
Tasks: 129 total,
1 running, 128 sleeping,
0 stopped,
0 zombie
Cpu(s): 0.0%us, 0.4%sy, 0.4%ni, 99.3%id, 0.0%wa, 0.0%hi, 0.0%si, 0.0%st
Mem:
3858692k total, 1142248k used, 2716444k free,
3248k buffers
Swap:
0k total,
0k used,
0k free,
934360k cached
PID
24376
24399
7767

USER
root
root
root

PR
30
30
30

NI VIRT RES SHR S %CPU %MEM
10 253m 60m 3724 S 0.0 1.6
10 208m 15m 14m S 0.0 0.4
10 50704 8736 1312 S 1.0 0.2

TIME+
0:35.84
0:03.22
1886:38

COMMAND
chef-client
sssd_nss
munin-asyncd

~900M of cache
Locked shared memory
shmget()
top - 11:36:35 up 151 days, 3:41, 3 users, load average: 0.09, 0.10, 0.03
Tasks: 129 total,
1 running, 128 sleeping,
0 stopped,
0 zombie
Cpu(s): 0.0%us, 0.4%sy, 0.4%ni, 99.3%id, 0.0%wa, 0.0%hi, 0.0%si, 0.0%st
Mem:
3858692k total, 1142248k used, 2716444k free,
3248k buffers
Swap:
0k total,
0k used,
0k free,
934360k cached
PID
24376
24399
7767

USER
root
root
root

PR
30
30
30

NI VIRT RES SHR S %CPU %MEM
10 253m 60m 3724 S 0.0 1.6
10 208m 15m 14m S 0.0 0.4
10 50704 8736 1312 S 1.0 0.2

TIME+
0:35.84
0:03.22
1886:38

'echo 3 > /proc/sys/vm/drop_caches'
– no impact on value of cache,
so it's not filesystem caching

COMMAND
chef-client
sssd_nss
munin-asyncd
Locked shared memory
shmget()
top - 11:36:35 up 151 days, 3:41, 3 users, load average: 0.09, 0.10, 0.03
Tasks: 129 total,
1 running, 128 sleeping,
0 stopped,
0 zombie
Cpu(s): 0.0%us, 0.4%sy, 0.4%ni, 99.3%id, 0.0%wa, 0.0%hi, 0.0%si, 0.0%st
Mem:
3858692k total, 1142248k used, 2716444k free,
3248k buffers
Swap:
0k total,
0k used,
0k free,
934360k cached
PID
24376
24399
7767

USER
root
root
root

PR
30
30
30

NI VIRT RES SHR S %CPU %MEM
10 253m 60m 3724 S 0.0 1.6
10 208m 15m 14m S 0.0 0.4
10 50704 8736 1312 S 1.0 0.2

TIME+
0:35.84
0:03.22
1886:38

COMMAND
chef-client
sssd_nss
munin-asyncd

Processes consuming way less than ~900M
Locked shared memory
shmget()
top - 11:36:35 up 151 days, 3:41, 3 users, load average: 0.09, 0.10, 0.03
Tasks: 129 total,
1 running, 128 sleeping,
0 stopped,
0 zombie
Cpu(s): 0.0%us, 0.4%sy, 0.4%ni, 99.3%id, 0.0%wa, 0.0%hi, 0.0%si, 0.0%st
Mem:
3858692k total, 1142248k used, 2716444k free,
3248k buffers
Swap:
0k total,
0k used,
0k free,
934360k cached
PID
24376
24399
7767

USER
root
root
root

PR
30
30
30

NI VIRT RES SHR S %CPU %MEM
10 253m 60m 3724 S 0.0 1.6
10 208m 15m 14m S 0.0 0.4
10 50704 8736 1312 S 1.0 0.2

From /proc/meminfo:
Mapped:
Shmem:

TIME+
0:35.84
0:03.22
1886:38

27796 kB
902044 kB

COMMAND
chef-client
sssd_nss
munin-asyncd
Locked shared memory
shmget()
top - 11:36:35 up 151 days, 3:41, 3 users, load average: 0.09, 0.10, 0.03
Tasks: 129 total,
1 running, 128 sleeping,
0 stopped,
0 zombie
Cpu(s): 0.0%us, 0.4%sy, 0.4%ni, 99.3%id, 0.0%wa, 0.0%hi, 0.0%si, 0.0%st
Mem:
3858692k total, 1142248k used, 2716444k free,
3248k buffers
Swap:
0k total,
0k used,
0k free,
934360k cached
PID
24376
24399
7767

USER
root
root
root

PR
30
30
30

NI VIRT RES SHR S %CPU %MEM
10 253m 60m 3724 S 0.0 1.6
10 208m 15m 14m S 0.0 0.4
10 50704 8736 1312 S 1.0 0.2

From /proc/meminfo:
Mapped:
Shmem:

TIME+
0:35.84
0:03.22
1886:38

COMMAND
chef-client
sssd_nss
munin-asyncd

Un-attached shared mem segment(s)

27796 kB
902044 kB
Locked shared memory
shmget()
top - 11:36:35 up 151 days, 3:41, 3 users, load average: 0.09, 0.10, 0.03
Tasks: 129 total,
1 running, 128 sleeping,
0 stopped,
0 zombie
Cpu(s): 0.0%us, 0.4%sy, 0.4%ni, 99.3%id, 0.0%wa, 0.0%hi, 0.0%si, 0.0%st
Mem:
3858692k total, 1142248k used, 2716444k free,
3248k buffers
Swap:
0k total,
0k used,
0k free,
934360k cached
PID
24376
24399
7767

USER
root
root
root

PR
30
30
30

NI VIRT RES SHR S %CPU %MEM
10 253m 60m 3724 S 0.0 1.6
10 208m 15m 14m S 0.0 0.4
10 50704 8736 1312 S 1.0 0.2

From /proc/meminfo:
Mapped:
Shmem:

TIME+
0:35.84
0:03.22
1886:38

COMMAND
chef-client
sssd_nss
munin-asyncd

Observable through 'ipcs -a'

27796 kB
902044 kB
Accounting for shared memory
is difficult
●

●

●

●

top reports memory that can be shared – but
might not be
ps doesn't account for shared
pmap splits mapped vs shared, reports
allocated vs used
mmap'd files are shared, until modified → at
which point they're private
Linux filesystem cache
What's inside?
Do you need it?

/

?
otd
m
tc/
e

?
Impo
rtan

t app

data
?

de
trit
us

?
Linux filesystem cache
We know shared memory is in the page cache,
which we can largely understand through proc
From /proc/meminfo:
Cached:
...
Mapped:
Shmem:

367924 kB
31752 kB
196 kB
Linux filesystem cache
We know shared memory is in the page cache,
which we can largely understand through proc
From /proc/meminfo:
Cached:
...
Mapped:
Shmem:

367924 kB
31752 kB
196 kB

But what about the rest of what's in the cache?
Linux filesystem cache
Bad news:
We can't just ask “What's in the cache?”
Good news:
We can ask “Is this file in the cache?”
linux-ftools
https://code.google.com/p/linux-ftools/
[jmiller@cache ~]$ linux-fincore /tmp/big
filename
size
cached_pages
---------------------/tmp/big 4,194,304
0
--total cached size: 0

cached_size
----------0

cached_perc
----------0.00
linux-ftools
https://code.google.com/p/linux-ftools/
[jmiller@cache ~]$ linux-fincore /tmp/big
filename
size
cached_pages
---------------------/tmp/big 4,194,304
0
--total cached size: 0

cached_size
----------0

Zero % cached

cached_perc
----------0.00
linux-ftools
https://code.google.com/p/linux-ftools/
[jmiller@cache ~]$ linux-fincore /tmp/big
filename
size
cached_pages
---------------------/tmp/big 4,194,304
0
--total cached size: 0

cached_size
----------0

cached_perc
----------0.00

[jmiller@cache ~]$ dd if=/tmp/big of=/dev/null bs=1k count=50

Read ~5%
linux-ftools
https://code.google.com/p/linux-ftools/
[jmiller@cache ~]$ linux-fincore /tmp/big
filename
size
cached_pages
---------------------/tmp/big 4,194,304
0
--total cached size: 0

cached_size
----------0

cached_perc
----------0.00

[jmiller@cache ~]$ dd if=/tmp/big of=/dev/null bs=1k count=50
[jmiller@cache ~]$ linux-fincore /tmp/big
filename
size
cached_pages
---------------------/tmp/big 4,194,304
60
--total cached size: 245,760

cached_size
----------245,760

cached_perc
----------5.86

~5% cached
system tap – cache hits
https://sourceware.org/systemtap/wiki/WSCacheHitRate
[jmiller@stap ~]$ sudo stap /tmp/cachehit.stap
Cache Reads (KB)
508236
0
0
686012
468788
17000
0
0

Disk Reads (KB)
24056
43600
59512
30624
0
63256
67232
19992

Miss Rate
4.51%
100.00%
100.00%
4.27%
0.00%
78.81%
100.00%
100.00%

Hit Rate
95.48%
0.00%
0.00%
95.72%
100.00%
21.18%
0.00%
0.00%

Track reads against VFS, reads against disk, then infer cache hits
system tap – cache hits
[jmiller@stap ~]$ sudo stap /tmp/cachehit.stap
Cache Reads (KB)
508236
0
0
686012
468788
17000
0
0

Disk Reads (KB)
24056
43600
59512
30624
0
63256
67232
19992

Miss Rate
4.51%
100.00%
100.00%
4.27%
0.00%
78.81%
100.00%
100.00%

Hit Rate
95.48%
0.00%
0.00%
95.72%
100.00%
21.18%
0.00%
0.00%

But – have to account for LVM, device mapper, remote disk
devices (NFS, iSCSI ), ...
Easy mode - drop_caches
echo 1 | sudo tee /proc/sys/vm/drop_caches

●
●

●

frees clean cache pages immediately
frequently accessed files should be re-cached
quickly
performance impact while caches repopulated
Filesystem cache contents
●

No ability to easily see full contents of cache

●

mincore() - but have to check every file

●

Hard - system tap / dtrace inference

●

Easy – drop_caches and observe impact
Memory: The Big Picture
Virtual memory

Swap

Physical memory
Physical Memory
Physical Memory

Free
Physical Memory
Used

Free
Physical Memory
Used

Private
application
memory

Free
Physical Memory
Used
Kernel caches (SLAB)

Private
application
memory

Free
Physical Memory
Used
Kernel caches (SLAB)
Buffer cache (block IO)
Private
application
memory

Free
Physical Memory
Used
Kernel caches (SLAB)
Buffer cache (block IO)
Private
application
memory

Free

Page cache
Physical Memory
Used
Kernel caches (SLAB)
Buffer cache (block IO)
Private
application
memory

Page cache

Filesystem cache

Free
Physical Memory
Used
Kernel caches (SLAB)
Buffer cache (block IO)
Private
application
memory

Page cache

Shared memory
Filesystem cache

Free
Physical Memory
Used
Kernel caches (SLAB)
Buffer cache (block IO)
Private
application
memory

Page cache

Shared memory
Filesystem cache

Free
Thanks!
Send feedback to me:
joshuamiller01 on gmail

Más contenido relacionado

Destacado (9)

PhoneGap 通信原理和插件系统
PhoneGap 通信原理和插件系统PhoneGap 通信原理和插件系统
PhoneGap 通信原理和插件系统
 
Android 平台 HTML5 应用开发
Android 平台 HTML5 应用开发Android 平台 HTML5 应用开发
Android 平台 HTML5 应用开发
 
Automatic Reference Counting
Automatic Reference CountingAutomatic Reference Counting
Automatic Reference Counting
 
03 Managing Memory with ARC
03 Managing Memory with ARC03 Managing Memory with ARC
03 Managing Memory with ARC
 
PhoneGap 2.0 开发
PhoneGap 2.0 开发PhoneGap 2.0 开发
PhoneGap 2.0 开发
 
Advanced Dynamic Analysis for Leak Detection (Apple Internship 2008)
Advanced Dynamic Analysis for Leak Detection (Apple Internship 2008)Advanced Dynamic Analysis for Leak Detection (Apple Internship 2008)
Advanced Dynamic Analysis for Leak Detection (Apple Internship 2008)
 
Storage
StorageStorage
Storage
 
Deviceaccess
DeviceaccessDeviceaccess
Deviceaccess
 
Html5 history
Html5 historyHtml5 history
Html5 history
 

Similar a Where'd all my memory go? SCALE 12x SCALE12x

Phd2013 lyamin Высокий пакетрейт на x86-64, берем планку 14.88Mpps
Phd2013 lyamin  Высокий пакетрейт на  x86-64, берем планку 14.88MppsPhd2013 lyamin  Высокий пакетрейт на  x86-64, берем планку 14.88Mpps
Phd2013 lyamin Высокий пакетрейт на x86-64, берем планку 14.88Mpps
Alexander Lyamin
 
Александр Лямин. HOWTO. Высокий пакетрейт на x86-64: берем планку в 14,88 Mpps
Александр Лямин. HOWTO. Высокий пакетрейт на x86-64: берем планку в 14,88 MppsАлександр Лямин. HOWTO. Высокий пакетрейт на x86-64: берем планку в 14,88 Mpps
Александр Лямин. HOWTO. Высокий пакетрейт на x86-64: берем планку в 14,88 Mpps
Positive Hack Days
 
Prstat and Processes Oracle
Prstat and Processes OraclePrstat and Processes Oracle
Prstat and Processes Oracle
Anar Godjaev
 
OSNoise Tracer: Who Is Stealing My CPU Time?
OSNoise Tracer: Who Is Stealing My CPU Time?OSNoise Tracer: Who Is Stealing My CPU Time?
OSNoise Tracer: Who Is Stealing My CPU Time?
ScyllaDB
 

Similar a Where'd all my memory go? SCALE 12x SCALE12x (20)

Phd2013 lyamin
Phd2013 lyaminPhd2013 lyamin
Phd2013 lyamin
 
Phd2013 lyamin Высокий пакетрейт на x86-64, берем планку 14.88Mpps
Phd2013 lyamin  Высокий пакетрейт на  x86-64, берем планку 14.88MppsPhd2013 lyamin  Высокий пакетрейт на  x86-64, берем планку 14.88Mpps
Phd2013 lyamin Высокий пакетрейт на x86-64, берем планку 14.88Mpps
 
Александр Лямин. HOWTO. Высокий пакетрейт на x86-64: берем планку в 14,88 Mpps
Александр Лямин. HOWTO. Высокий пакетрейт на x86-64: берем планку в 14,88 MppsАлександр Лямин. HOWTO. Высокий пакетрейт на x86-64: берем планку в 14,88 Mpps
Александр Лямин. HOWTO. Высокий пакетрейт на x86-64: берем планку в 14,88 Mpps
 
Managing PostgreSQL with PgCenter
Managing PostgreSQL with PgCenterManaging PostgreSQL with PgCenter
Managing PostgreSQL with PgCenter
 
Broken Performance Tools
Broken Performance ToolsBroken Performance Tools
Broken Performance Tools
 
YOW2020 Linux Systems Performance
YOW2020 Linux Systems PerformanceYOW2020 Linux Systems Performance
YOW2020 Linux Systems Performance
 
200.1,2-Capacity Planning
200.1,2-Capacity Planning200.1,2-Capacity Planning
200.1,2-Capacity Planning
 
Cpu utilization
Cpu utilizationCpu utilization
Cpu utilization
 
Performance tuning
Performance tuningPerformance tuning
Performance tuning
 
How deep is your buffer – Demystifying buffers and application performance
How deep is your buffer – Demystifying buffers and application performanceHow deep is your buffer – Demystifying buffers and application performance
How deep is your buffer – Demystifying buffers and application performance
 
Troubleshooting PostgreSQL with pgCenter
Troubleshooting PostgreSQL with pgCenterTroubleshooting PostgreSQL with pgCenter
Troubleshooting PostgreSQL with pgCenter
 
Linux performance
Linux performanceLinux performance
Linux performance
 
Cassandra Day SV 2014: Basic Operations with Apache Cassandra
Cassandra Day SV 2014: Basic Operations with Apache CassandraCassandra Day SV 2014: Basic Operations with Apache Cassandra
Cassandra Day SV 2014: Basic Operations with Apache Cassandra
 
Linux Performance Tools
Linux Performance ToolsLinux Performance Tools
Linux Performance Tools
 
Prstat and Processes Oracle
Prstat and Processes OraclePrstat and Processes Oracle
Prstat and Processes Oracle
 
AMDGPU ROCm Tensorflow 1.8 install memo (not support Ubuntu 1804)
AMDGPU ROCm Tensorflow 1.8 install memo (not support Ubuntu 1804)AMDGPU ROCm Tensorflow 1.8 install memo (not support Ubuntu 1804)
AMDGPU ROCm Tensorflow 1.8 install memo (not support Ubuntu 1804)
 
Михаил Епихин — Бутылочное горлышко. как найти узкие места сервиса и увеличит...
Михаил Епихин — Бутылочное горлышко. как найти узкие места сервиса и увеличит...Михаил Епихин — Бутылочное горлышко. как найти узкие места сервиса и увеличит...
Михаил Епихин — Бутылочное горлышко. как найти узкие места сервиса и увеличит...
 
OSNoise Tracer: Who Is Stealing My CPU Time?
OSNoise Tracer: Who Is Stealing My CPU Time?OSNoise Tracer: Who Is Stealing My CPU Time?
OSNoise Tracer: Who Is Stealing My CPU Time?
 
Linux Systems Performance 2016
Linux Systems Performance 2016Linux Systems Performance 2016
Linux Systems Performance 2016
 
Analyzing OS X Systems Performance with the USE Method
Analyzing OS X Systems Performance with the USE MethodAnalyzing OS X Systems Performance with the USE Method
Analyzing OS X Systems Performance with the USE Method
 

Último

Artificial Intelligence: Facts and Myths
Artificial Intelligence: Facts and MythsArtificial Intelligence: Facts and Myths
Artificial Intelligence: Facts and Myths
Joaquim Jorge
 

Último (20)

TrustArc Webinar - Unlock the Power of AI-Driven Data Discovery
TrustArc Webinar - Unlock the Power of AI-Driven Data DiscoveryTrustArc Webinar - Unlock the Power of AI-Driven Data Discovery
TrustArc Webinar - Unlock the Power of AI-Driven Data Discovery
 
Partners Life - Insurer Innovation Award 2024
Partners Life - Insurer Innovation Award 2024Partners Life - Insurer Innovation Award 2024
Partners Life - Insurer Innovation Award 2024
 
From Event to Action: Accelerate Your Decision Making with Real-Time Automation
From Event to Action: Accelerate Your Decision Making with Real-Time AutomationFrom Event to Action: Accelerate Your Decision Making with Real-Time Automation
From Event to Action: Accelerate Your Decision Making with Real-Time Automation
 
Understanding Discord NSFW Servers A Guide for Responsible Users.pdf
Understanding Discord NSFW Servers A Guide for Responsible Users.pdfUnderstanding Discord NSFW Servers A Guide for Responsible Users.pdf
Understanding Discord NSFW Servers A Guide for Responsible Users.pdf
 
Real Time Object Detection Using Open CV
Real Time Object Detection Using Open CVReal Time Object Detection Using Open CV
Real Time Object Detection Using Open CV
 
2024: Domino Containers - The Next Step. News from the Domino Container commu...
2024: Domino Containers - The Next Step. News from the Domino Container commu...2024: Domino Containers - The Next Step. News from the Domino Container commu...
2024: Domino Containers - The Next Step. News from the Domino Container commu...
 
Apidays New York 2024 - Scaling API-first by Ian Reasor and Radu Cotescu, Adobe
Apidays New York 2024 - Scaling API-first by Ian Reasor and Radu Cotescu, AdobeApidays New York 2024 - Scaling API-first by Ian Reasor and Radu Cotescu, Adobe
Apidays New York 2024 - Scaling API-first by Ian Reasor and Radu Cotescu, Adobe
 
A Domino Admins Adventures (Engage 2024)
A Domino Admins Adventures (Engage 2024)A Domino Admins Adventures (Engage 2024)
A Domino Admins Adventures (Engage 2024)
 
Strategies for Landing an Oracle DBA Job as a Fresher
Strategies for Landing an Oracle DBA Job as a FresherStrategies for Landing an Oracle DBA Job as a Fresher
Strategies for Landing an Oracle DBA Job as a Fresher
 
Tech Trends Report 2024 Future Today Institute.pdf
Tech Trends Report 2024 Future Today Institute.pdfTech Trends Report 2024 Future Today Institute.pdf
Tech Trends Report 2024 Future Today Institute.pdf
 
04-2024-HHUG-Sales-and-Marketing-Alignment.pptx
04-2024-HHUG-Sales-and-Marketing-Alignment.pptx04-2024-HHUG-Sales-and-Marketing-Alignment.pptx
04-2024-HHUG-Sales-and-Marketing-Alignment.pptx
 
Boost PC performance: How more available memory can improve productivity
Boost PC performance: How more available memory can improve productivityBoost PC performance: How more available memory can improve productivity
Boost PC performance: How more available memory can improve productivity
 
Workshop - Best of Both Worlds_ Combine KG and Vector search for enhanced R...
Workshop - Best of Both Worlds_ Combine  KG and Vector search for  enhanced R...Workshop - Best of Both Worlds_ Combine  KG and Vector search for  enhanced R...
Workshop - Best of Both Worlds_ Combine KG and Vector search for enhanced R...
 
[2024]Digital Global Overview Report 2024 Meltwater.pdf
[2024]Digital Global Overview Report 2024 Meltwater.pdf[2024]Digital Global Overview Report 2024 Meltwater.pdf
[2024]Digital Global Overview Report 2024 Meltwater.pdf
 
Automating Google Workspace (GWS) & more with Apps Script
Automating Google Workspace (GWS) & more with Apps ScriptAutomating Google Workspace (GWS) & more with Apps Script
Automating Google Workspace (GWS) & more with Apps Script
 
Artificial Intelligence: Facts and Myths
Artificial Intelligence: Facts and MythsArtificial Intelligence: Facts and Myths
Artificial Intelligence: Facts and Myths
 
Strategies for Unlocking Knowledge Management in Microsoft 365 in the Copilot...
Strategies for Unlocking Knowledge Management in Microsoft 365 in the Copilot...Strategies for Unlocking Knowledge Management in Microsoft 365 in the Copilot...
Strategies for Unlocking Knowledge Management in Microsoft 365 in the Copilot...
 
How to Troubleshoot Apps for the Modern Connected Worker
How to Troubleshoot Apps for the Modern Connected WorkerHow to Troubleshoot Apps for the Modern Connected Worker
How to Troubleshoot Apps for the Modern Connected Worker
 
The 7 Things I Know About Cyber Security After 25 Years | April 2024
The 7 Things I Know About Cyber Security After 25 Years | April 2024The 7 Things I Know About Cyber Security After 25 Years | April 2024
The 7 Things I Know About Cyber Security After 25 Years | April 2024
 
Finology Group – Insurtech Innovation Award 2024
Finology Group – Insurtech Innovation Award 2024Finology Group – Insurtech Innovation Award 2024
Finology Group – Insurtech Innovation Award 2024
 

Where'd all my memory go? SCALE 12x SCALE12x

  • 1. Where'd all my memory go? Joshua Miller SCALE 12x – 22 FEB 2014
  • 2. The Incomplete Story Computers have memory, which they use to run applications.
  • 4. Topics ● Memory basics – Paging, swapping, caches, buffers ● Overcommit ● Filesystem cache ● Kernel caches and buffers ● Shared memory
  • 5. top is awesome top - 15:57:33 up 131 days, 8:02, 3 users, load average: 0.00, 0.00, 0.00 Tasks: 129 total, 1 running, 128 sleeping, 0 stopped, 0 zombie Cpu(s): 0.2%us, 0.3%sy, 0.3%ni, 99.0%id, 0.2%wa, 0.0%hi, 0.0%si, 0.0%st Mem: 3858692k total, 3149296k used, 709396k free, 261556k buffers Swap: 0k total, 0k used, 0k free, 1081832k cached PID 8131 8153 8154 7767 7511 3379 7026 USER root root root root root root root PR 30 30 30 30 30 20 20 NI VIRT RES SHR 10 243m 50m 3748 10 238m 19m 7840 10 208m 15m 14m 10 50704 8748 1328 10 140m 7344 580 0 192m 4116 652 0 113m 3992 3032 S %CPU %MEM S 0.0 1.3 S 0.0 0.5 S 0.0 0.4 S 1.0 0.2 S 0.0 0.2 S 0.0 0.1 S 0.0 0.1 TIME+ 0:51.97 1:35.48 0:08.03 1559:39 13:06.29 48:20.28 0:00.02 COMMAND chef-client sssd_be sssd_nss munin-asyncd munin-node snmpd sshd
  • 6. top is awesome top - 15:57:33 up 131 days, 8:02, 3 users, load average: 0.00, 0.00, 0.00 Tasks: 129 total, 1 running, 128 sleeping, 0 stopped, 0 zombie Cpu(s): 0.2%us, 0.3%sy, 0.3%ni, 99.0%id, 0.2%wa, 0.0%hi, 0.0%si, 0.0%st Mem: 3858692k total, 3149296k used, 709396k free, 261556k buffers Swap: 0k total, 0k used, 0k free, 1081832k cached PID 8131 8153 8154 7767 7511 3379 7026 USER root root root root root root root ● ● PR 30 30 30 30 30 20 20 NI VIRT RES SHR 10 243m 50m 3748 10 238m 19m 7840 10 208m 15m 14m 10 50704 8748 1328 10 140m 7344 580 0 192m 4116 652 0 113m 3992 3032 S %CPU %MEM S 0.0 1.3 S 0.0 0.5 S 0.0 0.4 S 1.0 0.2 S 0.0 0.2 S 0.0 0.1 S 0.0 0.1 Physical memory used and free Swap used and free TIME+ 0:51.97 1:35.48 0:08.03 1559:39 13:06.29 48:20.28 0:00.02 COMMAND chef-client sssd_be sssd_nss munin-asyncd munin-node snmpd sshd
  • 7. top is awesome top - 15:57:33 up 131 days, 8:02, 3 users, load average: 0.00, 0.00, 0.00 Tasks: 129 total, 1 running, 128 sleeping, 0 stopped, 0 zombie Cpu(s): 0.2%us, 0.3%sy, 0.3%ni, 99.0%id, 0.2%wa, 0.0%hi, 0.0%si, 0.0%st Mem: 3858692k total, 3149296k used, 709396k free, 261556k buffers Swap: 0k total, 0k used, 0k free, 1081832k cached PID 8131 8153 8154 7767 7511 3379 7026 USER root root root root root root root PR 30 30 30 30 30 20 20 NI VIRT RES SHR 10 243m 50m 3748 10 238m 19m 7840 10 208m 15m 14m 10 50704 8748 1328 10 140m 7344 580 0 192m 4116 652 0 113m 3992 3032 S %CPU %MEM S 0.0 1.3 S 0.0 0.5 S 0.0 0.4 S 1.0 0.2 S 0.0 0.2 S 0.0 0.1 S 0.0 0.1 TIME+ 0:51.97 1:35.48 0:08.03 1559:39 13:06.29 48:20.28 0:00.02 COMMAND chef-client sssd_be sssd_nss munin-asyncd munin-node snmpd sshd Percentage of RES/total memory Per-process breakdown of virtual, resident, and shared memory
  • 8. top is awesome top - 15:57:33 up 131 days, 8:02, 3 users, load average: 0.00, 0.00, 0.00 Tasks: 129 total, 1 running, 128 sleeping, 0 stopped, 0 zombie Cpu(s): 0.2%us, 0.3%sy, 0.3%ni, 99.0%id, 0.2%wa, 0.0%hi, 0.0%si, 0.0%st Mem: 3858692k total, 3149296k used, 709396k free, 261556k buffers Swap: 0k total, 0k used, 0k free, 1081832k cached PID 8131 8153 8154 7767 7511 3379 7026 USER root root root root root root root PR 30 30 30 30 30 20 20 NI VIRT RES SHR 10 243m 50m 3748 10 238m 19m 7840 10 208m 15m 14m 10 50704 8748 1328 10 140m 7344 580 0 192m 4116 652 0 113m 3992 3032 S %CPU %MEM S 0.0 1.3 S 0.0 0.5 S 0.0 0.4 S 1.0 0.2 S 0.0 0.2 S 0.0 0.1 S 0.0 0.1 TIME+ 0:51.97 1:35.48 0:08.03 1559:39 13:06.29 48:20.28 0:00.02 COMMAND chef-client sssd_be sssd_nss munin-asyncd munin-node snmpd sshd Kernel buffers and caches (no association with swap, despite being on the same row)
  • 9. /proc/meminfo [jmiller@meminfo]$ cat /proc/meminfo MemTotal: 3858692 kB MemFree: 3445624 kB Buffers: 19092 kB Cached: 128288 kB SwapCached: 0 kB ...
  • 10. /proc/meminfo [jmiller@meminfo]$ cat /proc/meminfo MemTotal: 3858692 kB MemFree: 3445624 kB Buffers: 19092 kB Cached: 128288 kB SwapCached: 0 kB ... Many useful values which we'll refer to throughout the presentation
  • 11. Overcommit top - 14:57:44 up 137 days, 7:02, 6 users, load average: 0.03, 0.02, 0.00 Tasks: 141 total, 1 running, 140 sleeping, 0 stopped, 0 zombie Cpu(s): 0.0%us, 0.2%sy, 0.0%ni, 99.8%id, 0.0%wa, 0.0%hi, 0.0%si, 0.0%st Mem: 3858692k total, 3075728k used, 782964k free, 283648k buffers Swap: 0k total, 0k used, 0k free, 1073320k cached PID USER 22385 jmiller PR 20 NI VIRT 0 18.6g RES 572 SHR S %CPU %MEM 308 S 0.0 0.0 TIME+ COMMAND 0:00.00 bloat
  • 12. Overcommit top - 14:57:44 up 137 days, 7:02, 6 users, load average: 0.03, 0.02, 0.00 Tasks: 141 total, 1 running, 140 sleeping, 0 stopped, 0 zombie Cpu(s): 0.0%us, 0.2%sy, 0.0%ni, 99.8%id, 0.0%wa, 0.0%hi, 0.0%si, 0.0%st Mem: 3858692k total, 3075728k used, 782964k free, 283648k buffers Swap: 0k total, 0k used, 0k free, 1073320k cached PID USER 22385 jmiller PR 20 NI VIRT 0 18.6g RES 572 SHR S %CPU %MEM 308 S 0.0 0.0 TIME+ COMMAND 0:00.00 bloat 4G of physical memory and no swap , so how can “bloat” have 18.6g virtual?
  • 13. Overcommit top - 14:57:44 up 137 days, 7:02, 6 users, load average: 0.03, 0.02, 0.00 Tasks: 141 total, 1 running, 140 sleeping, 0 stopped, 0 zombie Cpu(s): 0.0%us, 0.2%sy, 0.0%ni, 99.8%id, 0.0%wa, 0.0%hi, 0.0%si, 0.0%st Mem: 3858692k total, 3075728k used, 782964k free, 283648k buffers Swap: 0k total, 0k used, 0k free, 1073320k cached PID USER 22385 jmiller PR 20 NI VIRT 0 18.6g RES 572 SHR S %CPU %MEM 308 S 0.0 0.0 TIME+ COMMAND 0:00.00 bloat 4G of physical memory and no swap , so how can “bloat” have 18.6g virtual? ● ● Virtual memory is not “physical memory plus swap” A process can request huge amounts of memory, but it isn't mapped to “real memory” until actually referenced
  • 14. Linux filesystem caching Free memory is used to cache filesystem contents. Over time systems can appear to be out of memory because all of the free memory is used for cache.
  • 15. top is awesome top - 15:57:33 up 131 days, 8:02, 3 users, load average: 0.00, 0.00, 0.00 Tasks: 129 total, 1 running, 128 sleeping, 0 stopped, 0 zombie Cpu(s): 0.2%us, 0.3%sy, 0.3%ni, 99.0%id, 0.2%wa, 0.0%hi, 0.0%si, 0.0%st Mem: 3858692k total, 3149296k used, 709396k free, 261556k buffers Swap: 0k total, 0k used, 0k free, 1081832k cached PID 8131 8153 8154 7767 7511 3379 7026 USER root root root root root root root PR 30 30 30 30 30 20 20 NI VIRT RES SHR 10 243m 50m 3748 10 238m 19m 7840 10 208m 15m 14m 10 50704 8748 1328 10 140m 7344 580 0 192m 4116 652 0 113m 3992 3032 S %CPU %MEM S 0.0 1.3 S 0.0 0.5 S 0.0 0.4 S 1.0 0.2 S 0.0 0.2 S 0.0 0.1 S 0.0 0.1 TIME+ 0:51.97 1:35.48 0:08.03 1559:39 13:06.29 48:20.28 0:00.02 COMMAND chef-client sssd_be sssd_nss munin-asyncd munin-node snmpd sshd About 25% of this system's memory is from page cache
  • 16. Linux filesystem caching Additions and removals from the cache are transparent to applications Tunable through swappiness Can be dropped - echo 1 > /proc/sys/vm/drop_caches Under memory pressure, memory is freed automatically* *usually
  • 17. Where'd my memory go? top - 16:40:53 up 137 days, 8:45, 5 users, load average: 0.88, 0.82, 0.46 Tasks: 138 total, 1 running, 137 sleeping, 0 stopped, 0 zombie Cpu0 : 0.0%us, 0.0%sy, 0.0%ni,100.0%id, 0.0%wa, 0.0%hi, 0.0%si, 0.0%st Cpu1 : 0.0%us, 0.0%sy, 0.0%ni,100.0%id, 0.0%wa, 0.0%hi, 0.0%si, 0.0%st Mem: 3858692k total, 1549480k used, 2309212k free, 25804k buffers Swap: 0k total, 0k used, 0k free, 344280k cached PID 28285 7767 7511 3379 USER root root root root PR 30 30 30 20 NI VIRT RES SHR S %CPU %MEM 10 238m 17m 6128 S 0.0 0.5 10 50704 8732 1312 S 0.0 0.2 10 140m 7344 580 S 0.0 0.2 0 192m 4116 652 S 0.0 0.1 TIME+ 1:39.42 1659:37 13:56.68 50:31.44 COMMAND sssd_be munin-asyncd munin-node snmpd
  • 18. Where'd my memory go? top - 16:40:53 up 137 days, 8:45, 5 users, load average: 0.88, 0.82, 0.46 Tasks: 138 total, 1 running, 137 sleeping, 0 stopped, 0 zombie Cpu0 : 0.0%us, 0.0%sy, 0.0%ni,100.0%id, 0.0%wa, 0.0%hi, 0.0%si, 0.0%st Cpu1 : 0.0%us, 0.0%sy, 0.0%ni,100.0%id, 0.0%wa, 0.0%hi, 0.0%si, 0.0%st Mem: 3858692k total, 1549480k used, 2309212k free, 25804k buffers Swap: 0k total, 0k used, 0k free, 344280k cached PID 28285 7767 7511 3379 USER root root root root 1.5G used PR 30 30 30 20 NI VIRT RES SHR S %CPU %MEM 10 238m 17m 6128 S 0.0 0.5 10 50704 8732 1312 S 0.0 0.2 10 140m 7344 580 S 0.0 0.2 0 192m 4116 652 S 0.0 0.1 TIME+ 1:39.42 1659:37 13:56.68 50:31.44 COMMAND sssd_be munin-asyncd munin-node snmpd
  • 19. Where'd my memory go? top - 16:40:53 up 137 days, 8:45, 5 users, load average: 0.88, 0.82, 0.46 Tasks: 138 total, 1 running, 137 sleeping, 0 stopped, 0 zombie Cpu0 : 0.0%us, 0.0%sy, 0.0%ni,100.0%id, 0.0%wa, 0.0%hi, 0.0%si, 0.0%st Cpu1 : 0.0%us, 0.0%sy, 0.0%ni,100.0%id, 0.0%wa, 0.0%hi, 0.0%si, 0.0%st Mem: 3858692k total, 1549480k used, 2309212k free, 25804k buffers Swap: 0k total, 0k used, 0k free, 344280k cached PID 28285 7767 7511 3379 USER root root root root PR 30 30 30 20 NI VIRT RES SHR S %CPU %MEM 10 238m 17m 6128 S 0.0 0.5 10 50704 8732 1312 S 0.0 0.2 10 140m 7344 580 S 0.0 0.2 0 192m 4116 652 S 0.0 0.1 1.5G used - 106MB RSS ... TIME+ 1:39.42 1659:37 13:56.68 50:31.44 COMMAND sssd_be munin-asyncd munin-node snmpd
  • 20. Where'd my memory go? top - 16:40:53 up 137 days, 8:45, 5 users, load average: 0.88, 0.82, 0.46 Tasks: 138 total, 1 running, 137 sleeping, 0 stopped, 0 zombie Cpu0 : 0.0%us, 0.0%sy, 0.0%ni,100.0%id, 0.0%wa, 0.0%hi, 0.0%si, 0.0%st Cpu1 : 0.0%us, 0.0%sy, 0.0%ni,100.0%id, 0.0%wa, 0.0%hi, 0.0%si, 0.0%st Mem: 3858692k total, 1549480k used, 2309212k free, 25804k buffers Swap: 0k total, 0k used, 0k free, 344280k cached PID 28285 7767 7511 3379 USER root root root root PR 30 30 30 20 NI VIRT RES SHR S %CPU %MEM 10 238m 17m 6128 S 0.0 0.5 10 50704 8732 1312 S 0.0 0.2 10 140m 7344 580 S 0.0 0.2 0 192m 4116 652 S 0.0 0.1 ... TIME+ 1:39.42 1659:37 13:56.68 50:31.44 1.5G used - 106MB RSS - 345MB cache - 25MB buffer COMMAND sssd_be munin-asyncd munin-node snmpd
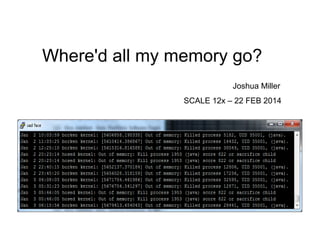
  • 21. Where'd my memory go? top - 16:40:53 up 137 days, 8:45, 5 users, load average: 0.88, 0.82, 0.46 Tasks: 138 total, 1 running, 137 sleeping, 0 stopped, 0 zombie Cpu0 : 0.0%us, 0.0%sy, 0.0%ni,100.0%id, 0.0%wa, 0.0%hi, 0.0%si, 0.0%st Cpu1 : 0.0%us, 0.0%sy, 0.0%ni,100.0%id, 0.0%wa, 0.0%hi, 0.0%si, 0.0%st Mem: 3858692k total, 1549480k used, 2309212k free, 25804k buffers Swap: 0k total, 0k used, 0k free, 344280k cached PID 28285 7767 7511 3379 USER root root root root PR 30 30 30 20 NI VIRT RES SHR S %CPU %MEM 10 238m 17m 6128 S 0.0 0.5 10 50704 8732 1312 S 0.0 0.2 10 140m 7344 580 S 0.0 0.2 0 192m 4116 652 S 0.0 0.1 ... TIME+ 1:39.42 1659:37 13:56.68 50:31.44 COMMAND sssd_be munin-asyncd munin-node snmpd 1.5G used - 106MB RSS - 345MB cache - 25MB buffer = ~1GB mystery What is consuming a GB of memory?
  • 22. kernel slab cache ● The kernel uses free memory for its own caches. ● Some include: – – – dentries (directory cache) inodes buffers
  • 23. kernel slab cache [jmiller@mem-mystery ~]$ slabtop -o Active / Total Objects (% used) Active / Total Slabs (% used) Active / Total Caches (% used) Active / Total Size (% used) Minimum / Average / Maximum Object OBJS 624114 631680 649826 494816 186 4206 6707 2296 -s c : 2461101 / 2468646 (99.7%) : 259584 / 259586 (100.0%) : 104 / 187 (55.6%) : 835570.40K / 836494.74K (99.9%) : 0.02K / 0.34K / 4096.00K ACTIVE USE OBJ SIZE SLABS OBJ/SLAB CACHE SIZE NAME 624112 99% 1.02K 208038 3 832152K nfs_inode_cache 631656 99% 0.19K 31584 20 126336K dentry 649744 99% 0.06K 11014 59 44056K size-64 494803 99% 0.03K 4418 112 17672K size-32 186 100% 32.12K 186 1 11904K kmem_cache 4193 99% 0.58K 701 6 2804K inode_cache 6163 91% 0.20K 353 19 1412K vm_area_struct 2290 99% 0.55K 328 7 1312K radix_tree_node
  • 24. kernel slab cache [jmiller@mem-mystery ~]$ slabtop -o Active / Total Objects (% used) Active / Total Slabs (% used) Active / Total Caches (% used) Active / Total Size (% used) Minimum / Average / Maximum Object OBJS 624114 631680 649826 494816 186 4206 6707 2296 -s c : 2461101 / 2468646 (99.7%) : 259584 / 259586 (100.0%) : 104 / 187 (55.6%) : 835570.40K / 836494.74K (99.9%) : 0.02K / 0.34K / 4096.00K ACTIVE USE OBJ SIZE SLABS OBJ/SLAB CACHE SIZE NAME 624112 99% 1.02K 208038 3 832152K nfs_inode_cache 631656 99% 0.19K 31584 20 126336K dentry 649744 99% 0.06K 11014 59 44056K size-64 494803 99% 0.03K 4418 112 17672K size-32 186 100% 32.12K 186 1 11904K kmem_cache 4193 99% 0.58K 701 6 2804K inode_cache 6163 91% 0.20K 353 19 1412K vm_area_struct 2290 99% 0.55K 328 7 1312K radix_tree_node 1057MB of kernel slab cache
  • 25. Where'd my memory go? top - 16:40:53 up 137 days, 8:45, 5 users, load average: 0.88, 0.82, 0.46 Tasks: 138 total, 1 running, 137 sleeping, 0 stopped, 0 zombie Cpu0 : 0.0%us, 0.0%sy, 0.0%ni,100.0%id, 0.0%wa, 0.0%hi, 0.0%si, 0.0%st Cpu1 : 0.0%us, 0.0%sy, 0.0%ni,100.0%id, 0.0%wa, 0.0%hi, 0.0%si, 0.0%st Mem: 3858692k total, 1549480k used, 2309212k free, 25804k buffers Swap: 0k total, 0k used, 0k free, 344280k cached PID 28285 7767 7511 3379 USER root root root root PR 30 30 30 20 NI VIRT RES SHR S %CPU %MEM 10 238m 17m 6128 S 0.0 0.5 10 50704 8732 1312 S 0.0 0.2 10 140m 7344 580 S 0.0 0.2 0 192m 4116 652 S 0.0 0.1 ... TIME+ 1:39.42 1659:37 13:56.68 50:31.44 COMMAND sssd_be munin-asyncd munin-node snmpd 1.5G used - 106MB RSS - 345MB cache - 25MB buffer = ~1GB mystery What is consuming a GB of memory?
  • 26. Where'd my memory go? top - 16:40:53 up 137 days, 8:45, 5 users, load average: 0.88, 0.82, 0.46 Tasks: 138 total, 1 running, 137 sleeping, 0 stopped, 0 zombie Cpu0 : 0.0%us, 0.0%sy, 0.0%ni,100.0%id, 0.0%wa, 0.0%hi, 0.0%si, 0.0%st Cpu1 : 0.0%us, 0.0%sy, 0.0%ni,100.0%id, 0.0%wa, 0.0%hi, 0.0%si, 0.0%st Mem: 3858692k total, 1549480k used, 2309212k free, 25804k buffers Swap: 0k total, 0k used, 0k free, 344280k cached PID 28285 7767 7511 3379 USER root root root root PR 30 30 30 20 NI VIRT RES SHR S %CPU %MEM 10 238m 17m 6128 S 0.0 0.5 10 50704 8732 1312 S 0.0 0.2 10 140m 7344 580 S 0.0 0.2 0 192m 4116 652 S 0.0 0.1 ... TIME+ 1:39.42 1659:37 13:56.68 50:31.44 COMMAND sssd_be munin-asyncd munin-node snmpd 1.5G used - 106MB RSS - 345MB cache - 25MB buffer = ~1GB mystery What is consuming a GB of memory? Answer: kernel slab cache → 1057MB
  • 27. kernel slab cache Additions and removals from the cache are transparent to applications Tunable through procs vfs_cache_pressure Under memory pressure, memory is freed automatically* *usually
  • 28. kernel slab cache network buffers example [jmiller@mem-mystery2 ~]$ slabtop -s c -o Active / Total Objects (% used) : 2953761 / 2971022 (99.4%) Active / Total Slabs (% used) : 413496 / 413496 (100.0%) Active / Total Caches (% used) : 106 / 188 (56.4%) Active / Total Size (% used) : 1633033.85K / 1635633.87K (99.8%) Minimum / Average / Maximum Object : 0.02K / 0.55K / 4096.00K OBJS ACTIVE USE OBJ SIZE SLABS OBJ/SLAB CACHE SIZE NAME 1270200 1270170 99% 1.00K 317550 4 1270200K size-1024 1269480 1269406 99% 0.25K 84632 15 338528K skbuff_head_cache 325857 325746 99% 0.06K 5523 59 22092K size-64
  • 29. kernel slab cache network buffers example [jmiller@mem-mystery2 ~]$ slabtop -s c -o Active / Total Objects (% used) : 2953761 / 2971022 (99.4%) Active / Total Slabs (% used) : 413496 / 413496 (100.0%) Active / Total Caches (% used) : 106 / 188 (56.4%) Active / Total Size (% used) : 1633033.85K / 1635633.87K (99.8%) Minimum / Average / Maximum Object : 0.02K / 0.55K / 4096.00K OBJS ACTIVE USE OBJ SIZE SLABS OBJ/SLAB CACHE SIZE NAME 1270200 1270170 99% 1.00K 317550 4 1270200K size-1024 1269480 1269406 99% 0.25K 84632 15 338528K skbuff_head_cache 325857 325746 99% 0.06K 5523 59 22092K size-64 ~1.5G used , this time for in-use network buffers (SO_RCVBUF)
  • 30. Unreclaimable slab [jmiller@mem-mystery2 ~]$ grep -A 2 ^Slab /proc/meminfo Slab: 1663820 kB SReclaimable: 9900 kB SUnreclaim: 1653920 kB
  • 31. Unreclaimable slab [jmiller@mem-mystery2 ~]$ grep -A 2 ^Slab /proc/meminfo Slab: 1663820 kB SReclaimable: 9900 kB SUnreclaim: 1653920 kB Some slab objects can't be reclaimed, and memory pressure won't automatically free the resources
  • 32. Nitpick Accounting Now we can account for all memory utilization: [jmiller@postgres ~]$ ./memory_explain.sh "free" buffers (MB) : 277 "free" caches (MB) : 4650 "slabtop" memory (MB) : 109.699 "ps" resident process memory (MB) : 366.508 "free" used memory (MB) : 5291 buffers+caches+slab+rss (MB) : difference (MB) : -112.207 5403.207
  • 33. Nitpick Accounting Now we can account for all memory utilization: [jmiller@postgres ~]$ ./memory_explain.sh "free" buffers (MB) : 277 "free" caches (MB) : 4650 "slabtop" memory (MB) : 109.699 "ps" resident process memory (MB) : 366.508 "free" used memory (MB) : 5291 buffers+caches+slab+rss (MB) : difference (MB) : -112.207 5403.207 But sometimes we're using more memory than we're using?!
  • 34. And a cache complication... top - 12:37:01 up 66 days, 23:38, 3 users, load average: 0.08, 0.02, 0.01 Tasks: 188 total, 1 running, 187 sleeping, 0 stopped, 0 zombie Cpu(s): 0.3%us, 0.6%sy, 0.0%ni, 98.9%id, 0.1%wa, 0.0%hi, 0.1%si, 0.0%st Mem: 7673860k total, 6895008k used, 778852k free, 300388k buffers Swap: 0k total, 0k used, 0k free, 6179780k cached PID USER 2189 postgres PR 20 NI VIRT RES SHR S %CPU %MEM 0 5313m 2.8g 2.8g S 0.0 38.5 TIME+ COMMAND 7:09.20 postgres
  • 35. And a cache complication... top - 12:37:01 up 66 days, 23:38, 3 users, load average: 0.08, 0.02, 0.01 Tasks: 188 total, 1 running, 187 sleeping, 0 stopped, 0 zombie Cpu(s): 0.3%us, 0.6%sy, 0.0%ni, 98.9%id, 0.1%wa, 0.0%hi, 0.1%si, 0.0%st Mem: 7673860k total, 6895008k used, 778852k free, 300388k buffers Swap: 0k total, 0k used, 0k free, 6179780k cached PID USER 2189 postgres PR 20 ~7G used NI VIRT RES SHR S %CPU %MEM 0 5313m 2.8g 2.8g S 0.0 38.5 TIME+ COMMAND 7:09.20 postgres
  • 36. And a cache complication... top - 12:37:01 up 66 days, 23:38, 3 users, load average: 0.08, 0.02, 0.01 Tasks: 188 total, 1 running, 187 sleeping, 0 stopped, 0 zombie Cpu(s): 0.3%us, 0.6%sy, 0.0%ni, 98.9%id, 0.1%wa, 0.0%hi, 0.1%si, 0.0%st Mem: 7673860k total, 6895008k used, 778852k free, 300388k buffers Swap: 0k total, 0k used, 0k free, 6179780k cached PID USER 2189 postgres PR 20 ~7G used , NI VIRT RES SHR S %CPU %MEM 0 5313m 2.8g 2.8g S 0.0 38.5 ~6G cached , TIME+ COMMAND 7:09.20 postgres
  • 37. And a cache complication... top - 12:37:01 up 66 days, 23:38, 3 users, load average: 0.08, 0.02, 0.01 Tasks: 188 total, 1 running, 187 sleeping, 0 stopped, 0 zombie Cpu(s): 0.3%us, 0.6%sy, 0.0%ni, 98.9%id, 0.1%wa, 0.0%hi, 0.1%si, 0.0%st Mem: 7673860k total, 6895008k used, 778852k free, 300388k buffers Swap: 0k total, 0k used, 0k free, 6179780k cached PID USER 2189 postgres PR 20 ~7G used , NI VIRT RES SHR S %CPU %MEM 0 5313m 2.8g 2.8g S 0.0 38.5 ~6G cached , TIME+ COMMAND 7:09.20 postgres so how can postgres have 2.8G resident?
  • 38. Shared memory ● Pages that multiple processes can access ● Resident, shared, and in the page cache ● Not subject to cache flush ● shmget() ● mmap()
  • 40. Shared memory shmget() top - 21:08:20 up 147 days, 13:12, 9 users, load average: 0.03, 0.04, 0.00 Tasks: 150 total, 1 running, 149 sleeping, 0 stopped, 0 zombie Cpu(s): 0.3%us, 1.5%sy, 0.4%ni, 96.7%id, 1.2%wa, 0.0%hi, 0.0%si, 0.0%st Mem: 3858692k total, 1114512k used, 2744180k free, 412k buffers Swap: 0k total, 0k used, 0k free, 931652k cached PID USER 20599 jmiller PR 20 NI 0 VIRT RES SHR S %CPU %MEM 884m 881m 881m S 0.0 23.4 TIME+ COMMAND 0:06.52 share
  • 41. Shared memory shmget() top - 21:08:20 up 147 days, 13:12, 9 users, load average: 0.03, 0.04, 0.00 Tasks: 150 total, 1 running, 149 sleeping, 0 stopped, 0 zombie Cpu(s): 0.3%us, 1.5%sy, 0.4%ni, 96.7%id, 1.2%wa, 0.0%hi, 0.0%si, 0.0%st Mem: 3858692k total, 1114512k used, 2744180k free, 412k buffers Swap: 0k total, 0k used, 0k free, 931652k cached PID USER 20599 jmiller PR 20 NI 0 VIRT RES SHR S %CPU %MEM 884m 881m 881m S 0.0 23.4 TIME+ COMMAND 0:06.52 share Shared memory is in the page cache!
  • 42. Shared memory shmget() top - 21:21:29 up 147 days, 13:25, 9 users, load average: 0.34, 0.18, 0.06 Tasks: 151 total, 1 running, 150 sleeping, 0 stopped, 0 zombie Cpu(s): 0.0%us, 0.6%sy, 0.4%ni, 98.9%id, 0.2%wa, 0.0%hi, 0.0%si, 0.0%st Mem: 3858692k total, 1099756k used, 2758936k free, 844k buffers Swap: 0k total, 0k used, 0k free, 914408k cached PID 22058 22059 22060 USER jmiller jmiller jmiller PR 20 20 20 NI 0 0 0 VIRT RES SHR S %CPU %MEM 884m 881m 881m S 0.0 23.4 884m 881m 881m S 0.0 23.4 884m 881m 881m S 0.0 23.4 TIME+ 0:05.00 0:03.35 0:03.40 COMMAND share share share 3x processes, but same resource utilization - about 1GB
  • 43. Shared memory shmget() top - 21:21:29 up 147 days, 13:25, 9 users, load average: 0.34, 0.18, 0.06 Tasks: 151 total, 1 running, 150 sleeping, 0 stopped, 0 zombie Cpu(s): 0.0%us, 0.6%sy, 0.4%ni, 98.9%id, 0.2%wa, 0.0%hi, 0.0%si, 0.0%st Mem: 3858692k total, 1099756k used, 2758936k free, 844k buffers Swap: 0k total, 0k used, 0k free, 914408k cached PID 22058 22059 22060 USER jmiller jmiller jmiller PR 20 20 20 NI 0 0 0 VIRT RES SHR S %CPU %MEM 884m 881m 881m S 0.0 23.4 884m 881m 881m S 0.0 23.4 884m 881m 881m S 0.0 23.4 From /proc/meminfo: Mapped: Shmem: TIME+ 0:05.00 0:03.35 0:03.40 912156 kB 902068 kB COMMAND share share share
  • 45. Shared memory mmap() top - 21:46:04 up 147 days, 13:50, 10 users, load average: 0.24, 0.21, 0.11 Tasks: 152 total, 1 running, 151 sleeping, 0 stopped, 0 zombie Cpu(s): 0.3%us, 1.6%sy, 0.2%ni, 94.9%id, 3.0%wa, 0.0%hi, 0.0%si, 0.0%st Mem: 3858692k total, 1648992k used, 2209700k free, 3048k buffers Swap: 0k total, 0k used, 0k free, 1385724k cached PID USER 24569 jmiller PR 20 NI VIRT RES SHR S %CPU %MEM 0 2674m 1.3g 1.3g S 0.0 35.4 TIME+ COMMAND 0:03.04 mapped From /proc/meminfo: Mapped: 1380664 kB Shmem: 212 kB
  • 46. Shared memory mmap() top - 21:48:06 up 147 days, 13:52, 10 users, load average: 0.21, 0.18, 0.10 Tasks: 154 total, 1 running, 153 sleeping, 0 stopped, 0 zombie Cpu(s): 0.2%us, 0.7%sy, 0.2%ni, 98.8%id, 0.0%wa, 0.0%hi, 0.2%si, 0.0%st Mem: 3858692k total, 1659936k used, 2198756k free, 3248k buffers Swap: 0k total, 0k used, 0k free, 1385732k cached PID 24592 24586 24599 USER jmiller jmiller jmiller PR 20 20 20 NI VIRT RES SHR 0 2674m 1.3g 1.3g 0 2674m 1.3g 1.3g 0 2674m 1.3g 1.3g S %CPU %MEM S 0.0 35.4 S 0.0 35.4 S 0.0 35.4 TIME+ 0:01.26 0:01.28 0:01.29 From /proc/meminfo: Mapped: 1380664 kB Shmem: 212 kB COMMAND mapped mapped mapped
  • 47. Shared memory mmap() top - 21:48:06 up 147 days, 13:52, 10 users, load average: 0.21, 0.18, 0.10 Tasks: 154 total, 1 running, 153 sleeping, 0 stopped, 0 zombie Cpu(s): 0.2%us, 0.7%sy, 0.2%ni, 98.8%id, 0.0%wa, 0.0%hi, 0.2%si, 0.0%st Mem: 3858692k total, 1659936k used, 2198756k free, 3248k buffers Swap: 0k total, 0k used, 0k free, 1385732k cached PID 24592 24586 24599 USER jmiller jmiller jmiller PR 20 20 20 NI VIRT RES SHR 0 2674m 1.3g 1.3g 0 2674m 1.3g 1.3g 0 2674m 1.3g 1.3g S %CPU %MEM S 0.0 35.4 S 0.0 35.4 S 0.0 35.4 TIME+ 0:01.26 0:01.28 0:01.29 COMMAND mapped mapped mapped Not counted as shared, but mapped From /proc/meminfo: Mapped: 1380664 kB Shmem: 212 kB
  • 48. Shared memory mmap() top - 21:48:06 up 147 days, 13:52, 10 users, load average: 0.21, 0.18, 0.10 Tasks: 154 total, 1 running, 153 sleeping, 0 stopped, 0 zombie Cpu(s): 0.2%us, 0.7%sy, 0.2%ni, 98.8%id, 0.0%wa, 0.0%hi, 0.2%si, 0.0%st Mem: 3858692k total, 1659936k used, 2198756k free, 3248k buffers Swap: 0k total, 0k used, 0k free, 1385732k cached PID 24592 24586 24599 USER jmiller jmiller jmiller PR 20 20 20 NI VIRT RES SHR 0 2674m 1.3g 1.3g 0 2674m 1.3g 1.3g 0 2674m 1.3g 1.3g S %CPU %MEM S 0.0 35.4 S 0.0 35.4 S 0.0 35.4 TIME+ 0:01.26 0:01.28 0:01.29 105%! From /proc/meminfo: Mapped: 1380664 kB Shmem: 212 kB COMMAND mapped mapped mapped
  • 49. A subtle difference between shmget() and mmap()...
  • 50. Locked shared memory ● Memory from shmget() must be explicitly released by a shmctl(..., IPC_RMID, …) call ● Process termination doesn't free the memory ● Not the case for mmap()
  • 51. Locked shared memory shmget() top - 11:36:35 up 151 days, 3:41, 3 users, load average: 0.09, 0.10, 0.03 Tasks: 129 total, 1 running, 128 sleeping, 0 stopped, 0 zombie Cpu(s): 0.0%us, 0.4%sy, 0.4%ni, 99.3%id, 0.0%wa, 0.0%hi, 0.0%si, 0.0%st Mem: 3858692k total, 1142248k used, 2716444k free, 3248k buffers Swap: 0k total, 0k used, 0k free, 934360k cached PID 24376 24399 7767 USER root root root PR 30 30 30 NI VIRT RES SHR S %CPU %MEM 10 253m 60m 3724 S 0.0 1.6 10 208m 15m 14m S 0.0 0.4 10 50704 8736 1312 S 1.0 0.2 TIME+ 0:35.84 0:03.22 1886:38 COMMAND chef-client sssd_nss munin-asyncd ~900M of cache
  • 52. Locked shared memory shmget() top - 11:36:35 up 151 days, 3:41, 3 users, load average: 0.09, 0.10, 0.03 Tasks: 129 total, 1 running, 128 sleeping, 0 stopped, 0 zombie Cpu(s): 0.0%us, 0.4%sy, 0.4%ni, 99.3%id, 0.0%wa, 0.0%hi, 0.0%si, 0.0%st Mem: 3858692k total, 1142248k used, 2716444k free, 3248k buffers Swap: 0k total, 0k used, 0k free, 934360k cached PID 24376 24399 7767 USER root root root PR 30 30 30 NI VIRT RES SHR S %CPU %MEM 10 253m 60m 3724 S 0.0 1.6 10 208m 15m 14m S 0.0 0.4 10 50704 8736 1312 S 1.0 0.2 TIME+ 0:35.84 0:03.22 1886:38 'echo 3 > /proc/sys/vm/drop_caches' – no impact on value of cache, so it's not filesystem caching COMMAND chef-client sssd_nss munin-asyncd
  • 53. Locked shared memory shmget() top - 11:36:35 up 151 days, 3:41, 3 users, load average: 0.09, 0.10, 0.03 Tasks: 129 total, 1 running, 128 sleeping, 0 stopped, 0 zombie Cpu(s): 0.0%us, 0.4%sy, 0.4%ni, 99.3%id, 0.0%wa, 0.0%hi, 0.0%si, 0.0%st Mem: 3858692k total, 1142248k used, 2716444k free, 3248k buffers Swap: 0k total, 0k used, 0k free, 934360k cached PID 24376 24399 7767 USER root root root PR 30 30 30 NI VIRT RES SHR S %CPU %MEM 10 253m 60m 3724 S 0.0 1.6 10 208m 15m 14m S 0.0 0.4 10 50704 8736 1312 S 1.0 0.2 TIME+ 0:35.84 0:03.22 1886:38 COMMAND chef-client sssd_nss munin-asyncd Processes consuming way less than ~900M
  • 54. Locked shared memory shmget() top - 11:36:35 up 151 days, 3:41, 3 users, load average: 0.09, 0.10, 0.03 Tasks: 129 total, 1 running, 128 sleeping, 0 stopped, 0 zombie Cpu(s): 0.0%us, 0.4%sy, 0.4%ni, 99.3%id, 0.0%wa, 0.0%hi, 0.0%si, 0.0%st Mem: 3858692k total, 1142248k used, 2716444k free, 3248k buffers Swap: 0k total, 0k used, 0k free, 934360k cached PID 24376 24399 7767 USER root root root PR 30 30 30 NI VIRT RES SHR S %CPU %MEM 10 253m 60m 3724 S 0.0 1.6 10 208m 15m 14m S 0.0 0.4 10 50704 8736 1312 S 1.0 0.2 From /proc/meminfo: Mapped: Shmem: TIME+ 0:35.84 0:03.22 1886:38 27796 kB 902044 kB COMMAND chef-client sssd_nss munin-asyncd
  • 55. Locked shared memory shmget() top - 11:36:35 up 151 days, 3:41, 3 users, load average: 0.09, 0.10, 0.03 Tasks: 129 total, 1 running, 128 sleeping, 0 stopped, 0 zombie Cpu(s): 0.0%us, 0.4%sy, 0.4%ni, 99.3%id, 0.0%wa, 0.0%hi, 0.0%si, 0.0%st Mem: 3858692k total, 1142248k used, 2716444k free, 3248k buffers Swap: 0k total, 0k used, 0k free, 934360k cached PID 24376 24399 7767 USER root root root PR 30 30 30 NI VIRT RES SHR S %CPU %MEM 10 253m 60m 3724 S 0.0 1.6 10 208m 15m 14m S 0.0 0.4 10 50704 8736 1312 S 1.0 0.2 From /proc/meminfo: Mapped: Shmem: TIME+ 0:35.84 0:03.22 1886:38 COMMAND chef-client sssd_nss munin-asyncd Un-attached shared mem segment(s) 27796 kB 902044 kB
  • 56. Locked shared memory shmget() top - 11:36:35 up 151 days, 3:41, 3 users, load average: 0.09, 0.10, 0.03 Tasks: 129 total, 1 running, 128 sleeping, 0 stopped, 0 zombie Cpu(s): 0.0%us, 0.4%sy, 0.4%ni, 99.3%id, 0.0%wa, 0.0%hi, 0.0%si, 0.0%st Mem: 3858692k total, 1142248k used, 2716444k free, 3248k buffers Swap: 0k total, 0k used, 0k free, 934360k cached PID 24376 24399 7767 USER root root root PR 30 30 30 NI VIRT RES SHR S %CPU %MEM 10 253m 60m 3724 S 0.0 1.6 10 208m 15m 14m S 0.0 0.4 10 50704 8736 1312 S 1.0 0.2 From /proc/meminfo: Mapped: Shmem: TIME+ 0:35.84 0:03.22 1886:38 COMMAND chef-client sssd_nss munin-asyncd Observable through 'ipcs -a' 27796 kB 902044 kB
  • 57. Accounting for shared memory is difficult ● ● ● ● top reports memory that can be shared – but might not be ps doesn't account for shared pmap splits mapped vs shared, reports allocated vs used mmap'd files are shared, until modified → at which point they're private
  • 58. Linux filesystem cache What's inside? Do you need it? / ? otd m tc/ e ? Impo rtan t app data ? de trit us ?
  • 59. Linux filesystem cache We know shared memory is in the page cache, which we can largely understand through proc From /proc/meminfo: Cached: ... Mapped: Shmem: 367924 kB 31752 kB 196 kB
  • 60. Linux filesystem cache We know shared memory is in the page cache, which we can largely understand through proc From /proc/meminfo: Cached: ... Mapped: Shmem: 367924 kB 31752 kB 196 kB But what about the rest of what's in the cache?
  • 61. Linux filesystem cache Bad news: We can't just ask “What's in the cache?” Good news: We can ask “Is this file in the cache?”
  • 62. linux-ftools https://code.google.com/p/linux-ftools/ [jmiller@cache ~]$ linux-fincore /tmp/big filename size cached_pages ---------------------/tmp/big 4,194,304 0 --total cached size: 0 cached_size ----------0 cached_perc ----------0.00
  • 63. linux-ftools https://code.google.com/p/linux-ftools/ [jmiller@cache ~]$ linux-fincore /tmp/big filename size cached_pages ---------------------/tmp/big 4,194,304 0 --total cached size: 0 cached_size ----------0 Zero % cached cached_perc ----------0.00
  • 64. linux-ftools https://code.google.com/p/linux-ftools/ [jmiller@cache ~]$ linux-fincore /tmp/big filename size cached_pages ---------------------/tmp/big 4,194,304 0 --total cached size: 0 cached_size ----------0 cached_perc ----------0.00 [jmiller@cache ~]$ dd if=/tmp/big of=/dev/null bs=1k count=50 Read ~5%
  • 65. linux-ftools https://code.google.com/p/linux-ftools/ [jmiller@cache ~]$ linux-fincore /tmp/big filename size cached_pages ---------------------/tmp/big 4,194,304 0 --total cached size: 0 cached_size ----------0 cached_perc ----------0.00 [jmiller@cache ~]$ dd if=/tmp/big of=/dev/null bs=1k count=50 [jmiller@cache ~]$ linux-fincore /tmp/big filename size cached_pages ---------------------/tmp/big 4,194,304 60 --total cached size: 245,760 cached_size ----------245,760 cached_perc ----------5.86 ~5% cached
  • 66. system tap – cache hits https://sourceware.org/systemtap/wiki/WSCacheHitRate [jmiller@stap ~]$ sudo stap /tmp/cachehit.stap Cache Reads (KB) 508236 0 0 686012 468788 17000 0 0 Disk Reads (KB) 24056 43600 59512 30624 0 63256 67232 19992 Miss Rate 4.51% 100.00% 100.00% 4.27% 0.00% 78.81% 100.00% 100.00% Hit Rate 95.48% 0.00% 0.00% 95.72% 100.00% 21.18% 0.00% 0.00%
  • 67. system tap – cache hits https://sourceware.org/systemtap/wiki/WSCacheHitRate [jmiller@stap ~]$ sudo stap /tmp/cachehit.stap Cache Reads (KB) 508236 0 0 686012 468788 17000 0 0 Disk Reads (KB) 24056 43600 59512 30624 0 63256 67232 19992 Miss Rate 4.51% 100.00% 100.00% 4.27% 0.00% 78.81% 100.00% 100.00% Hit Rate 95.48% 0.00% 0.00% 95.72% 100.00% 21.18% 0.00% 0.00% Track reads against VFS, reads against disk, then infer cache hits
  • 68. system tap – cache hits [jmiller@stap ~]$ sudo stap /tmp/cachehit.stap Cache Reads (KB) 508236 0 0 686012 468788 17000 0 0 Disk Reads (KB) 24056 43600 59512 30624 0 63256 67232 19992 Miss Rate 4.51% 100.00% 100.00% 4.27% 0.00% 78.81% 100.00% 100.00% Hit Rate 95.48% 0.00% 0.00% 95.72% 100.00% 21.18% 0.00% 0.00% But – have to account for LVM, device mapper, remote disk devices (NFS, iSCSI ), ...
  • 69. Easy mode - drop_caches echo 1 | sudo tee /proc/sys/vm/drop_caches ● ● ● frees clean cache pages immediately frequently accessed files should be re-cached quickly performance impact while caches repopulated
  • 70. Filesystem cache contents ● No ability to easily see full contents of cache ● mincore() - but have to check every file ● Hard - system tap / dtrace inference ● Easy – drop_caches and observe impact
  • 71. Memory: The Big Picture Virtual memory Swap Physical memory
  • 76. Physical Memory Used Kernel caches (SLAB) Private application memory Free
  • 77. Physical Memory Used Kernel caches (SLAB) Buffer cache (block IO) Private application memory Free
  • 78. Physical Memory Used Kernel caches (SLAB) Buffer cache (block IO) Private application memory Free Page cache
  • 79. Physical Memory Used Kernel caches (SLAB) Buffer cache (block IO) Private application memory Page cache Filesystem cache Free
  • 80. Physical Memory Used Kernel caches (SLAB) Buffer cache (block IO) Private application memory Page cache Shared memory Filesystem cache Free
  • 81. Physical Memory Used Kernel caches (SLAB) Buffer cache (block IO) Private application memory Page cache Shared memory Filesystem cache Free
  • 82. Thanks! Send feedback to me: joshuamiller01 on gmail