SlideShare una empresa de Scribd logo
1 de 4
Descargar para leer sin conexión
Figure 41. How a spectrophotometer works.
Using the Spectrophotometer
Any colored solution is colored because it absorbs some wavelengths of light and
transmits others. If you put blue food coloring in water, the solution will absorb most of the
light passing through it but will transmit light that has wavelengths in the blue range. Blue
light passes through the solution, other colors do not. Even apparently colorless solutions may
absorb specific wavelengths of light (perhaps in the ultraviolet range, where we can’t see it).
The spectrophotometer is designed to measure the amount of light absorbed by a
solution. This sensitive instrument is a very important tool for a biologist. It can be used to
determine a molecule’s absorption spectrum: the wavelengths of light that the particular
molecule absorbs (for example, DNA is best at absorbing UV light with a wavelength of 260 nm).
Furthermore, a more concentrated solution will absorb more light than a less concentrated one
(so the more blue food coloring you put in water, the darker it looks). Using the
spectrophotometer, we can quantitatively measure absorbance, and this information can be
used to determine the concentration of the absorbing molecule.
With a little clever experimental design, we can use the spectrophotometer as a way to
quantitate what’s going on in all kinds of biological processes. For example, if an enzyme
reaction produces or destroys a colored molecule, the spectrophotometer can be used to
measure how much of that molecule is present and therefore can quantitate the activity of the
enzyme. Here are just a few ways that a spectrophotometer might be used in biology:
N Calculate the concentration of DNA in a solution
N Quantitate photosynthesis
N Measure amounts of chlorophyll in a leaf
N Determine the rate of an enzyme-catalyzed reaction
N Measure protein concentration
N Follow the growth of bacterial cells
A spectrophotometer (see Figure 41) works by passing light from a lamp through a
“monochromator” (a prism or diffraction grating) that breaks it up into individual wavelengths.
An adjustable slit is then used to allow only light of a single wavelength to reach the sample,
which is placed in the light path in a transparent cuvette. On the other side of the cuvette is
a photoelectric tube which measures the amount of light that got through the sample.
Technically, then, what the spectrophotometer is measuring is not how much light is
absorbed, but rather how much is transmitted. However, the percentage transmitted can be
easily converted to absorbance by using this formula:
Most spectrophotometers do this conversion for you automatically. There are no units for
absorbance, but you should report the wavelength used whenever you give absorbance data
(e.g., a graph axis might be labeled “absorbance at 260 nm”).
83
84
You will find two types of spectrophotometer in the Biology department. One is a fairly
simple “Spec-20” machine which measures only the transmittance or absorbance of visible light
(wavelengths above 340 nm) and can be used with square cuvettes, round cuvettes that look
like test tubes or even culture tubes used to grow bacteria. We also have computerized
SmartSpec spectrophotometers from BioRad. Both of these are UV-VIS spectrophotometers,
meaning that they can measure absorbance of either visible or ultraviolet light.
The BioRad spectrophotometers require 1 cm square cuvettes. Plastic or glass cuvettes
can be used for measuring absorbances in the visible range, but UV light is stopped by plastic
and glass, so UV absorbance (below 340 nm) must be measured in expensive, fragile quartz
cuvettes or in plastic cuvettes designed expressly for this purpose (which are never quite as
efficient as quartz cuvettes). Be sure you are using an appropriate cuvette for the volume of
solution you want to measure and for the wavelength you need to use!
Using the BioRad spectrophotometers for single-wavelength measurements
1. Turn on the unit using the rocker switch located on the back.
2. Press the l key for single-wavelength measurement.
3. Press 1, to read the absorbance at one wavelength, followed by ENTER.
4. Enter the wavelength that you wish to read.
5. Tell the instrument not to subtract a background measurement.
6. Prepare your blank cuvette and place it into the spectrophotometer.
3 Notice that the light path runs from front-to-back, so you want your cuvette
oriented correctly. The cuvette needs to be at least half full, so that your solution is
actually in the light path. Additionally, try not to touch the sides of the cuvettes where the
light will pass through—you don't want to measure the absorbance of your fingerprints!
7. Press the READ BLANK key and wait a moment while the zero is set. Then press the right arrow key
to move on.
3 The job of the blank is to tell the spectrophotometer what “zero” is. If you're
planning to measure a colored molecule dissolved in water, then the absorbance of plain
water would represent “zero,” and you should use water as your blank. However, you
might be dissolving your molecule in a solution which is colored to start with. In that case,
your blank should be the solvent with nothing added to it, so that the spectrophotometer
will subtract out the color of the solvent itself.
8. Remove your blank cuvette and insert the cuvette with your sample. Press the READ SAMPLE key.
Note the absorbance that is displayed.
9. Continue reading as many samples as you have.
Determining an absorption spectrum with the BioRad spectrophotometers
In some cases, you won’t know in advance the wavelength(s) absorbed by the solution
you’re interested in. In that case, the first step would be to measure its absorption spectrum
and find out experimentally what wavelengths are absorbed best. The spectrophotometer has
a program which will automatically try every wavelength and give you the absorbance at each
one. Here's the procedure:
1. After the spectrophotometer warms up, press the SCAN key.
2. Enter the wavelengths that you wish to scan.
3. Press ENTER to choose to not subtract a background setting.
4. Press ENTER to select the ‘slow’ scan.
85
Figure 42. Diagram of a Spec-20
spectrophotometer.
5. Put your blank cuvette in the spectrophotometer and press READ BLANK.
6. Insert your sample cuvette and press the READ SAMPLE key. It will take a few moments to scan.
7. Press the PRINT key to get a small printout of your results. You can press PRINT again for your
partner’s notebook. Notice that the wavelengat which your sample had the maximal absorbance
(max) is listed near the top.
Following absorbance over time with the BioRad spectrophotometers
In some cases, you will want to measure how the absorbance of your solution changes
over time. This is particularlly useful for enzyme assays where your product (that absorbs light)
is being made. Rather than watching the clock and reading out the absorbance as time passes,
we can program these spectrophotometers to do that for us. Here's the procedure:
1. After the spectrophotometer warms up, press the KINETICS key.
2. Enter the wavelength that you wish to read.
3. Choose the total duration of the reaction. For example, if you want to collect the absorbance values
every five seconds for one minute, enter 60 seconds as the duration.
4. Choose the interval between successive readings. In the example above, this would be five seconds.
5. Press ENTER to choose to not subtract a background setting.
6. Put your blank cuvette in the spectrophotometer and press READ BLANK.
7. Insert your sample cuvette, start the reaction and press the READ SAMPLE key. Wait patiently while
the spectrophotometer records your data.
8. Press the PRINT key to get a small printout of your results. You can press PRINT again for your
partner’s notebook.
Using the Spec-20 spectrophotometer
1. Turn on the spectrophotometer by turning the left knob clockwise until it clicks. Use this knob to
adjust the pointer to zero on the transmittance scale (left end of the scale), or to set the digital display
to zero in transmittance mode.
2. Let the spectrophotometer warm up for 15 minutes.
3. Use the large knob on top of the spectrophotometer to set the
desired wavelength.
4. Again adjust the zero point with the left knob.
5. Place a blank in the sample holder and use the right knob to
adjust the reading to 100% transmittance (or zero on the
absorbance scale). Remove the blank.
6. If you are using the digital spectrophotometer, use the Mode
switch to choose absorbance or transmittance mode as needed.
7. Place your sample in the sample holder and read absorbance or
transmittance.
Determining concentration with a standard curve
There are two ways we could measure the concentration of some unknown solution
using the spectrophotometer. The first is to generate a standard curve: a graph of absorbance
vs. concentration for standard solutions whose concentrations are known. We then compare the
absorbance of an unknown solution (of the same molecule) to that curve. We don’t have to know
anything about the molecule in advance. Essentially, we are “calibrating” the spectrophotometer
to measure the concentration of the molecule we’re interested in.
86
Figure 43. Standard curve used to determine the
concentration of an unknown solution
To make a standard curve, you’ll need at
least three or four different solutions with known
concentrations (called standards). You can come
up with these easily by taking a single solution of
known concentration and making several different
dilutions of it (see the section on measurements
and solutions on page 57). Then, measure the
absorbance of each known solution and draw a
graph, plotting absorbance vs. concentration, as
shown in Figure 43.
In this graph, concentration is placed on
the X-axis, because it’s the independent variable—
the one we’re manipulating. The absorbance is on
the Y-axis, because it’s the dependent variable: the
one whose value depends on the independent
variable.
The line on this graph represents the relationship between absorbance and
concentration. This should not be a “connect-the-dots” line: it needs to be a best-fit straight
line. Computer programs like Excel can calculate the equation of the best-fit line for you and
so can most scientific calculators. See the graphing section of this manual (page 43)for some
help with this. Generally, you want to include (0,0) as one of your points.
After generating a standard curve, you can measure the absorbance of the unknown
solution and compare it to the absorbances of the known solutions. You could do this by
eyeballing where the unknown would fall on the graph, but it’s more accurate to use the
equation of the best-fit line (in the form y = mx + b) to calculate the concentration. Here, y is the
absorbance, which you measure, x is the concentration that you want to know, and m and b
are the slope and intercept of the best-fit line, which Excel will tell you. By solving for x, you can
accurately calculate the concentration of the unknown.
In order for this calculation to be accurate, the absorbance of the unknown has to fall
within the range of absorbances of the known solutions—if it doesn’t, you may have to dilute
the unknown, or make different standards and try again. It’s important to note that the
relationship between absorbance and concentration is only linear within a certain range, and
maxonly when you use the right wavelength of light. The “right” wavelength is ë , or the
wavelength at which the molecule absorbs best. If you don’t know which wavelength to use, you
maxcan determine ë experimentally by measuring the absorption spectrum as described above.
maxThe peak wavelength is ë .
Determining concentration by the Beers-Lambert law
The second way to measure concentration using the spectrophotometer is really the
maxsame as the first, but with a shortcut. If you (or someone else) has already determined ë and
drawn a standard curve which shows a linear relationship between absorbance and
concentration, then you can calculate a number called the extinction coefficient, which you can
always use to find concentration for that molecule under those conditions.
The extinction coefficient simply relates concentration to absorbance, using a formula
called the Beers-Lambert law. In this equation, the absorbance is equal to the concentration of
the molecule of interest (c), times the length of the path the light takes through the cuvette (b;
always 1 cm for our spectrophotometers), times the extinction coefficient (g):
Abs = gbc
The extinction coefficient is the part that is specific for each compound and must be determined
experimentally. You can determine it from your standard curve by solving for g, because you
know the absorbance and concentration and can measure the width of the cuvette. Once you
know g, you can use it for other solutions of the same molecule.

Más contenido relacionado

La actualidad más candente

4. colour measuring instruments
4. colour measuring instruments4. colour measuring instruments
4. colour measuring instrumentsGhent University
 
Nanoparticle Tracking Analysis (particle by particle technique)
Nanoparticle Tracking Analysis (particle by particle technique)Nanoparticle Tracking Analysis (particle by particle technique)
Nanoparticle Tracking Analysis (particle by particle technique)Anson Ho
 
Colorimeter and spectrophotometer, Mass Spectrometer
Colorimeter and spectrophotometer, Mass SpectrometerColorimeter and spectrophotometer, Mass Spectrometer
Colorimeter and spectrophotometer, Mass Spectrometerprachann
 
13. measure light p5
13. measure light p513. measure light p5
13. measure light p5DIAH KOHLER
 
Chaprter 23 spectrophotometer
Chaprter 23   spectrophotometerChaprter 23   spectrophotometer
Chaprter 23 spectrophotometeranatanat
 
Calibration of uv visible spectrophotometer
Calibration of uv visible spectrophotometerCalibration of uv visible spectrophotometer
Calibration of uv visible spectrophotometerGauravchaudhary199
 
Nephlometry & turbidimetry
Nephlometry &  turbidimetryNephlometry &  turbidimetry
Nephlometry & turbidimetryshaisejacob
 
project proposal final
project proposal finalproject proposal final
project proposal finalChintan Patel
 
APPLICATION OF COLORIMETRY IN TRACE MINERAL ANALYSIS
APPLICATION OF COLORIMETRY IN TRACE MINERAL ANALYSISAPPLICATION OF COLORIMETRY IN TRACE MINERAL ANALYSIS
APPLICATION OF COLORIMETRY IN TRACE MINERAL ANALYSISDr. IRSHAD A
 
Dynamic Light Scattering
Dynamic Light Scattering Dynamic Light Scattering
Dynamic Light Scattering Pooja Mehta
 
Nanotech and biotech
Nanotech and biotechNanotech and biotech
Nanotech and biotechTorrey DeLuca
 
TimeGate Instruments ICAVS8 Poster
TimeGate Instruments ICAVS8 PosterTimeGate Instruments ICAVS8 Poster
TimeGate Instruments ICAVS8 PosterTimegate Instruments
 

La actualidad más candente (20)

Spectronic 21
Spectronic 21Spectronic 21
Spectronic 21
 
4. colour measuring instruments
4. colour measuring instruments4. colour measuring instruments
4. colour measuring instruments
 
Nanoparticle Tracking Analysis (particle by particle technique)
Nanoparticle Tracking Analysis (particle by particle technique)Nanoparticle Tracking Analysis (particle by particle technique)
Nanoparticle Tracking Analysis (particle by particle technique)
 
Colorimeter and spectrophotometer, Mass Spectrometer
Colorimeter and spectrophotometer, Mass SpectrometerColorimeter and spectrophotometer, Mass Spectrometer
Colorimeter and spectrophotometer, Mass Spectrometer
 
13. measure light p5
13. measure light p513. measure light p5
13. measure light p5
 
Chaprter 23 spectrophotometer
Chaprter 23   spectrophotometerChaprter 23   spectrophotometer
Chaprter 23 spectrophotometer
 
Intro exposure
Intro exposureIntro exposure
Intro exposure
 
Calibration of uv visible spectrophotometer
Calibration of uv visible spectrophotometerCalibration of uv visible spectrophotometer
Calibration of uv visible spectrophotometer
 
Nephlometry & turbidimetry
Nephlometry &  turbidimetryNephlometry &  turbidimetry
Nephlometry & turbidimetry
 
Colorimetery
ColorimeteryColorimetery
Colorimetery
 
5 nephalo turbido jntu pharmacy
5 nephalo turbido jntu pharmacy5 nephalo turbido jntu pharmacy
5 nephalo turbido jntu pharmacy
 
colorimeter
colorimetercolorimeter
colorimeter
 
project proposal final
project proposal finalproject proposal final
project proposal final
 
APPLICATION OF COLORIMETRY IN TRACE MINERAL ANALYSIS
APPLICATION OF COLORIMETRY IN TRACE MINERAL ANALYSISAPPLICATION OF COLORIMETRY IN TRACE MINERAL ANALYSIS
APPLICATION OF COLORIMETRY IN TRACE MINERAL ANALYSIS
 
Dynamic Light Scattering
Dynamic Light Scattering Dynamic Light Scattering
Dynamic Light Scattering
 
Nanotech and biotech
Nanotech and biotechNanotech and biotech
Nanotech and biotech
 
Spectrophotometry
SpectrophotometrySpectrophotometry
Spectrophotometry
 
Colorimetry class
Colorimetry classColorimetry class
Colorimetry class
 
Colorimeters
ColorimetersColorimeters
Colorimeters
 
TimeGate Instruments ICAVS8 Poster
TimeGate Instruments ICAVS8 PosterTimeGate Instruments ICAVS8 Poster
TimeGate Instruments ICAVS8 Poster
 

Destacado

Destacado (9)

Project Architect/Manager 02
Project Architect/Manager 02Project Architect/Manager 02
Project Architect/Manager 02
 
the copper group
the copper group the copper group
the copper group
 
Project Architect/Manager 01
Project Architect/Manager 01Project Architect/Manager 01
Project Architect/Manager 01
 
Earth science day one
Earth science day oneEarth science day one
Earth science day one
 
Summary of how to classify minerals
Summary of how to classify mineralsSummary of how to classify minerals
Summary of how to classify minerals
 
Kh pacidbaseneutralization[1]slide onenewthis one
Kh pacidbaseneutralization[1]slide onenewthis oneKh pacidbaseneutralization[1]slide onenewthis one
Kh pacidbaseneutralization[1]slide onenewthis one
 
Nya lesson plan5
Nya lesson plan5Nya lesson plan5
Nya lesson plan5
 
Security models
Security modelsSecurity models
Security models
 
Electrochemistry
ElectrochemistryElectrochemistry
Electrochemistry
 

Similar a Spec operation manuaul

Spectrophotometer meter
Spectrophotometer meterSpectrophotometer meter
Spectrophotometer meterECRD2015
 
Chapter 8
Chapter 8Chapter 8
Chapter 8ECRD IN
 
Spectrophotometer Meter
Spectrophotometer MeterSpectrophotometer Meter
Spectrophotometer MeterECRD IN
 
INTRODUCTION TO COLORIMETRY and its basics.ppt
INTRODUCTION TO COLORIMETRY and its basics.pptINTRODUCTION TO COLORIMETRY and its basics.ppt
INTRODUCTION TO COLORIMETRY and its basics.pptSheelaS18
 
Colorimetry and atomic absorption spectroscopy
Colorimetry and atomic absorption spectroscopy Colorimetry and atomic absorption spectroscopy
Colorimetry and atomic absorption spectroscopy O.P PARIHAR
 
Spectroscopy in pharmacognosy
Spectroscopy in pharmacognosySpectroscopy in pharmacognosy
Spectroscopy in pharmacognosySurbhiSharma196
 
Jandrew/SPECTROPHOTOMETER.pptx
Jandrew/SPECTROPHOTOMETER.pptxJandrew/SPECTROPHOTOMETER.pptx
Jandrew/SPECTROPHOTOMETER.pptxshakinadeiv1
 
all sops combined pdf.pdf
all sops combined pdf.pdfall sops combined pdf.pdf
all sops combined pdf.pdfAsifSHAIKH50040
 
all sops combined pdf.pdf
all sops combined pdf.pdfall sops combined pdf.pdf
all sops combined pdf.pdfAsif Shaikh
 
How to use a colorimeter
How to use a colorimeterHow to use a colorimeter
How to use a colorimeterDana Porter
 
MICRO VOLUME UV/VIS SPECTROSCOPY ,U5nano spectrophotometer
MICRO VOLUME UV/VIS SPECTROSCOPY ,U5nano spectrophotometerMICRO VOLUME UV/VIS SPECTROSCOPY ,U5nano spectrophotometer
MICRO VOLUME UV/VIS SPECTROSCOPY ,U5nano spectrophotometersuriyapriya kamaraj
 
Spectrophotometer.pptx
Spectrophotometer.pptxSpectrophotometer.pptx
Spectrophotometer.pptxDeepa B
 
Nephelometric and turbidimetric Analysis of Pollutants
Nephelometric and turbidimetric  Analysis of PollutantsNephelometric and turbidimetric  Analysis of Pollutants
Nephelometric and turbidimetric Analysis of PollutantsShivaji Burungale
 
UV-VIS SPECTRO final.ppt
UV-VIS SPECTRO final.pptUV-VIS SPECTRO final.ppt
UV-VIS SPECTRO final.pptJgdishrathi
 
Uv vis spectroscopy practical.
Uv vis spectroscopy practical.Uv vis spectroscopy practical.
Uv vis spectroscopy practical.Salum Mkata
 

Similar a Spec operation manuaul (20)

Spectrophotometer meter
Spectrophotometer meterSpectrophotometer meter
Spectrophotometer meter
 
Chapter 8
Chapter 8Chapter 8
Chapter 8
 
Spectrophotometer Meter
Spectrophotometer MeterSpectrophotometer Meter
Spectrophotometer Meter
 
Spectroscopy
Spectroscopy Spectroscopy
Spectroscopy
 
INTRODUCTION TO COLORIMETRY and its basics.ppt
INTRODUCTION TO COLORIMETRY and its basics.pptINTRODUCTION TO COLORIMETRY and its basics.ppt
INTRODUCTION TO COLORIMETRY and its basics.ppt
 
Colorimetry and atomic absorption spectroscopy
Colorimetry and atomic absorption spectroscopy Colorimetry and atomic absorption spectroscopy
Colorimetry and atomic absorption spectroscopy
 
Spectroscopy in pharmacognosy
Spectroscopy in pharmacognosySpectroscopy in pharmacognosy
Spectroscopy in pharmacognosy
 
P pt priyanka
P pt priyankaP pt priyanka
P pt priyanka
 
Jandrew/SPECTROPHOTOMETER.pptx
Jandrew/SPECTROPHOTOMETER.pptxJandrew/SPECTROPHOTOMETER.pptx
Jandrew/SPECTROPHOTOMETER.pptx
 
all sops combined pdf.pdf
all sops combined pdf.pdfall sops combined pdf.pdf
all sops combined pdf.pdf
 
all sops combined pdf.pdf
all sops combined pdf.pdfall sops combined pdf.pdf
all sops combined pdf.pdf
 
Molecular Spectroscopy
Molecular SpectroscopyMolecular Spectroscopy
Molecular Spectroscopy
 
Flame Photometry
Flame Photometry Flame Photometry
Flame Photometry
 
How to use a colorimeter
How to use a colorimeterHow to use a colorimeter
How to use a colorimeter
 
MICRO VOLUME UV/VIS SPECTROSCOPY ,U5nano spectrophotometer
MICRO VOLUME UV/VIS SPECTROSCOPY ,U5nano spectrophotometerMICRO VOLUME UV/VIS SPECTROSCOPY ,U5nano spectrophotometer
MICRO VOLUME UV/VIS SPECTROSCOPY ,U5nano spectrophotometer
 
Spectrophotometer.pptx
Spectrophotometer.pptxSpectrophotometer.pptx
Spectrophotometer.pptx
 
Nephelometric and turbidimetric Analysis of Pollutants
Nephelometric and turbidimetric  Analysis of PollutantsNephelometric and turbidimetric  Analysis of Pollutants
Nephelometric and turbidimetric Analysis of Pollutants
 
UV-VIS SPECTRO final.ppt
UV-VIS SPECTRO final.pptUV-VIS SPECTRO final.ppt
UV-VIS SPECTRO final.ppt
 
Uv vis spectroscopy practical.
Uv vis spectroscopy practical.Uv vis spectroscopy practical.
Uv vis spectroscopy practical.
 
Microplate Reader
Microplate ReaderMicroplate Reader
Microplate Reader
 

Más de Dr Robert Craig PhD

Hofstra Living environment Dr Rob
Hofstra Living environment Dr RobHofstra Living environment Dr Rob
Hofstra Living environment Dr RobDr Robert Craig PhD
 
Chapter 2-Your text book ves 5.pptx
Chapter 2-Your text book ves 5.pptxChapter 2-Your text book ves 5.pptx
Chapter 2-Your text book ves 5.pptxDr Robert Craig PhD
 
Brown dwarfs and planets jaslyn.pdf
Brown dwarfs and planets jaslyn.pdfBrown dwarfs and planets jaslyn.pdf
Brown dwarfs and planets jaslyn.pdfDr Robert Craig PhD
 
Day 1 Martin file from syllabus ves 5.pptx
Day 1 Martin file from syllabus ves 5.pptxDay 1 Martin file from syllabus ves 5.pptx
Day 1 Martin file from syllabus ves 5.pptxDr Robert Craig PhD
 
Astronomy chapter 1 power point.pptx
Astronomy chapter 1 power point.pptxAstronomy chapter 1 power point.pptx
Astronomy chapter 1 power point.pptxDr Robert Craig PhD
 
5Page43 how to classify stars parkslope heard from Annie.pdf
5Page43 how to classify stars parkslope  heard from Annie.pdf5Page43 how to classify stars parkslope  heard from Annie.pdf
5Page43 how to classify stars parkslope heard from Annie.pdfDr Robert Craig PhD
 
1-D Kinematics AP Lab Graphing.docx
1-D Kinematics AP Lab Graphing.docx1-D Kinematics AP Lab Graphing.docx
1-D Kinematics AP Lab Graphing.docxDr Robert Craig PhD
 
03 - Average Rates of Changec Cameron 1 Sara Hill.pdf
03 - Average Rates of Changec Cameron 1 Sara Hill.pdf03 - Average Rates of Changec Cameron 1 Sara Hill.pdf
03 - Average Rates of Changec Cameron 1 Sara Hill.pdfDr Robert Craig PhD
 
5.4- Measuring the Earth with Eratosthenes. Ves 2.pdf
5.4- Measuring the Earth with Eratosthenes. Ves 2.pdf5.4- Measuring the Earth with Eratosthenes. Ves 2.pdf
5.4- Measuring the Earth with Eratosthenes. Ves 2.pdfDr Robert Craig PhD
 
chapter 2 redone parkslope ves 4.pdf
chapter 2 redone parkslope ves 4.pdfchapter 2 redone parkslope ves 4.pdf
chapter 2 redone parkslope ves 4.pdfDr Robert Craig PhD
 
season_path_of_the_sun_and_latitude.pdf
season_path_of_the_sun_and_latitude.pdfseason_path_of_the_sun_and_latitude.pdf
season_path_of_the_sun_and_latitude.pdfDr Robert Craig PhD
 

Más de Dr Robert Craig PhD (20)

Hofstra Living environment Dr Rob
Hofstra Living environment Dr RobHofstra Living environment Dr Rob
Hofstra Living environment Dr Rob
 
pdf (4) 4.pdf
pdf (4) 4.pdfpdf (4) 4.pdf
pdf (4) 4.pdf
 
Mastering_Assignments.pdf.pdf
Mastering_Assignments.pdf.pdfMastering_Assignments.pdf.pdf
Mastering_Assignments.pdf.pdf
 
Lecture3.pdf
Lecture3.pdfLecture3.pdf
Lecture3.pdf
 
Lecture2.pdf
Lecture2.pdfLecture2.pdf
Lecture2.pdf
 
Lecture0.pdf
Lecture0.pdfLecture0.pdf
Lecture0.pdf
 
lecture 11 of 12 ves 1.pptx
lecture 11 of 12 ves 1.pptxlecture 11 of 12 ves 1.pptx
lecture 11 of 12 ves 1.pptx
 
Chapter 2-Your text book ves 5.pptx
Chapter 2-Your text book ves 5.pptxChapter 2-Your text book ves 5.pptx
Chapter 2-Your text book ves 5.pptx
 
Brown dwarfs and planets jaslyn.pdf
Brown dwarfs and planets jaslyn.pdfBrown dwarfs and planets jaslyn.pdf
Brown dwarfs and planets jaslyn.pdf
 
Day 1 Martin file from syllabus ves 5.pptx
Day 1 Martin file from syllabus ves 5.pptxDay 1 Martin file from syllabus ves 5.pptx
Day 1 Martin file from syllabus ves 5.pptx
 
Astronomy chapter 1 power point.pptx
Astronomy chapter 1 power point.pptxAstronomy chapter 1 power point.pptx
Astronomy chapter 1 power point.pptx
 
5Page43 how to classify stars parkslope heard from Annie.pdf
5Page43 how to classify stars parkslope  heard from Annie.pdf5Page43 how to classify stars parkslope  heard from Annie.pdf
5Page43 how to classify stars parkslope heard from Annie.pdf
 
1-D Kinematics AP Lab Graphing.docx
1-D Kinematics AP Lab Graphing.docx1-D Kinematics AP Lab Graphing.docx
1-D Kinematics AP Lab Graphing.docx
 
03 - Average Rates of Changec Cameron 1 Sara Hill.pdf
03 - Average Rates of Changec Cameron 1 Sara Hill.pdf03 - Average Rates of Changec Cameron 1 Sara Hill.pdf
03 - Average Rates of Changec Cameron 1 Sara Hill.pdf
 
5.4- Measuring the Earth with Eratosthenes. Ves 2.pdf
5.4- Measuring the Earth with Eratosthenes. Ves 2.pdf5.4- Measuring the Earth with Eratosthenes. Ves 2.pdf
5.4- Measuring the Earth with Eratosthenes. Ves 2.pdf
 
4.6- The Wanderers ves 7.pptx
4.6- The Wanderers ves 7.pptx4.6- The Wanderers ves 7.pptx
4.6- The Wanderers ves 7.pptx
 
Physics chapter 1.docx
Physics chapter 1.docxPhysics chapter 1.docx
Physics chapter 1.docx
 
chapter 2 redone parkslope ves 4.pdf
chapter 2 redone parkslope ves 4.pdfchapter 2 redone parkslope ves 4.pdf
chapter 2 redone parkslope ves 4.pdf
 
4.6- The Wanderers ves 7.pptx
4.6- The Wanderers ves 7.pptx4.6- The Wanderers ves 7.pptx
4.6- The Wanderers ves 7.pptx
 
season_path_of_the_sun_and_latitude.pdf
season_path_of_the_sun_and_latitude.pdfseason_path_of_the_sun_and_latitude.pdf
season_path_of_the_sun_and_latitude.pdf
 

Último

08448380779 Call Girls In Friends Colony Women Seeking Men
08448380779 Call Girls In Friends Colony Women Seeking Men08448380779 Call Girls In Friends Colony Women Seeking Men
08448380779 Call Girls In Friends Colony Women Seeking MenDelhi Call girls
 
04-2024-HHUG-Sales-and-Marketing-Alignment.pptx
04-2024-HHUG-Sales-and-Marketing-Alignment.pptx04-2024-HHUG-Sales-and-Marketing-Alignment.pptx
04-2024-HHUG-Sales-and-Marketing-Alignment.pptxHampshireHUG
 
Histor y of HAM Radio presentation slide
Histor y of HAM Radio presentation slideHistor y of HAM Radio presentation slide
Histor y of HAM Radio presentation slidevu2urc
 
Mastering MySQL Database Architecture: Deep Dive into MySQL Shell and MySQL R...
Mastering MySQL Database Architecture: Deep Dive into MySQL Shell and MySQL R...Mastering MySQL Database Architecture: Deep Dive into MySQL Shell and MySQL R...
Mastering MySQL Database Architecture: Deep Dive into MySQL Shell and MySQL R...Miguel Araújo
 
🐬 The future of MySQL is Postgres 🐘
🐬  The future of MySQL is Postgres   🐘🐬  The future of MySQL is Postgres   🐘
🐬 The future of MySQL is Postgres 🐘RTylerCroy
 
TrustArc Webinar - Stay Ahead of US State Data Privacy Law Developments
TrustArc Webinar - Stay Ahead of US State Data Privacy Law DevelopmentsTrustArc Webinar - Stay Ahead of US State Data Privacy Law Developments
TrustArc Webinar - Stay Ahead of US State Data Privacy Law DevelopmentsTrustArc
 
How to convert PDF to text with Nanonets
How to convert PDF to text with NanonetsHow to convert PDF to text with Nanonets
How to convert PDF to text with Nanonetsnaman860154
 
Driving Behavioral Change for Information Management through Data-Driven Gree...
Driving Behavioral Change for Information Management through Data-Driven Gree...Driving Behavioral Change for Information Management through Data-Driven Gree...
Driving Behavioral Change for Information Management through Data-Driven Gree...Enterprise Knowledge
 
The Codex of Business Writing Software for Real-World Solutions 2.pptx
The Codex of Business Writing Software for Real-World Solutions 2.pptxThe Codex of Business Writing Software for Real-World Solutions 2.pptx
The Codex of Business Writing Software for Real-World Solutions 2.pptxMalak Abu Hammad
 
A Domino Admins Adventures (Engage 2024)
A Domino Admins Adventures (Engage 2024)A Domino Admins Adventures (Engage 2024)
A Domino Admins Adventures (Engage 2024)Gabriella Davis
 
Presentation on how to chat with PDF using ChatGPT code interpreter
Presentation on how to chat with PDF using ChatGPT code interpreterPresentation on how to chat with PDF using ChatGPT code interpreter
Presentation on how to chat with PDF using ChatGPT code interpreternaman860154
 
Apidays Singapore 2024 - Building Digital Trust in a Digital Economy by Veron...
Apidays Singapore 2024 - Building Digital Trust in a Digital Economy by Veron...Apidays Singapore 2024 - Building Digital Trust in a Digital Economy by Veron...
Apidays Singapore 2024 - Building Digital Trust in a Digital Economy by Veron...apidays
 
Scaling API-first – The story of a global engineering organization
Scaling API-first – The story of a global engineering organizationScaling API-first – The story of a global engineering organization
Scaling API-first – The story of a global engineering organizationRadu Cotescu
 
Neo4j - How KGs are shaping the future of Generative AI at AWS Summit London ...
Neo4j - How KGs are shaping the future of Generative AI at AWS Summit London ...Neo4j - How KGs are shaping the future of Generative AI at AWS Summit London ...
Neo4j - How KGs are shaping the future of Generative AI at AWS Summit London ...Neo4j
 
Factors to Consider When Choosing Accounts Payable Services Providers.pptx
Factors to Consider When Choosing Accounts Payable Services Providers.pptxFactors to Consider When Choosing Accounts Payable Services Providers.pptx
Factors to Consider When Choosing Accounts Payable Services Providers.pptxKatpro Technologies
 
Finology Group – Insurtech Innovation Award 2024
Finology Group – Insurtech Innovation Award 2024Finology Group – Insurtech Innovation Award 2024
Finology Group – Insurtech Innovation Award 2024The Digital Insurer
 
Injustice - Developers Among Us (SciFiDevCon 2024)
Injustice - Developers Among Us (SciFiDevCon 2024)Injustice - Developers Among Us (SciFiDevCon 2024)
Injustice - Developers Among Us (SciFiDevCon 2024)Allon Mureinik
 
IAC 2024 - IA Fast Track to Search Focused AI Solutions
IAC 2024 - IA Fast Track to Search Focused AI SolutionsIAC 2024 - IA Fast Track to Search Focused AI Solutions
IAC 2024 - IA Fast Track to Search Focused AI SolutionsEnterprise Knowledge
 
Tata AIG General Insurance Company - Insurer Innovation Award 2024
Tata AIG General Insurance Company - Insurer Innovation Award 2024Tata AIG General Insurance Company - Insurer Innovation Award 2024
Tata AIG General Insurance Company - Insurer Innovation Award 2024The Digital Insurer
 
Automating Google Workspace (GWS) & more with Apps Script
Automating Google Workspace (GWS) & more with Apps ScriptAutomating Google Workspace (GWS) & more with Apps Script
Automating Google Workspace (GWS) & more with Apps Scriptwesley chun
 

Último (20)

08448380779 Call Girls In Friends Colony Women Seeking Men
08448380779 Call Girls In Friends Colony Women Seeking Men08448380779 Call Girls In Friends Colony Women Seeking Men
08448380779 Call Girls In Friends Colony Women Seeking Men
 
04-2024-HHUG-Sales-and-Marketing-Alignment.pptx
04-2024-HHUG-Sales-and-Marketing-Alignment.pptx04-2024-HHUG-Sales-and-Marketing-Alignment.pptx
04-2024-HHUG-Sales-and-Marketing-Alignment.pptx
 
Histor y of HAM Radio presentation slide
Histor y of HAM Radio presentation slideHistor y of HAM Radio presentation slide
Histor y of HAM Radio presentation slide
 
Mastering MySQL Database Architecture: Deep Dive into MySQL Shell and MySQL R...
Mastering MySQL Database Architecture: Deep Dive into MySQL Shell and MySQL R...Mastering MySQL Database Architecture: Deep Dive into MySQL Shell and MySQL R...
Mastering MySQL Database Architecture: Deep Dive into MySQL Shell and MySQL R...
 
🐬 The future of MySQL is Postgres 🐘
🐬  The future of MySQL is Postgres   🐘🐬  The future of MySQL is Postgres   🐘
🐬 The future of MySQL is Postgres 🐘
 
TrustArc Webinar - Stay Ahead of US State Data Privacy Law Developments
TrustArc Webinar - Stay Ahead of US State Data Privacy Law DevelopmentsTrustArc Webinar - Stay Ahead of US State Data Privacy Law Developments
TrustArc Webinar - Stay Ahead of US State Data Privacy Law Developments
 
How to convert PDF to text with Nanonets
How to convert PDF to text with NanonetsHow to convert PDF to text with Nanonets
How to convert PDF to text with Nanonets
 
Driving Behavioral Change for Information Management through Data-Driven Gree...
Driving Behavioral Change for Information Management through Data-Driven Gree...Driving Behavioral Change for Information Management through Data-Driven Gree...
Driving Behavioral Change for Information Management through Data-Driven Gree...
 
The Codex of Business Writing Software for Real-World Solutions 2.pptx
The Codex of Business Writing Software for Real-World Solutions 2.pptxThe Codex of Business Writing Software for Real-World Solutions 2.pptx
The Codex of Business Writing Software for Real-World Solutions 2.pptx
 
A Domino Admins Adventures (Engage 2024)
A Domino Admins Adventures (Engage 2024)A Domino Admins Adventures (Engage 2024)
A Domino Admins Adventures (Engage 2024)
 
Presentation on how to chat with PDF using ChatGPT code interpreter
Presentation on how to chat with PDF using ChatGPT code interpreterPresentation on how to chat with PDF using ChatGPT code interpreter
Presentation on how to chat with PDF using ChatGPT code interpreter
 
Apidays Singapore 2024 - Building Digital Trust in a Digital Economy by Veron...
Apidays Singapore 2024 - Building Digital Trust in a Digital Economy by Veron...Apidays Singapore 2024 - Building Digital Trust in a Digital Economy by Veron...
Apidays Singapore 2024 - Building Digital Trust in a Digital Economy by Veron...
 
Scaling API-first – The story of a global engineering organization
Scaling API-first – The story of a global engineering organizationScaling API-first – The story of a global engineering organization
Scaling API-first – The story of a global engineering organization
 
Neo4j - How KGs are shaping the future of Generative AI at AWS Summit London ...
Neo4j - How KGs are shaping the future of Generative AI at AWS Summit London ...Neo4j - How KGs are shaping the future of Generative AI at AWS Summit London ...
Neo4j - How KGs are shaping the future of Generative AI at AWS Summit London ...
 
Factors to Consider When Choosing Accounts Payable Services Providers.pptx
Factors to Consider When Choosing Accounts Payable Services Providers.pptxFactors to Consider When Choosing Accounts Payable Services Providers.pptx
Factors to Consider When Choosing Accounts Payable Services Providers.pptx
 
Finology Group – Insurtech Innovation Award 2024
Finology Group – Insurtech Innovation Award 2024Finology Group – Insurtech Innovation Award 2024
Finology Group – Insurtech Innovation Award 2024
 
Injustice - Developers Among Us (SciFiDevCon 2024)
Injustice - Developers Among Us (SciFiDevCon 2024)Injustice - Developers Among Us (SciFiDevCon 2024)
Injustice - Developers Among Us (SciFiDevCon 2024)
 
IAC 2024 - IA Fast Track to Search Focused AI Solutions
IAC 2024 - IA Fast Track to Search Focused AI SolutionsIAC 2024 - IA Fast Track to Search Focused AI Solutions
IAC 2024 - IA Fast Track to Search Focused AI Solutions
 
Tata AIG General Insurance Company - Insurer Innovation Award 2024
Tata AIG General Insurance Company - Insurer Innovation Award 2024Tata AIG General Insurance Company - Insurer Innovation Award 2024
Tata AIG General Insurance Company - Insurer Innovation Award 2024
 
Automating Google Workspace (GWS) & more with Apps Script
Automating Google Workspace (GWS) & more with Apps ScriptAutomating Google Workspace (GWS) & more with Apps Script
Automating Google Workspace (GWS) & more with Apps Script
 

Spec operation manuaul

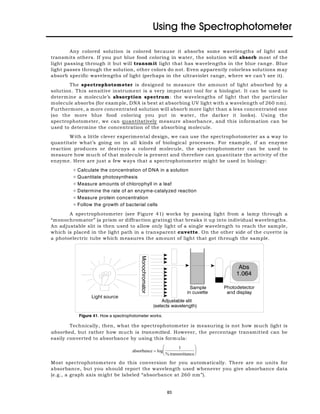
  • 1. Figure 41. How a spectrophotometer works. Using the Spectrophotometer Any colored solution is colored because it absorbs some wavelengths of light and transmits others. If you put blue food coloring in water, the solution will absorb most of the light passing through it but will transmit light that has wavelengths in the blue range. Blue light passes through the solution, other colors do not. Even apparently colorless solutions may absorb specific wavelengths of light (perhaps in the ultraviolet range, where we can’t see it). The spectrophotometer is designed to measure the amount of light absorbed by a solution. This sensitive instrument is a very important tool for a biologist. It can be used to determine a molecule’s absorption spectrum: the wavelengths of light that the particular molecule absorbs (for example, DNA is best at absorbing UV light with a wavelength of 260 nm). Furthermore, a more concentrated solution will absorb more light than a less concentrated one (so the more blue food coloring you put in water, the darker it looks). Using the spectrophotometer, we can quantitatively measure absorbance, and this information can be used to determine the concentration of the absorbing molecule. With a little clever experimental design, we can use the spectrophotometer as a way to quantitate what’s going on in all kinds of biological processes. For example, if an enzyme reaction produces or destroys a colored molecule, the spectrophotometer can be used to measure how much of that molecule is present and therefore can quantitate the activity of the enzyme. Here are just a few ways that a spectrophotometer might be used in biology: N Calculate the concentration of DNA in a solution N Quantitate photosynthesis N Measure amounts of chlorophyll in a leaf N Determine the rate of an enzyme-catalyzed reaction N Measure protein concentration N Follow the growth of bacterial cells A spectrophotometer (see Figure 41) works by passing light from a lamp through a “monochromator” (a prism or diffraction grating) that breaks it up into individual wavelengths. An adjustable slit is then used to allow only light of a single wavelength to reach the sample, which is placed in the light path in a transparent cuvette. On the other side of the cuvette is a photoelectric tube which measures the amount of light that got through the sample. Technically, then, what the spectrophotometer is measuring is not how much light is absorbed, but rather how much is transmitted. However, the percentage transmitted can be easily converted to absorbance by using this formula: Most spectrophotometers do this conversion for you automatically. There are no units for absorbance, but you should report the wavelength used whenever you give absorbance data (e.g., a graph axis might be labeled “absorbance at 260 nm”). 83
  • 2. 84 You will find two types of spectrophotometer in the Biology department. One is a fairly simple “Spec-20” machine which measures only the transmittance or absorbance of visible light (wavelengths above 340 nm) and can be used with square cuvettes, round cuvettes that look like test tubes or even culture tubes used to grow bacteria. We also have computerized SmartSpec spectrophotometers from BioRad. Both of these are UV-VIS spectrophotometers, meaning that they can measure absorbance of either visible or ultraviolet light. The BioRad spectrophotometers require 1 cm square cuvettes. Plastic or glass cuvettes can be used for measuring absorbances in the visible range, but UV light is stopped by plastic and glass, so UV absorbance (below 340 nm) must be measured in expensive, fragile quartz cuvettes or in plastic cuvettes designed expressly for this purpose (which are never quite as efficient as quartz cuvettes). Be sure you are using an appropriate cuvette for the volume of solution you want to measure and for the wavelength you need to use! Using the BioRad spectrophotometers for single-wavelength measurements 1. Turn on the unit using the rocker switch located on the back. 2. Press the l key for single-wavelength measurement. 3. Press 1, to read the absorbance at one wavelength, followed by ENTER. 4. Enter the wavelength that you wish to read. 5. Tell the instrument not to subtract a background measurement. 6. Prepare your blank cuvette and place it into the spectrophotometer. 3 Notice that the light path runs from front-to-back, so you want your cuvette oriented correctly. The cuvette needs to be at least half full, so that your solution is actually in the light path. Additionally, try not to touch the sides of the cuvettes where the light will pass through—you don't want to measure the absorbance of your fingerprints! 7. Press the READ BLANK key and wait a moment while the zero is set. Then press the right arrow key to move on. 3 The job of the blank is to tell the spectrophotometer what “zero” is. If you're planning to measure a colored molecule dissolved in water, then the absorbance of plain water would represent “zero,” and you should use water as your blank. However, you might be dissolving your molecule in a solution which is colored to start with. In that case, your blank should be the solvent with nothing added to it, so that the spectrophotometer will subtract out the color of the solvent itself. 8. Remove your blank cuvette and insert the cuvette with your sample. Press the READ SAMPLE key. Note the absorbance that is displayed. 9. Continue reading as many samples as you have. Determining an absorption spectrum with the BioRad spectrophotometers In some cases, you won’t know in advance the wavelength(s) absorbed by the solution you’re interested in. In that case, the first step would be to measure its absorption spectrum and find out experimentally what wavelengths are absorbed best. The spectrophotometer has a program which will automatically try every wavelength and give you the absorbance at each one. Here's the procedure: 1. After the spectrophotometer warms up, press the SCAN key. 2. Enter the wavelengths that you wish to scan. 3. Press ENTER to choose to not subtract a background setting. 4. Press ENTER to select the ‘slow’ scan.
  • 3. 85 Figure 42. Diagram of a Spec-20 spectrophotometer. 5. Put your blank cuvette in the spectrophotometer and press READ BLANK. 6. Insert your sample cuvette and press the READ SAMPLE key. It will take a few moments to scan. 7. Press the PRINT key to get a small printout of your results. You can press PRINT again for your partner’s notebook. Notice that the wavelengat which your sample had the maximal absorbance (max) is listed near the top. Following absorbance over time with the BioRad spectrophotometers In some cases, you will want to measure how the absorbance of your solution changes over time. This is particularlly useful for enzyme assays where your product (that absorbs light) is being made. Rather than watching the clock and reading out the absorbance as time passes, we can program these spectrophotometers to do that for us. Here's the procedure: 1. After the spectrophotometer warms up, press the KINETICS key. 2. Enter the wavelength that you wish to read. 3. Choose the total duration of the reaction. For example, if you want to collect the absorbance values every five seconds for one minute, enter 60 seconds as the duration. 4. Choose the interval between successive readings. In the example above, this would be five seconds. 5. Press ENTER to choose to not subtract a background setting. 6. Put your blank cuvette in the spectrophotometer and press READ BLANK. 7. Insert your sample cuvette, start the reaction and press the READ SAMPLE key. Wait patiently while the spectrophotometer records your data. 8. Press the PRINT key to get a small printout of your results. You can press PRINT again for your partner’s notebook. Using the Spec-20 spectrophotometer 1. Turn on the spectrophotometer by turning the left knob clockwise until it clicks. Use this knob to adjust the pointer to zero on the transmittance scale (left end of the scale), or to set the digital display to zero in transmittance mode. 2. Let the spectrophotometer warm up for 15 minutes. 3. Use the large knob on top of the spectrophotometer to set the desired wavelength. 4. Again adjust the zero point with the left knob. 5. Place a blank in the sample holder and use the right knob to adjust the reading to 100% transmittance (or zero on the absorbance scale). Remove the blank. 6. If you are using the digital spectrophotometer, use the Mode switch to choose absorbance or transmittance mode as needed. 7. Place your sample in the sample holder and read absorbance or transmittance. Determining concentration with a standard curve There are two ways we could measure the concentration of some unknown solution using the spectrophotometer. The first is to generate a standard curve: a graph of absorbance vs. concentration for standard solutions whose concentrations are known. We then compare the absorbance of an unknown solution (of the same molecule) to that curve. We don’t have to know anything about the molecule in advance. Essentially, we are “calibrating” the spectrophotometer to measure the concentration of the molecule we’re interested in.
  • 4. 86 Figure 43. Standard curve used to determine the concentration of an unknown solution To make a standard curve, you’ll need at least three or four different solutions with known concentrations (called standards). You can come up with these easily by taking a single solution of known concentration and making several different dilutions of it (see the section on measurements and solutions on page 57). Then, measure the absorbance of each known solution and draw a graph, plotting absorbance vs. concentration, as shown in Figure 43. In this graph, concentration is placed on the X-axis, because it’s the independent variable— the one we’re manipulating. The absorbance is on the Y-axis, because it’s the dependent variable: the one whose value depends on the independent variable. The line on this graph represents the relationship between absorbance and concentration. This should not be a “connect-the-dots” line: it needs to be a best-fit straight line. Computer programs like Excel can calculate the equation of the best-fit line for you and so can most scientific calculators. See the graphing section of this manual (page 43)for some help with this. Generally, you want to include (0,0) as one of your points. After generating a standard curve, you can measure the absorbance of the unknown solution and compare it to the absorbances of the known solutions. You could do this by eyeballing where the unknown would fall on the graph, but it’s more accurate to use the equation of the best-fit line (in the form y = mx + b) to calculate the concentration. Here, y is the absorbance, which you measure, x is the concentration that you want to know, and m and b are the slope and intercept of the best-fit line, which Excel will tell you. By solving for x, you can accurately calculate the concentration of the unknown. In order for this calculation to be accurate, the absorbance of the unknown has to fall within the range of absorbances of the known solutions—if it doesn’t, you may have to dilute the unknown, or make different standards and try again. It’s important to note that the relationship between absorbance and concentration is only linear within a certain range, and maxonly when you use the right wavelength of light. The “right” wavelength is ë , or the wavelength at which the molecule absorbs best. If you don’t know which wavelength to use, you maxcan determine ë experimentally by measuring the absorption spectrum as described above. maxThe peak wavelength is ë . Determining concentration by the Beers-Lambert law The second way to measure concentration using the spectrophotometer is really the maxsame as the first, but with a shortcut. If you (or someone else) has already determined ë and drawn a standard curve which shows a linear relationship between absorbance and concentration, then you can calculate a number called the extinction coefficient, which you can always use to find concentration for that molecule under those conditions. The extinction coefficient simply relates concentration to absorbance, using a formula called the Beers-Lambert law. In this equation, the absorbance is equal to the concentration of the molecule of interest (c), times the length of the path the light takes through the cuvette (b; always 1 cm for our spectrophotometers), times the extinction coefficient (g): Abs = gbc The extinction coefficient is the part that is specific for each compound and must be determined experimentally. You can determine it from your standard curve by solving for g, because you know the absorbance and concentration and can measure the width of the cuvette. Once you know g, you can use it for other solutions of the same molecule.