
Recomendados
Recomendados
Más contenido relacionado
La actualidad más candente
La actualidad más candente (20)
Similar a Uncommon truths.....
Similar a Uncommon truths..... (20)
Último
Último (20)
Uncommon truths.....
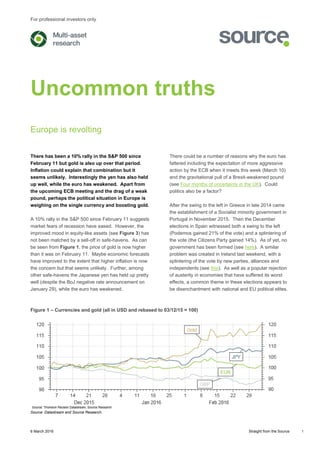
- 1. For professional investors only 6 March 2016 Straight from the Source 1 Uncommon truths Europe is revolting There has been a 10% rally in the S&P 500 since February 11 but gold is also up over that period. Inflation could explain that combination but it seems unlikely. Interestingly the yen has also held up well, while the euro has weakened. Apart from the upcoming ECB meeting and the drag of a weak pound, perhaps the political situation in Europe is weighing on the single currency and boosting gold. A 10% rally in the S&P 500 since February 11 suggests market fears of recession have eased. However, the improved mood in equity-like assets (see Figure 3) has not been matched by a sell-off in safe-havens. As can be seen from Figure 1, the price of gold is now higher than it was on February 11. Maybe economic forecasts have improved to the extent that higher inflation is now the concern but that seems unlikely. Further, among other safe-havens the Japanese yen has held up pretty well (despite the BoJ negative rate announcement on January 29), while the euro has weakened. There could be a number of reasons why the euro has faltered including the expectation of more aggressive action by the ECB when it meets this week (March 10) and the gravitational pull of a Brexit-weakened pound (see Four months of uncertainty in the UK). Could politics also be a factor? After the swing to the left in Greece in late 2014 came the establishment of a Socialist minority government in Portugal in November 2015. Then the December elections in Spain witnessed both a swing to the left (Podemos gained 21% of the vote) and a splintering of the vote (the Citizens Party gained 14%). As of yet, no government has been formed (see here). A similar problem was created in Ireland last weekend, with a splintering of the vote by new parties, alliances and independents (see this). As well as a popular rejection of austerity in economies that have suffered its worst effects, a common theme in these elections appears to be disenchantment with national and EU political elites. Figure 1 – Currencies and gold (all in USD and rebased to 03/12/15 = 100) Source: Datastream and Source Research.
- 2. For professional investors only 6 March 2016 Straight from the Source 2 Figure 2 – US and Eurozone fiscal adjustments and net export contributions to GDP (percent) Note: “Fiscal adjustment” is the change in cyclically adjusted government net borrowing as a percent of GDP. It is a way of capturing the stimulus (+ve) or contraction (-ve) implicit in changes in the government’s fiscal stance. Based on OECD calculations. Source: OECD, Datastream and Source Research. Considering the unemployment rates in these countries (Greece 24%, Spain 21%, Portugal 12% and Ireland 9%), Europe’s politicians have only themselves to blame for this revolt. Figure 2 compares the Eurozone policy stance with that across the Atlantic since the financial crisis: first, the US economy was cushioned by a sizeable net export boost in both 2008 and 2009 while the Eurozone suffered a net export drag in 2009 (the Fed’s actions significantly weakened the dollar) and, second, though fiscal policy was supportive in the Eurozone (automatic stabilisers) it was far more so in the US (the 2009 fiscal adjustment was three times bigger in the US and unemployment is now 4.9%). The euro eventually weakened but the net export boost during 2011, 2012 and 2013 was more than offset by tighter fiscal policy (governments have taken back what the ECB has given). The irony is that the US government was even more austere during those years but by then the US economy was up and running and could withstand the drag. The electorates of these countries may be right to reject austerity: first, with the demand for credit so low and fiscal multipliers so high, expansionary fiscal policy is more likely to be effective than expansionary monetary policy. Second, it is now extremely cheap for governments to borrow money and they could use it to fund economically beneficial investments (education, infrastructure, welcoming refugees etc). Unfortunately, it is not the governments of the above countries that need persuading; it is that of Germany. There is no easy way for the electorates of other countries to impact the politicians of Germany without threatening exit from the Eurozone and/or the EU. The UK Brexit process is muddying the water by encouraging anti-EU sentiment in countries such as France and Denmark. With a string of elections due in the Eurozone during 2016 and French presidential elections in 2017, this is not the time for Eurozone leaders to take their eyes off the ball. Unfortunately, German politicians are more focused on the refugee crisis (watch the state elections taking place today and next weekend) and the Eurozone could be sleep- walking back into crisis (an economic slowdown is all that would be needed to rekindle market speculation). All of the above may be rather alarmist but it must be remembered that the Eurozone project was always going to be difficult: first, fixed exchange rates have a habit of breaking down exactly because one set of countries ends up with high unemployment and, second, without fiscal union it was flawed (open to market attack on individual bond markets). Continued growth is probably the best cure for many of these ills and the ECB stands ready to defend bond markets and the euro (when it isn’t trying to depress it). However, the ECB is unlikely to get the requisite help from governments (less austerity and a move to fiscal union) until then next crisis, by which time it may be too late. I think gold is overvalued and will normalise over time as US yields rise but this sort of backdrop in Europe can only encourage the bulls. -4 -3 -2 -1 0 1 2 3 4 2006 2007 2008 2009 2010 2011 2012 2013 2014 2015 EZ net exports EZ fiscal adjustment US net exports US fiscal adjustment
- 3. For professional investors only 6 March 2016 Straight from the Source 3 Figure 3 – Asset class total returns Source: MSCI, Datastream and Source Research. Notes: *The currency section is organised so that in all cases the numbers show the movement in the mentioned currency versus USD (+ve indicates appreciation, -ve indicates depreciation). Data as at 04/03/2016 Current Index Level/RY 1w 1m QTD YTD 1w 1m QTD YTD Equities World MSCI 387 3.8 4.4 -2.6 -2.6 3.2 4.2 -3.2 -3.2 Emerging Markets MSCI 791 6.9 7.1 -0.2 -0.2 4.8 5.8 -0.4 -0.4 US MSCI 1900 2.8 4.6 -2.1 -2.1 2.8 4.6 -2.1 -2.1 Europe MSCI 1444 4.1 2.9 -4.6 -4.6 2.8 4.5 -4.3 -4.3 Europe ex-UK MSCI 1654 3.9 2.7 -5.3 -5.3 3.1 3.8 -6.3 -6.3 UK MSCI 1071 4.6 3.4 -3.1 -3.1 2.0 6.0 0.4 0.4 Japan MSCI 2638 5.1 2.1 -6.0 -6.0 5.0 -0.8 -11.1 -11.1 Government Bonds World BofA-ML 0.82 0.2 0.8 4.6 4.6 -0.2 0.6 2.9 2.9 Emerging Markets JPM 7.00 4.2 3.5 5.2 5.2 1.1 1.3 3.5 3.5 US (10y) Datastream 1.88 -1.0 -0.1 3.7 3.7 -1.0 -0.1 3.7 3.7 Europe Bofa-ML 0.71 0.8 -1.2 3.0 3.0 0.0 0.2 1.6 1.6 Europe ex-UK (EMU, 10y) Datastream 0.24 -0.2 -0.8 5.8 5.8 -0.9 0.7 4.5 4.5 UK (10y) Datastream 1.49 1.8 -1.7 0.8 0.8 -0.7 0.8 4.5 4.5 Japan (10y) Datastream -0.05 0.0 4.1 9.1 9.1 -0.1 1.1 3.2 3.2 IG Corporate Bonds Global BofA-ML 2.98 0.6 0.2 1.4 1.4 0.2 0.5 1.0 1.0 US BofA-ML 3.60 0.2 0.6 1.1 1.1 0.2 0.6 1.1 1.1 Europe BofA-ML 1.27 1.0 -0.8 2.5 2.5 0.2 0.7 1.1 1.1 UK BofA-ML 3.63 2.9 -2.7 -3.1 -3.1 0.3 -0.2 0.5 0.5 Japan BofA-ML 0.22 0.0 3.0 6.4 6.4 -0.1 0.0 0.7 0.7 HY Corporate Bonds Global BofA-ML 8.47 2.8 2.7 1.1 1.1 2.6 3.1 1.1 1.1 US BofA-ML 8.80 3.1 3.8 1.3 1.3 3.1 3.8 1.3 1.3 Europe BofA-ML 5.67 2.2 -0.5 0.7 0.7 1.5 1.0 -0.6 -0.6 Cash (Overnight LIBOR) US 0.37 0.0 0.0 0.1 0.1 0.0 0.0 0.1 0.1 Euro Area -0.29 0.6 -1.8 1.3 1.3 0.0 0.0 0.0 0.0 UK 0.48 2.6 -2.4 -3.4 -3.4 0.0 0.0 0.1 0.1 Japan -0.04 0.2 2.6 5.8 5.8 0.0 0.0 0.0 0.0 Real Estate (REITs) Global FTSE 1679 4.1 4.3 -0.3 -0.3 3.3 5.8 -1.6 -1.6 Emerging Markets FTSE 1629 7.5 9.6 -3.0 -3.0 6.7 11.2 -4.3 -4.3 US FTSE 2813 3.8 3.6 -0.1 -0.1 3.8 3.6 -0.1 -0.1 Europe ex-UK FTSE 2910 2.9 1.2 -0.5 -0.5 2.2 2.7 -1.8 -1.8 UK FTSE 1046 3.4 -0.1 -3.5 -3.5 2.7 1.4 -4.8 -4.8 Japan FTSE 2637 1.6 4.0 5.4 5.4 1.5 1.1 -0.3 -0.3 Commodities All GSCI 2091 4.9 4.0 -3.7 -3.7 - - - - Energy GSCI 335 7.3 5.4 -9.0 -9.0 - - - - Industrial Metals GSCI 1019 5.1 5.9 6.7 6.7 - - - - Precious Metals GSCI 1548 4.4 9.4 19.2 19.2 - - - - Agricultural Goods GSCI 439 1.8 -0.7 -2.5 -2.5 - - - - Currencies (vs USD)* EUR 1.10 0.6 -1.8 1.3 1.3 - - - - JPY 113.76 0.2 2.7 5.8 5.8 - - - - GBP 1.42 2.5 -2.5 -3.6 -3.6 - - - - CHF 1.01 0.3 -0.1 0.8 0.8 - - - - CNY 6.51 0.5 0.9 -0.2 -0.2 - - - - Total Return (USD, %) Total Return (Local Currency, %)
- 4. For professional investors only 6 March 2016 Straight from the Source 4 Figure 4 – Equity sector total returns relative to local market Data as at 04/03/2016 US Europe 1w 1m QTD YTD 1w 1m QTD YTD Oil & Gas 3.0 1.7 3.6 3.6 2.8 5.0 11.4 11.4 Materials 0.6 0.9 1.8 1.8 2.9 5.4 4.9 4.9 Basic Resources 8.0 15.2 21.8 21.8 13.3 20.8 24.8 24.8 Chemicals -0.6 -1.6 -0.5 -0.5 -1.2 -0.3 -1.9 -1.9 Industrials -0.2 1.7 3.0 3.0 0.9 2.2 4.2 4.2 Construction & Materials 0.5 6.8 6.0 6.0 0.3 1.1 3.6 3.6 Industrial Goods & Services 0.0 1.3 3.1 3.1 1.0 2.5 4.4 4.4 Consumer Discretionary -0.2 1.2 -0.1 -0.1 0.0 0.8 -0.4 -0.4 Automobiles & Parts 3.9 7.9 -4.1 -4.1 5.5 8.1 -4.9 -4.9 Media 0.5 -2.2 3.2 3.2 -2.0 -1.9 1.8 1.8 Retail -1.0 1.6 -1.4 -1.4 0.5 0.6 3.5 3.5 Travel & Leisure -1.3 0.7 0.5 0.5 -2.3 -0.2 0.2 0.2 Consumer Staples -0.8 0.0 4.9 4.9 -1.2 -2.5 5.0 5.0 Food & Beverages -0.6 0.8 3.6 3.6 -1.4 -4.4 2.7 2.7 Personal & Household Goods -0.4 0.5 7.4 7.4 -1.9 -1.8 5.4 5.4 Healthcare -2.5 -2.0 -4.8 -4.8 -3.5 -1.3 -3.5 -3.5 Financials 1.8 0.2 -4.9 -4.9 1.8 0.6 -7.1 -7.1 Banks 2.7 -0.7 -10.0 -10.0 2.9 2.1 -8.8 -8.8 Financial Services 2.1 3.0 -4.5 -4.5 -0.1 1.3 -3.8 -3.8 Insurance 0.0 0.0 -2.7 -2.7 0.8 -1.1 -6.4 -6.4 Real Estate 1.3 -1.2 0.0 0.0 0.1 -3.7 -0.2 -0.2 Technology 0.2 -0.3 -0.9 -0.9 -1.6 -2.5 -0.9 -0.9 Telecommunications -0.6 -0.7 14.4 14.4 -0.8 -2.6 1.1 1.1 Utilities -0.7 -3.1 10.8 10.8 -2.1 -6.8 -0.4 -0.4 We use a sector classification created by merging the two main systems used by Standard & Poors (S&P) for the US and Stoxx for Europe. We have decided to classify our 10 top level industries using categories that most closely resemble the Global Industry Classification Standard (GICS) and at the level below that (super sectors) we are using the Industry Classification Benchmark (ICB). The former is used for the S&P 500 index and the latter for the Stoxx 600, our benchmark indices. The two systems overlap in most cases and the only material difference seems to be in the consumer sectors. Therefore, we define consumer staples as the aggregate of personal & household goods and food & beverage, while consumer discretionary includes automobiles & parts, media, retail and travel & leisure. For the rest, we assume 100% overlap for the corresponding top level sectors. Source: Datastream and Source Research
- 5. For professional investors only 6 March 2016 Straight from the Source 5 Figure 5 – Upcoming macro events Country Event Name Period Unit Consensus Prior Monday – 7 th March Japan Leading Index Jan 101.6 102.1 Germany Factory Orders MM Jan % -0.4 -0.7 Eurozone Sentix Investor Confidence Index Mar 8.2 6.0 Tuesday – 8 th March Japan Current Account Balance SA Jan ¥bn 1654.8 1635.4 Japan GDP Final QQ Q4 % -0.4 -0.4 China Foreign Reserves Feb $bn 3190 3231 China Trade Balance Feb $bn 50.8 63.3 China Exports YY Feb % -15.0 -11.2 Australia NAB Business Confidence Feb 2 Japan Consumer Confidence Index Feb 42.2 42.5 Japan Economy Watchers Survey Feb 47.5 46.6 Germany Industrial Production MM Jan % 0.5 -1.2 France Trade Balance, SA Jan €bn -3.9 France Current Account Jan €bn -0.7 Spain Industrial Production Cal Adj YY Jan % 3.7 3.7 Eurozone GDP Revised QQ Q4 % 0.3 0.3 United States NFIB Small Business Optimism Feb 94.2 93.9 Wednesday – 9 th March Japan Machine Tool Orders YY Feb % -17.2 France Bank of France Business Sentiment Feb 101 United Kingdom Industrial Production MM Jan % 0.5 -1.1 Brazil IPCA Inflation YY Feb % 10.8 10.7 Canada BoC Rate Decision % 0.50 0.50 Thursday – 10 th March Japan PPI YY Feb % -3.4 -3.1 China CPI YY Feb % 1.8 1.8 China PPI YY Feb % -4.9 -5.3 Germany Trade Balance SA Jan €bn 17.5 19.0 Germany Exports MM Jan % 0.8 -1.4 France Industrial Production MM Jan % 0.7 -1.6 Eurozone ECB Deposit Facility Rate % -0.40 -0.30 United States Federal Budget Balance Feb $bn -200.0 55.2 Friday – 11 th March Japan MOF Business Conditions (All Ind) Q1 4.6 Germany HICP Final YY Feb % -0.2 -0.2 Spain CPI Core YY Feb % 0.9 Italy Industrial Production MM Jan % 0.8 -0.7 United Kingdom Trade Balance Jan £bn -3.0 -2.7 Saturday – 12 th March China Retail Sales YTD YY Feb % 10.9 10.7 China Industrial Output YTD YY Feb % 5.6 6.1 Source: Bloomberg and Thomson Reuters
- 6. For professional investors only 6 March 2016 Straight from the Source 6 Figure 6 – Source Multi-Asset Portfolio Source: Source Research Note: This is a simulated portfolio (See the latest The Big Picture for more details). Arrows indicate latest changes in allocation. Neutral Policy Range Allocation Position vs Neutral Hedged Currency Cash 5% 0-10% 10% Cash 2.5% 10% Gold 2.5% 0% Bonds 45% 10-80% 35% Government 30% 10-50% 20% US 10% 8% Europe ex-UK (Eurozone) 8% 5% UK 2% 1% Japan 8% 2% Emerging Markets 2% 4% Corporate IG 10% 0-20% 5% US Dollar 5% 3% Euro 3% 1% Sterling 1% 1% Japanese Yen 1% 0% Corporate HY 5% 0-10% 10% US Dollar 4% 8% Euro 1% 2% Equities 45% 20-70% 49% US 25% 20% Europe ex-UK 7% 14% 100% USD UK 4% 4% Japan 4% 8% Emerging Markets 5% 3% Real Estate 3% 0-6% 6% US 1% 1% Europe ex-UK 1% 2% UK 0.5% 0% Japan 0.5% 2% Emerging Markets 0% 1% Commodities 2% 0-4% 0% Energy 1% 0% Industrial Metals 0.3% 0% Precious Metals 0.3% 0% Agriculture 0.3% 0% Total 100% 100% Currency Exposure USD 49% 60% 1 EUR 21% 11% -2 GBP 8% 7% -1 JPY 14% 13% 0 EM 7% 9% 1 Total 100% 100%
- 7. For professional investors only 6 March 2016 Straight from the Source 7 Figure 7 – Source sector strategy US Europe Preferred Neutral Source Neutral Source Region Oil & Gas 6.5% Underweight 5.5% Underweight Europe Materials 2.0% Underweight 5.7% Overweight Europe Basic Resources 0.3% Underweight 1.6% Underweight US Chemicals 1.7% Underweight 4.1% Overweight Europe Industrials 11.0% Underweight 12.9% Neutral Europe Construction & Materials 0.4% Underweight 2.5% Neutral Europe Industrial Goods & Services 10.6% Underweight 10.4% Neutral Europe Consumer Discretionary 16.0% Overweight 12.1% Overweight US Automobiles & Parts 1.0% Underweight 3.1% Underweight US Media 3.2% Neutral 3.1% Overweight Europe Retail 8.8% Overweight 4.0% Overweight US Travel & Leisure 3.0% Overweight 1.9% Overweight US Consumer Staples 10.8% Neutral 17.8% Neutral US Food & Beverages 4.9% Overweight 9.0% Neutral US Personal & Household Goods 5.8% Neutral 8.8% Underweight US Healthcare 13.7% Underweight 11.4% Underweight US Financials 17.0% Overweight 20.7% Overweight Europe Banks 5.6% Overweight 11.4% Overweight Europe Financial Services 5.0% Underweight 1.9% Neutral Europe Insurance 3.5% Overweight 5.7% Overweight Europe Real Estate 2.9% Underweight 1.7% Neutral Europe Technology 17.2% Neutral 3.9% Neutral US Telecommunications 2.6% Overweight 5.3% Overweight Europe Utilities 3.2% Underweight 4.6% Overweight Europe Source: Datastream and Source Research. Notes: See the latest Source Sector Selector for more details. Arrows indicate latest changes in recommendations.
- 8. For professional investors only 6 March 2016 Straight from the Source 8 Authors Paul Jackson Head of Research T. + 44 (0)20 3370 1172 E. paul.jackson@sourceETF.com András Vig Director T. + 44 (0)20 3370 1152 E. andras.vig@sourceETF.com Important information Investors in Source products should note that the value of your investment may go down as well as up. As a result you may not get back the amount of capital you invest. This document is for discussion purposes only and is intended for institutional investors (professional clients) pursuant to Directive 2004/39/EC (MIFID) Annex II Section I. Without limitation this document does not constitute an offer or a recommendation to enter into any transaction. The calculations and charts set out herein are indicative only, make certain assumptions and no guarantee is given that future performance or results will reflect the information herein. Past performance is not a guarantee of future performance. Simulated performance is not necessarily indicative of future performance. Simulated performance results may have many inherent limitations. Performance may be volatile, and an investor could lose all or a substantial portion of his or her investment. When making an investment decision, you should rely solely on the final documentation and any prospectus relating to the transaction and not this information document. Investment strategies involve numerous risks. The directors of Source UK Services Limited, Source Investment Management Limited, Fund Source (US) LLC and Source Exchange Traded Investments LLC (collectively and separately “Source”) do not guarantee the accuracy and/or the completeness of any data included herein and Source shall have no liability for any errors, omissions, or interruptions herein. Source makes no warranty, express or implied, as to the information described herein. All data and performance shown is historical unless otherwise indicated. Investors should consult their own business, tax, legal and accounting advisors with respect to this proposed transaction and they should refrain from entering into a transaction unless they have fully understood the associated risks and have independently determined that the transaction is appropriate for them. In no way should Source be deemed to be holding itself out as a financial adviser or a fiduciary of the recipient hereof and this document is not intended to be "investment research" as defined in the Handbook of the UK Financial Conduct Authority; nor is it intended to be “research” as defined in relevant U.S. securities laws and rules. Source, Source’s shareholders, or employees of Source or its shareholders may from time to time have long or short positions in securities, warrants, futures, options, derivatives or financial instruments referred to in this material. As a result, investors should be aware that Source may have a conflict of interest that could affect the objectivity of this report. Investors should consider this report as only a single factor in making their investment decision. This communication is only intended for and will be only distributed to persons resident in jurisdictions where such distribution or availability would not be contrary to local laws or regulations. This communication is provided by Source UK Services Limited, 110 Cannon Street, London EC4N 6EU, authorised and regulated by the Financial Conduct Authority. © 2016 Source UK Services Limited. All rights reserved.