Former NY District Attorney Robert M. Morgenthau: Justice for Immigrants
•
0 recomendaciones•405 vistas


Recomendados
Más contenido relacionado
Último
Último (20)
Destacado
Destacado (20)
Former NY District Attorney Robert M. Morgenthau: Justice for Immigrants
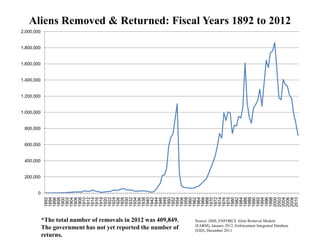
- 1. Aliens Removed & Returned: Fiscal Years 1892 to 2012 2,000,000 1,800,000 1,600,000 1,400,000 1,200,000 1,000,000 800,000 600,000 400,000 200,000 0 1892 1894 1896 1898 1900 1902 1904 1906 1908 1910 1912 1914 1916 1918 1920 1922 1924 1926 1928 1930 1932 1934 1936 1938 1940 1942 1944 1946 1948 1950 1952 1954 1956 1958 1960 1962 1964 1966 1968 1970 1972 1974 1976 1978 1980 1982 1984 1986 1988 1990 1992 1994 1996 1998 2000 2002 2004 2006 2008 2010 *The total number of removals in 2012 was 409,849. Source: DHS, ENFORCE Alien Removal Module (EARM), January 2012, Enforcement Integrated Database The government has not yet reported the number of (EID), December 2011 returns.
- 2. Trends in Charges Brought by ICE in Immigration Court Most Serious Percent of Total (First Quarter) Deportation Charges in Immigration Charge Court, FY 2012 (1st Quarter) FY 2010 Q1 FY 2011 Q1 FY 2012 Q1 Total 100% 100% 100% Individuals Charged National 0.03% 0.02% 0.01% Security Criminal 17.3% 15.9% 14.0% Immigration 81.2% 82.2% 83.8% Only Source: TRAC Immigration
- 3. Most Serious Charges Recorded for ICE Detainees Ordered by Frequency Rank Most serious charge for those with criminal conviction(s) 1 Driving Under Influence Liquor 2 Traffic Offense 3 Marijuana - Possession 4 Cocaine - Possession 5 Dangerous Drugs Source: TRAC Immigration
- 4. Immigration Court Backlog: Fiscal Years 1998-2012 350,000 300,000 250,000 200,000 150,000 100,000 50,000 0 1998 1999 2000 2001 2002 2003 2004 2005 2006 2007 2008 2009 2010 2011 2012 Source: TRAC Immigration
- 5. Pending Cases as of End of Fiscal Year 2012 Court Backlog 325,044 % Change end of FY 2011 9.2% % Change end of FY2010 23.7% % Change end of FY 2009 45.2% % Change end of FY 2008 74.7%
- 6. Immigration Court Backlog: Fiscal Years 1998-2013 Length of Wait (Average Days) 600 545 531 489 500 447 438 430 422 415 413 406 413 400 380 382 381 364 324 300 200 100 0 1998 1999 2000 2001 2002 2003 2004 2005 2006 2007 2008 2009 2010 2011 2012 2013 Source: TRAC Immigration
- 7. Prosecutorial Discretion Closures as of December 31, 2012 Court Backlog Cases Closed Based on Closures as a Percent of Prosecutorial Backlog Discretion 325,044 13,407 4.1% • As of the end of December 2012, these closures were taking an average of 885 days across all months since the program has been in effect, rising an average of 10 days in December. • Those closed just in December involved time pending in court of, on average, a full three years, or 1,011 days. Source: TRAC Immigration
- 8. Government Spending on Immigration Enforcement • In FY 2012, spending on immigration enforcement (including ICE and Customs & Border Patrol) reached nearly $18 billion. • This amount exceeds by approximately 24% total spending for the FBI, DEA, Secret Service, US Marshals Service, and ATF – which stood at $14.4 billion in FY 2012. Source: Doris Meissner & Donald M. Kerwin, et al., Immigration Enforcement in the United States: The Rise of a Formidable Machinery, Migration Policy Institute (Jan. 2013)
- 9. Secure Communities & Fingerprinting • FBI has sent over 16 million fingerprints received from local law enforcement agencies to the immigration database since program inception in 2008. • More than 900,000 flagged as potential immigration violators. • No information regarding what actions are taken, if any, with a set of prints when an arrest is dismissed. • Makowski v. Holder, et al., No. 12-cv-05265 (N.D. Ill. filed July 3, 2012)
- 10. Impact on Undocumented Families • 10.2 million undocumented adults living in the U.S. • 63% have been living in the U.S. for 10 years or more. • 9 million families in the U.S. consist of an undocumented parent and a U.S. citizen child. • In the first six months of 2011, ICE removed more than 46k noncitizens who claimed to have a U.S. citizen child. • As of November 2011, 5,200 children were living in foster care as the result of a parent being deported.