•Conducted a thorough analysis of changes in domestic and international flow of trade as a result of the 2012 U.S. corn shortage.
•Demonstrated the 2012 drought impact on consumer product pricing.
•Developed written presentation opposing a U.S. increase in ethanol blend rates.
1. Introduction
United States agriculture is currently under the most severe and extensive drought
in at least the last twenty-five years, and arguably ever. As a result, corn crops are not
yielding the bushels that producers or consumers expected and therefore cascading
negative impacts in sectors of our economy from fuel prices to the livestock sector. It is
important to analyze corn because it is without a doubt the largest component of
international coarse-grain trade, accounting for three-quarters of total volume in recent
years (USDA 1). The United States is the world’s largest producer and exporter of corn,
with the Corn Belt states contributing to 1/3 of the overall crop (USDA 1). Meaning, any
slight changes in supply can have a profound effect on both domestic and international
prices. Newly found uses of corn have manifested high global demand for the crop and,
in response, motivated American farmers to plant the largest corn crop ever this year
(Jonsson 2). The United States was supposed to be up to the neck in corn this fall, with
favorable planting conditions supporting high-planted acreage couple with expectations
of record production. However, Mother Nature had different plans. She presented one of
the nastiest droughts to date, with the majority of the impact hitting the Corn Belt states.
What was so detrimental to the crop was the fact that the drought came at the worst time
possible. The severity of the drought increased in early July, which is a critical time for
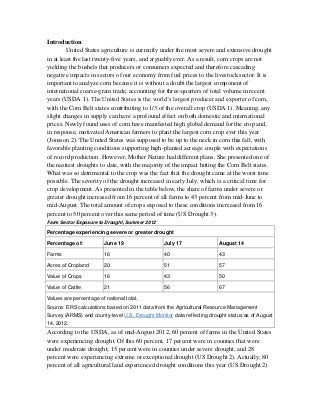
crop development. As presented in the table below, the share of farms under severe or
greater drought increased from 16 percent of all farms to 43 percent from mid-June to
mid-August. The total amount of crops exposed to these conditions increased from 16
percent to 50 percent over this same period of time (US Drought 3).
Farm Sector Exposure to Drought, Summer 2012
Percentage experiencing severe or greater drought
Percentage of:
June 19
July 17
August 14
Farms
16
40
43
Acres of Cropland
20
51
57
Value of Crops
16
43
50
Value of Cattle
21
56
67
Values are percentage of national total.
Source: ERS calculations based on 2011 data from the Agricultural Resource Management
Survey (ARMS) and county-level U.S. Drought Monitor data reflecting drought status as of August
14, 2012.
According to the USDA, as of mid-August 2012, 60 percent of farms in the United States
were experiencing drought. Of this 60 percent, 17 percent were in counties that were
under moderate drought; 15 percent were in counties under severe drought, and 28
percent were experiencing extreme or exceptional drought (US Drought 2). Actually, 80
percent of all agricultural land experienced drought conditions this year (US Drought 2).
2. The true severity of this year’s drought can be seen in the USDA’s continualworsening
outlook in corn yield as the year progressed. The National Agricultural Statistics Service
(NASS) reduced corn production estimates by 27.5 percent from May to November,
reflecting considerable reductions in crop yields per harvested acre. On May 20th, NASS
reported that over 75 percent of the corn crop was rated good to excellent. By September
30th, only 25 percent of the crop was rated good to excellent with 50 percent rated poor or
very poor (US Drought 5). At planting time this year, suggested corn yields were to
average a record 166 bushels per acre. That estimate was lowered 20 bushels per acre in
July, another 22.6 bushels per acre on August 10th, 0.6 bushels per acre lower on
September 12th, yet another 0.8 bushels on October 11th, and finally raised a small 0.3
bushels per acre in November. When all was said and done, 122.3 bushels per acre was
the forecasted yield, the lowest since 1995. As of November 4th, 95 percent of the corn
crop was already harvested, compared to the previous five-year average of only 71
percent by this time. At the start of the season, corn production was supposed to reach
14.8 billion bushels, but now estimates point to a lower number of 10.7 billion. Total
corn supplies were forecasted in the November 9 WASDE report at 11.8 billion bushels,
which would 13 percent below last year’s supply. Finally, the price per bushel of corn
for the 2012/13 marketing year was forecasted to fall within a range of $6.95-$8.25,
which is the highest price range ever in nominal terms (US Drought 6).
Although the Corn Belt states were hit the hardest, some areas of the country were
able to produce some impressive yields. For example, the average acre in Illinois is
projected to reap 98 bushels, a 24 year low. On the other hand, production in North
Dakota jumped 80 percent and Mississippi yielded a record high. Although this is
encouraging, these “diamonds in the rough” are not enough to offset the drought
elsewhere in the country. These astounding numbers, coupled with the understanding of
the United State’s critical role in the supply of corn, a great deal of change can be
expected to manifest itself not only domestically, but internationally as well. Changes in
the flow of grain can help us better understand some of the consequences that this
drought has brought along with it.
Changes in the Flow of Grain
Due to the severely limited supply of corn in the United States, markets cannot be
expected to behave the same as they have in the past. As mentioned above, although
some states suffered greatly from this year’s drought, others were able to build up a fair
amount of supply. Occasionally, Corn Belt states import corn, but this level is
unprecedented. For example, Alton Grain Terminal in Hillsobro, North Dakota only sent
one of it’s ten shuttle trains, loaded with four million bushels (or 1% of the state’s crop),
to the Pacific Northwest. Usually all of this terminal’s corn is shipped to Asia. Rather, the
remaining nine shuttle trains were rerouted to Decatur, Illinois and St. Louis, Missouri
and other Midwest destinations (Ingwersen 2). Some southern states are shipping barges
of corn up the Mississippi River to the middle of the country, reversing the normal trade
flow. This unusual grain flow could be warning that a rush for quality corn supplies will
3. be upon us in the coming months as end-users try to deal with the smallest United States
harvest in six years (Ingwersen 1). However, thanks to crop insurance, many farmers
have protected themselves against this crop failure.
As reported by the Bureau of Labor and Statistics, United States’ export prices for
corn rocketed almost 128 percent above the 20-year historical average. Exports prices
also hit the highest level since the import and export price index series began in
December 1984 (Adonizio 1). Unlike farmers in the United States, the ones that are really
hurting are developing countries reliant on corn imports and their poorest citizens, who
often use more than half of their income to buy food (Wise 1).Global food supply is
dependent on United States corn because it is used for food, animal feed, cooking oil, and
even motor fuel. Higher prices and a decrease in supply mean that poorer, import-reliant
countries may not be able to restock their food supply. In all, it is estimated that the
global grain supply is down 180 million metric tons. Dan Basse, president of Ag
Resources, said “The poor in the world are going to see tremendous pressure on their
budgetary expenditure for calories. This has become a very scary situation, particularly
for those in the world who are impoverished” (Jonsson 1). We can use historical data to
model and guess what is likely to evolve due to the increased prices. During the price
spike of 2008, the least developed countries imported $26.6 billion of agricultural goods,
but only exported $9.1 billion, causing an agricultural trade deficit of $17.5 billion for
these countries. Deficits bring about a whole mess of problems including squeezed
government budgets, limited foreign exchange reserves, and further exposing the poor to
food price increases. Even net exporters are not safe. In Uganda, heightened international
corn prices eventually maneuvered it’s way to local markets, leaving the heavily corn
based consumption country to be labeled as “food insecure” (Wise 1-3). As presented in
the figure below, the major difference from the drought of 2008 and today is the shift in
how corn is used; domestic feed and residual use is on the decline and ethanol use is on
the rise (Adonizio 2).
4. Although United States production of corn is critical, it is not a monopoly; these
unfortunate countries understand that other opportunities and strategies exist to combat
rising import costs. Those countries have the ability to implement internal policy changes
that adjust prices or the availability of competing products. Corn is generally not the only
feed option; wheat, nongrain feedstuffs, and low-protein content meals can also
purchased as a substitute for corn. Of course, this flexibility is constrained by types of
animals fed, local preferences, and import tariffs and laws. Import countries may switch
suppliers of the same grain based on price, quality, availability, credit, or other trade
services (USDA 7). The United States recognizes this position and implements ways to
maintain their export levels by promoting and facilitating the purchase of United States
feed grains in foreign markets. First, the Export Credit Guarantee Program, finances
United States agricultural exports by guaranteeing repayment of private, short-term credit
for up to three years. Next, the Market Access Program (MAP), helps in the creation,
expansion, and maintenance of foreign markets United States agricultural products.
Finally, the Foreign Market Development Program, also creates, expands, and maintains
long-term export markets for United States agricultural products (USDA 11). There is no
denying, however, that this abnormal year will have a profound impact on our exports.
Exports are projected to fall to 1.3 million bushels, compared with the estimated 1.55
billion this and 1.83 billion from last year (High Corn 1).Price changes to this degree tend
to have a big impact not only on the flow of trade but also on the prices of other
commodities that are dependent on corn as an input.
Prices of Related Goods
With current corn prices being 21 percent higher than they were a year ago, for
what products can we expect to see a change in price (Rapier 1)? According to the
USDA, retail food price changes are expected to react increased corn costs in 2013.
However, animal-based products such as beef, pork, poultry, and dairy could show an
increase in price as early as the end of the fourth quarter this year. Packaged and
processed foods including cereal and corn flour will likely not see the effects of increased
corn prices for another ten to twelve months (US Drought 1). Historically, the Bureau of
Labor Statistics correlates a 50 percent increase in corn prices with an increase in the
Consumer Price Index (CPI) by 0.5 to 1 percent. Over the last twenty years, retail food
price inflation has averaged 2.5 to 3 percent each year. Next year, expect to see an
increase in this average with price inflation expecting to be in between 3 and 4 percent
(US Drought 2).
Drought induced, high feed prices are going to likely restrain growth of United
States cattle and hog breeding herds along with poultry and milk production. This is
causing feedlot operators to pay lower prices for cattle to offset high feed costs and
reduced availability of pastures; predicting to keep cattle prices at the mid to upper $140
range for into 2013 (US Drought 8). Some producers are starting understand these supply
squeeze relationships already, by booking corn from Brazil in order to pay a smaller input
cost (Ingwersen 1). There are also ways to capitalize on an opportunity like this. As
5. Shawn Hackett of Hackett Financial Advisors said, “you may want to make room in your
freezer for meat because prices for beef and pork are expcted to drop in the next few
months as farmers slaughter herds to deal with the high cost of grains that are used in
livestock feed. However, everything from milk to salad dressing is going to cost more in
the near term, and eventually the meat deals will evaporate as demand outstrips supply”
(Tahmincioglu 1).
To better understand the true cost drivers of the corn by-products, it is useful to
comprehend how much of an input is needed to produce one unit of output (with a bushel
of corn equaling 56 pounds of shelled corn). The average steer is fed 20 pounds of corn a
day for 160 days before being slaughtered, totaling 3,200 pounds of corn. The steer will
provide, on average, 600 pounds of beef, which means it takes about 5.3 pounds of corn
to produce a pound of beef or a little over nine percent of a bushel. At $8 a bushel, there
is $.72 of corn in one pound of beef. A hen eats about one-eight of a pound of corn a day,
or 46 pounds a year. This is equivalent to four-fifths of a bushel, or about $6.51 worth of
corn. During this time, the hen will lay about 250 eggs. Hence, the cost per egg comes
out to be about two and a half cents. In order to raise a hog for pork, 448 pounds of corn
is needed for feed and this will yield 210 pounds of pork. About 1.1 pounds of corn is
required to make a half-pound of bacon or about 16 cents worth of corn. Cows require
12,810 pounds of corn and will produce roughly 5,814 gallons of milk during her
lifetime. This equates to 2.2 pounds of corn per gallon or about 32 cents in a gallon of
milk. With these analytics it is easy to understand the true value coming out of a change
in the price of corn.