
Recomendados
Más contenido relacionado
La actualidad más candente
La actualidad más candente (20)
Destacado
Destacado (19)
Similar a Graphing Rational Functions
Más de RyanWatt
Más de RyanWatt (20)
Último
Último (20)
Graphing Rational Functions
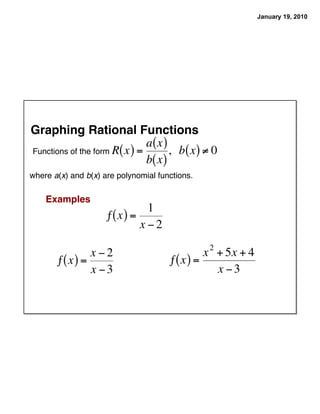
- 1. January 19, 2010 Graphing Rational Functions Functions of the form where a(x) and b(x) are polynomial functions. Examples
- 2. January 19, 2010 Graphing Rational Functions Appearance Where n is even, the Where n is odd, the graph looks like this: graph looks like this:
- 3. January 19, 2010 Graphing Rational Functions Sketching (7 steps) Step 1: Find the y-intercept (let x = 0) Step 2: Factor everything. (Use rational roots theorem if necessary.) Step 3: Find the roots of the function by finding the roots of the numerator a(x). Step 4: Find the vertical asymptotes by finding the roots of the denominator b(x).
- 4. January 19, 2010 Graphing Rational Functions Step 5: Find the horizontal asymptotes by dividing each term in the function by the highest power of x, and take the limit as x goes to infinity. (Use the UNfactored form.) You will find that, in general, there are three possible results: i When [degree of numerator < degree of denominator] the horizontal asymptote is y = 0. ii When [degree of numerator = degree of denominator] the H.A. is the ratio leading coefficient of a(x) leading coefficient of b(x) iii When [degree of numerator > degree of denominator] there is no horizontal asymptote; however there may be a slant asymptote or a hole in the graph.
- 5. January 19, 2010 Graphing Rational Functions Sketching (7 steps) Step 6: Determine the sign of the function over the intervals defined by the roots and vertical asymptotes. (Use the factored form.) Step 7: Sketch the graph.
- 6. January 19, 2010 Graphing Rational Functions Sketching: Example 1 of 4 Step 1: Step 5: Step 6: Step 2: Step 3: Step 7: Step 4:
- 7. January 19, 2010 Step 5:
- 8. January 19, 2010 Sketch the graph of
- 10. January 19, 2010
- 11. January 19, 2010 Graphing Rational Functions Sketching: Example 2 of 4 Step 5: Step 1: Step 6: Step 2: Step 7: Step 3: Step 4:
- 12. January 19, 2010 Step 5: