SlideShare una empresa de Scribd logo
1 de 26
Descargar para leer sin conexión
DataMan
DataMan is an application that allows you to upload files to a data repository, but also to work
with databases for geospatial data.
DataMan application menu (left) allows the operation of databases with different database
tables and files imported to the server.
Submenu for each item can be displayed / hidden using the arrow symbol
Database
DataMan allows to work with any number of existing databases. For database there are the
following operations:
• Adding references to ODBC database
• Add a reference to the PostGIS database
• Add a reference database, GeoMedia
The procedure for adding references to databases
• To add references to the database click on the link "Add database xxx" for the type of
database
• Fill in the parameters and let the database store
• Testing of the connection by clicking on "Test"
• Deleting references clicking on delete
Tables
In the attached database you can create or edit a table:
• Select the database
• To create a new table click on "Create table" – it opens "Table Editor"
• Enter the name of the table
• Select the type of geometry or table without geometry
• Add additional items of the table by clicking on the link "Add Item"
• Table ready to confirm with "OK"
For existing tables in the database it is possible to
• browse the structure - icon
• delete - icon
• change the structure - the icon
• view the map (in the case of geographic data) - icon
Files
After clicking on "Files" in the left menu of DataMan you can see a list of available files on
the server and available tools.
For uploading files to a server (provide next steps
• click on "Upload file" – it will display a window with information about free space on
the server
•
• click on the search button
• select your preferred file
•
• upload the file to the server
•
• the uploaded file to add metadata
•
For the files on the server, you have the next functions:
• view information about a file - icon
• download the file to your computer - icon
• delete a file from the server - icon
• preview file in map window (for geo-data) - icon
• import the file into a database (currently only the vector data in SHP files) - icon
• transform the file into another coordinate system / projection - icon
MapMan - module for creating and publishing of maps compositions
MapMan allows integration of data accessible through standard web services (WMS, WFS),
together with spatial data stored in databases and files on internal servers. All these data
sources can be used for creating map compositions in a web environment. Such newly
created composite map can be displayed by the user in several ways - either in standard web
browsers (Open Layers, GoogleMap, DHTML client) or on a desktop browser (GoogleEarth).
Important is the opportunity to publish these new compositions as a completely new web
service - WMS or WFS.
You can edit Map composition or selecting existing composition from the list or clicking on
button Create project.
Creating new composition
After you click on "Create Project" you can edit basic information about the composition.
There are 3 basic components:
• Information about the project
• Layers - definition of content composition
• Symbols- definition of project presentation
The link "Show Map" allows viewing of the processed project in a separate map window
using HSLayers. In working window the processed parameters are displayed.
Important: At the bottom is the "Save" button. Any changes you make in the project will be
stored after confirmation that button! If, for example, you close the browser window without
saving changes, changed data will be lost!
The new composition is created in three main steps:
• Specification of the basic parameters of the project (description, location, coordinate
system, display type)
• Retrieving and adjustment layers (the choice of a variety of sources and parameters)
• The form of the publication project
Specification of the basic parameters of the project:
• in "Project Information on the left panel, click on "Edit"
• Fill in the Project Title, Author, Keywords and Description Composition (abstract)
• Define the "project area" - the area is defined by coordinate system and coordinates
•
• Or you can cut and coordinate system to define themselves
o EPSG code directly by entering the coordinates EPSG code can be entered
numerically or choose from a predefined list
o Or definition of the map window
Select the map
Select EPSG code
Confirm with "OK"
Coordinates and EPSG code will automatically be added to the project
description
• Define "Other Properties" - select the output image format – this can affect the quality
and speed of visualisation.
• Define "Access to project" - determining who can view and edit. Not for publication
outside the application!
• To confirm the completed "information about" press "OK"
Layers
This section allows you to add data layers to the composition from different sources (local
and external) and use them in the map compositions.
Adding a new layer
• In the left column under "Layers", click on "Add layer"
There is a list of sources from which you can add data to composition:
• WMS servers
• Catalog Client
• Internal data on a server
• WFS servers
• PostGIS database
Select the data source for adding a layer to locate the relevant data
Adding data from a WMS or WFS server
• As a source, select WMS server (analogically for WFS services – all next steps are
the same for both types of services)
• Select address of the WMS server
• If access to data require logging, fulfil login parameters
• You can also choose WMS server from a t list of favourites servers
•
If server is successfully connected, you'll see a list of available data
In the upper part of the working window, you can select format and coordinate system for
publishing the data service.
If you use this service frequently in various projects, you can save URL in the list of
"Favourite Sites" clicking on "Add Server". Then you will be able to select this server from
the drop-down menu in the selection of WMS.
For each layer, you can view basic information or preview on the layer in the map window
Select the check box on the left for layers you want to add to the map composition.
For creating folders (tree structure for the layers) see below select the folder for layers
Adding data from the client's catalogue
If you do not know the address of the WMS or WFS server for the requested data, you can
search using catalogue services. Click the "Add layer" and as a source select "Catalogue
Client"
In the field "URL catalog services" write the address of the used catalogue service or choose
this from the menu. Catalog services must conform to standard OGC CSW. Enter search
text and press "Search". Service returns the available data layers.
Click on the selected layer. It will subsequently appear in the standard window for adding a
layer which you can paste into your project
Adding internal data
The data that you have available on the server (e.g. data that you uploaded via DataMan)
could be added to the composition by the next steps.
Click on "Add layer" and a source select "Internal data on a server". From the menu, select
the internal directory and click on "Upload"
For each layer, you can view basic information or preview on the layer in the map window
Select the check box on the left for layers, which you want to add to the map composition.
If you have a project with folders (tree structure for the layers - see below), the right to
choose which folder to add the selected layer .
Select all the layers you want from your server to use and click "OK"
Selected layers will be added to your project
Adding data from the database
The current version can be added to the project data from the database Postgre / PostGIS.
Click the "Add layer" and a source select "PostGIS"
Enter the server parameters, or select from your favourite sites
The result will be the list of available layers.
Each layer, you can preview in the map window
Select the check box on the left for layers, which you want to add to the map composition.
If you have a project to create folders (tree structure for the layers - see below), the right to
choose which folder to add the selected layer
If you have a project with folders (tree structure for the layers - see below), the right to
choose which folder to add the selected layer
Select all the layers you want from your server to use and click "OK"
Selected layers will be added to your project
Working with layers in the map composition
With the data layers in composition you can provide next operations.
Layers can be:
• sorted
• deleted from the composition
• grouped into folders
• set as enabled / disabled
Layers can be grouped into different components. However, since the use of folders cannot
maintain order, which affects the visibility of each layer is display a list of layers and their
configuration is divided into two types:
• by orders
• by folders
Viewing layers by order:
Layers are arranged in the same order as they are displayed in the final composition in the
map window. Enable means that the layer is visible immediately after loading the project. In
case that disabled layer is added to the list of layers in the project, it will not be displayed.
Reordering layers
• Select the layer "In turn"
• Window will display "Layers settings"
• Layers can be moved by mouse.
• Clicking on the bulb you can determine if the layer will or will not be turned on when
you first load the project into the map window
• You can also select the layer and move or turn on / off using the link on the right side
• Layer can be highlighted and deleted - clicking on the "Delete" , the selected layer are
marked as deleted
•
Note - the actual deletion occurs only after confirmation "OK" button.
Working with folders
If you want to view layers ordered by folders, select "By folders"
To create a presentation folder, click on "Settings"
• To create a new folder, type "New folder name” and click on" Create "
• To move layers to the folder select the layers you want to move and select the "Active
folder", Click on "Move"
•
•
• In this setting, you can also delete layers - select the layer and click on "Delete."
Layers are marked as deleted. They will be deleted after confirming the settings with
"OK"
Display parameters of layers
For each layer in the map composition you view and edit their properties. Parameters could
be changed by clicking on the layer in the layers list.
The range of parameters depends on the type of data (vectors, bitmaps) and also on whether
you use option " Basic settings"
Example of parameters of WMS using basic settings:
In the basic parameters you can change the layer’s title, descriptions of the layer, add the
URL of metadata record and assign an ID if you will use in other applications with JavaScript
API.
For the advanced settings for each layer must be defined the following parameters:
• Title
• URL Web Services
• Name (not changed)!
• Format
• Coordinate system (projection)
• Status (On / Off when you load the map window)
As optional parameters for WFS can be defined as:
• description layer
• ID for use in other applications
• URL of metadata
• Format of descriptive information
• Minimum scale display
• Maximum scale display
• Expiration time for connection
• Style
• Transparency
• Distance
When using vector data from the internal server, you can define your own display parameters
for each layer. For vector data it is possible to identify the different styles, these styles can be
grouped into complex symbols, and sorted into various classes.
Previewing the project
During the work with the map composition is possible to view maps click on the link "View
Map" at the bottom of the working window. A new window opens with a HSLayers map
client and composition will be displayed
Displaying and publication of map compositions
Processed map composition, you can view:
• in HSLayers
• in GoogleMaps
• in Google Earth where these applications installed on your PC
Composition can also be published in other forms:
• mapping client HSLayers
• Web Map Service (WMS)
• Web Feature Service (WFS) - only the vector data
• Separate components for insertion into the site
View Options, and publishing are available in the dropdown menu "Other Actions"
Publishing:
In the "Other Actions" menu, select "Publishing Settings"
Select how to publish and click on "Publish"
Fill in the metadata
Geohosting english manual

Más contenido relacionado

La actualidad más candente

La actualidad más candente (19)

Ms access basics ppt
Ms access basics ppt Ms access basics ppt
Ms access basics ppt
 
Ms Access ppt
Ms Access pptMs Access ppt
Ms Access ppt
 
XLS PE How To Tutorials Tips & Tricks
XLS PE How To Tutorials Tips & TricksXLS PE How To Tutorials Tips & Tricks
XLS PE How To Tutorials Tips & Tricks
 
Ms Access
Ms AccessMs Access
Ms Access
 
L3 ms access 2010 interface
L3 ms access 2010 interfaceL3 ms access 2010 interface
L3 ms access 2010 interface
 
Access ppt
Access ppt Access ppt
Access ppt
 
It ready dw_day4_rev00
It ready dw_day4_rev00It ready dw_day4_rev00
It ready dw_day4_rev00
 
MS Access 2007 in ITT
MS Access 2007 in ITTMS Access 2007 in ITT
MS Access 2007 in ITT
 
Ms access notes
Ms access notesMs access notes
Ms access notes
 
Access 2007 Training
Access 2007 TrainingAccess 2007 Training
Access 2007 Training
 
Access 2010 Unit A PPT
Access 2010 Unit A PPTAccess 2010 Unit A PPT
Access 2010 Unit A PPT
 
Tableau best practises
Tableau best practisesTableau best practises
Tableau best practises
 
ETL Microsoft Material
ETL Microsoft MaterialETL Microsoft Material
ETL Microsoft Material
 
Ms access 2010 lesson 3 (Interface)
Ms access 2010 lesson 3 (Interface)Ms access 2010 lesson 3 (Interface)
Ms access 2010 lesson 3 (Interface)
 
Info Path 2007 Training
Info Path 2007 TrainingInfo Path 2007 Training
Info Path 2007 Training
 
Concepts and Methods of Embedding Statistical Data into Maps
Concepts and Methods of Embedding Statistical Data into MapsConcepts and Methods of Embedding Statistical Data into Maps
Concepts and Methods of Embedding Statistical Data into Maps
 
Les06
Les06Les06
Les06
 
Financial reporting rpd using obiee
Financial reporting rpd using obieeFinancial reporting rpd using obiee
Financial reporting rpd using obiee
 
Chapter 9: Forms
Chapter 9: FormsChapter 9: Forms
Chapter 9: Forms
 

Destacado

Micka Manual
Micka ManualMicka Manual
Micka ManualSDIEDU
 
ผลการตรวจวัดพลังงานที่สูญเสีย
ผลการตรวจวัดพลังงานที่สูญเสียผลการตรวจวัดพลังงานที่สูญเสีย
ผลการตรวจวัดพลังงานที่สูญเสียRacha Thaiprakob
 
โครงงานดอกกุหลาบ
โครงงานดอกกุหลาบโครงงานดอกกุหลาบ
โครงงานดอกกุหลาบsiwapronnandee
 
โครงงาน ดอกทานตะวัน
โครงงาน ดอกทานตะวันโครงงาน ดอกทานตะวัน
โครงงาน ดอกทานตะวันAmpol Sonwises
 

Destacado (6)

Moment of truth
Moment of truthMoment of truth
Moment of truth
 
Micka Manual
Micka ManualMicka Manual
Micka Manual
 
ผลการตรวจวัดพลังงานที่สูญเสีย
ผลการตรวจวัดพลังงานที่สูญเสียผลการตรวจวัดพลังงานที่สูญเสีย
ผลการตรวจวัดพลังงานที่สูญเสีย
 
Apple on fire
Apple on fireApple on fire
Apple on fire
 
โครงงานดอกกุหลาบ
โครงงานดอกกุหลาบโครงงานดอกกุหลาบ
โครงงานดอกกุหลาบ
 
โครงงาน ดอกทานตะวัน
โครงงาน ดอกทานตะวันโครงงาน ดอกทานตะวัน
โครงงาน ดอกทานตะวัน
 

Similar a Geohosting english manual

IMPORT AND EXPORT UTILITIES IN MS-ACCESS
IMPORT AND EXPORT UTILITIES IN MS-ACCESSIMPORT AND EXPORT UTILITIES IN MS-ACCESS
IMPORT AND EXPORT UTILITIES IN MS-ACCESS23HARSHU
 
" Overview of the DSD and DATA editor in the new CountrySTAT platform "
" Overview of the DSD and DATA editor  in the new CountrySTAT platform  "" Overview of the DSD and DATA editor  in the new CountrySTAT platform  "
" Overview of the DSD and DATA editor in the new CountrySTAT platform "FAO
 
Necto 16 training 23 - visual studio modeling
Necto 16 training 23 -  visual studio modelingNecto 16 training 23 -  visual studio modeling
Necto 16 training 23 - visual studio modelingPanorama Software
 
Microsoft Access 2007
Microsoft Access 2007Microsoft Access 2007
Microsoft Access 2007Reshma Arun
 
View api analytics
View api analyticsView api analytics
View api analyticsSon Nguyen
 
MongoDB.local Seattle 2019: Bringing Data to Life with MongoDB Charts
MongoDB.local Seattle 2019: Bringing Data to Life with MongoDB Charts MongoDB.local Seattle 2019: Bringing Data to Life with MongoDB Charts
MongoDB.local Seattle 2019: Bringing Data to Life with MongoDB Charts MongoDB
 
Create a basic performance point dashboard epc
Create a basic performance point dashboard   epcCreate a basic performance point dashboard   epc
Create a basic performance point dashboard epcEPC Group
 
Mapping Immigrants
Mapping ImmigrantsMapping Immigrants
Mapping Immigrantsborderzine
 
Tableau Basic Questions
Tableau Basic QuestionsTableau Basic Questions
Tableau Basic QuestionsSooraj Vinodan
 
Basic commands of ArcGIS
Basic commands of ArcGISBasic commands of ArcGIS
Basic commands of ArcGISKU Leuven
 
How to load geocoded points to Mappler
How to load geocoded points to MapplerHow to load geocoded points to Mappler
How to load geocoded points to MapplerWansoo Im
 
Business Intelligence Technology Presentation
Business Intelligence Technology PresentationBusiness Intelligence Technology Presentation
Business Intelligence Technology PresentationJohn Paredes
 
Overview of the DSD editor in the new CountrySTAT platform
Overview of the DSD editor in the new CountrySTAT platformOverview of the DSD editor in the new CountrySTAT platform
Overview of the DSD editor in the new CountrySTAT platformFAO
 
Consuming and Publishing Ordnance Survey Open Data with Open Source Software
Consuming and Publishing Ordnance Survey Open Data with Open Source SoftwareConsuming and Publishing Ordnance Survey Open Data with Open Source Software
Consuming and Publishing Ordnance Survey Open Data with Open Source SoftwareJoanne Cook
 
CREATING A DATASET FROM EXCEL IN POWER BI REPORT BUILDER
CREATING A DATASET FROM EXCEL IN POWER BI REPORT BUILDERCREATING A DATASET FROM EXCEL IN POWER BI REPORT BUILDER
CREATING A DATASET FROM EXCEL IN POWER BI REPORT BUILDERSagarDuttPhuloria
 
Bringing Data to Life with MongoDB Charts
Bringing Data to Life with MongoDB ChartsBringing Data to Life with MongoDB Charts
Bringing Data to Life with MongoDB ChartsMongoDB
 

Similar a Geohosting english manual (20)

IMPORT AND EXPORT UTILITIES IN MS-ACCESS
IMPORT AND EXPORT UTILITIES IN MS-ACCESSIMPORT AND EXPORT UTILITIES IN MS-ACCESS
IMPORT AND EXPORT UTILITIES IN MS-ACCESS
 
" Overview of the DSD and DATA editor in the new CountrySTAT platform "
" Overview of the DSD and DATA editor  in the new CountrySTAT platform  "" Overview of the DSD and DATA editor  in the new CountrySTAT platform  "
" Overview of the DSD and DATA editor in the new CountrySTAT platform "
 
QGIS Tutorial 1
QGIS Tutorial 1QGIS Tutorial 1
QGIS Tutorial 1
 
Database Connection
Database ConnectionDatabase Connection
Database Connection
 
Necto 16 training 23 - visual studio modeling
Necto 16 training 23 -  visual studio modelingNecto 16 training 23 -  visual studio modeling
Necto 16 training 23 - visual studio modeling
 
Microsoft Access 2007
Microsoft Access 2007Microsoft Access 2007
Microsoft Access 2007
 
View api analytics
View api analyticsView api analytics
View api analytics
 
MongoDB.local Seattle 2019: Bringing Data to Life with MongoDB Charts
MongoDB.local Seattle 2019: Bringing Data to Life with MongoDB Charts MongoDB.local Seattle 2019: Bringing Data to Life with MongoDB Charts
MongoDB.local Seattle 2019: Bringing Data to Life with MongoDB Charts
 
Create a basic performance point dashboard epc
Create a basic performance point dashboard   epcCreate a basic performance point dashboard   epc
Create a basic performance point dashboard epc
 
Mapping Immigrants
Mapping ImmigrantsMapping Immigrants
Mapping Immigrants
 
Tableau Basic Questions
Tableau Basic QuestionsTableau Basic Questions
Tableau Basic Questions
 
Basic commands of ArcGIS
Basic commands of ArcGISBasic commands of ArcGIS
Basic commands of ArcGIS
 
zMSC Lab.pdf
zMSC Lab.pdfzMSC Lab.pdf
zMSC Lab.pdf
 
How to load geocoded points to Mappler
How to load geocoded points to MapplerHow to load geocoded points to Mappler
How to load geocoded points to Mappler
 
Business Intelligence Technology Presentation
Business Intelligence Technology PresentationBusiness Intelligence Technology Presentation
Business Intelligence Technology Presentation
 
Overview of the DSD editor in the new CountrySTAT platform
Overview of the DSD editor in the new CountrySTAT platformOverview of the DSD editor in the new CountrySTAT platform
Overview of the DSD editor in the new CountrySTAT platform
 
Consuming and Publishing Ordnance Survey Open Data with Open Source Software
Consuming and Publishing Ordnance Survey Open Data with Open Source SoftwareConsuming and Publishing Ordnance Survey Open Data with Open Source Software
Consuming and Publishing Ordnance Survey Open Data with Open Source Software
 
CREATING A DATASET FROM EXCEL IN POWER BI REPORT BUILDER
CREATING A DATASET FROM EXCEL IN POWER BI REPORT BUILDERCREATING A DATASET FROM EXCEL IN POWER BI REPORT BUILDER
CREATING A DATASET FROM EXCEL IN POWER BI REPORT BUILDER
 
Bringing Data to Life with MongoDB Charts
Bringing Data to Life with MongoDB ChartsBringing Data to Life with MongoDB Charts
Bringing Data to Life with MongoDB Charts
 
Treeview listview
Treeview listviewTreeview listview
Treeview listview
 

Último

Kisan Call Centre - To harness potential of ICT in Agriculture by answer farm...
Kisan Call Centre - To harness potential of ICT in Agriculture by answer farm...Kisan Call Centre - To harness potential of ICT in Agriculture by answer farm...
Kisan Call Centre - To harness potential of ICT in Agriculture by answer farm...Krashi Coaching
 
A Critique of the Proposed National Education Policy Reform
A Critique of the Proposed National Education Policy ReformA Critique of the Proposed National Education Policy Reform
A Critique of the Proposed National Education Policy ReformChameera Dedduwage
 
9548086042 for call girls in Indira Nagar with room service
9548086042  for call girls in Indira Nagar  with room service9548086042  for call girls in Indira Nagar  with room service
9548086042 for call girls in Indira Nagar with room servicediscovermytutordmt
 
Separation of Lanthanides/ Lanthanides and Actinides
Separation of Lanthanides/ Lanthanides and ActinidesSeparation of Lanthanides/ Lanthanides and Actinides
Separation of Lanthanides/ Lanthanides and ActinidesFatimaKhan178732
 
Software Engineering Methodologies (overview)
Software Engineering Methodologies (overview)Software Engineering Methodologies (overview)
Software Engineering Methodologies (overview)eniolaolutunde
 
CARE OF CHILD IN INCUBATOR..........pptx
CARE OF CHILD IN INCUBATOR..........pptxCARE OF CHILD IN INCUBATOR..........pptx
CARE OF CHILD IN INCUBATOR..........pptxGaneshChakor2
 
1029-Danh muc Sach Giao Khoa khoi 6.pdf
1029-Danh muc Sach Giao Khoa khoi  6.pdf1029-Danh muc Sach Giao Khoa khoi  6.pdf
1029-Danh muc Sach Giao Khoa khoi 6.pdfQucHHunhnh
 
POINT- BIOCHEMISTRY SEM 2 ENZYMES UNIT 5.pptx
POINT- BIOCHEMISTRY SEM 2 ENZYMES UNIT 5.pptxPOINT- BIOCHEMISTRY SEM 2 ENZYMES UNIT 5.pptx
POINT- BIOCHEMISTRY SEM 2 ENZYMES UNIT 5.pptxSayali Powar
 
Sanyam Choudhary Chemistry practical.pdf
Sanyam Choudhary Chemistry practical.pdfSanyam Choudhary Chemistry practical.pdf
Sanyam Choudhary Chemistry practical.pdfsanyamsingh5019
 
Accessible design: Minimum effort, maximum impact
Accessible design: Minimum effort, maximum impactAccessible design: Minimum effort, maximum impact
Accessible design: Minimum effort, maximum impactdawncurless
 
Ecosystem Interactions Class Discussion Presentation in Blue Green Lined Styl...
Ecosystem Interactions Class Discussion Presentation in Blue Green Lined Styl...Ecosystem Interactions Class Discussion Presentation in Blue Green Lined Styl...
Ecosystem Interactions Class Discussion Presentation in Blue Green Lined Styl...fonyou31
 
Nutritional Needs Presentation - HLTH 104
Nutritional Needs Presentation - HLTH 104Nutritional Needs Presentation - HLTH 104
Nutritional Needs Presentation - HLTH 104misteraugie
 
BASLIQ CURRENT LOOKBOOK LOOKBOOK(1) (1).pdf
BASLIQ CURRENT LOOKBOOK  LOOKBOOK(1) (1).pdfBASLIQ CURRENT LOOKBOOK  LOOKBOOK(1) (1).pdf
BASLIQ CURRENT LOOKBOOK LOOKBOOK(1) (1).pdfSoniaTolstoy
 
microwave assisted reaction. General introduction
microwave assisted reaction. General introductionmicrowave assisted reaction. General introduction
microwave assisted reaction. General introductionMaksud Ahmed
 
SOCIAL AND HISTORICAL CONTEXT - LFTVD.pptx
SOCIAL AND HISTORICAL CONTEXT - LFTVD.pptxSOCIAL AND HISTORICAL CONTEXT - LFTVD.pptx
SOCIAL AND HISTORICAL CONTEXT - LFTVD.pptxiammrhaywood
 
Introduction to Nonprofit Accounting: The Basics
Introduction to Nonprofit Accounting: The BasicsIntroduction to Nonprofit Accounting: The Basics
Introduction to Nonprofit Accounting: The BasicsTechSoup
 
Call Girls in Dwarka Mor Delhi Contact Us 9654467111
Call Girls in Dwarka Mor Delhi Contact Us 9654467111Call Girls in Dwarka Mor Delhi Contact Us 9654467111
Call Girls in Dwarka Mor Delhi Contact Us 9654467111Sapana Sha
 
Disha NEET Physics Guide for classes 11 and 12.pdf
Disha NEET Physics Guide for classes 11 and 12.pdfDisha NEET Physics Guide for classes 11 and 12.pdf
Disha NEET Physics Guide for classes 11 and 12.pdfchloefrazer622
 

Último (20)

Kisan Call Centre - To harness potential of ICT in Agriculture by answer farm...
Kisan Call Centre - To harness potential of ICT in Agriculture by answer farm...Kisan Call Centre - To harness potential of ICT in Agriculture by answer farm...
Kisan Call Centre - To harness potential of ICT in Agriculture by answer farm...
 
A Critique of the Proposed National Education Policy Reform
A Critique of the Proposed National Education Policy ReformA Critique of the Proposed National Education Policy Reform
A Critique of the Proposed National Education Policy Reform
 
9548086042 for call girls in Indira Nagar with room service
9548086042  for call girls in Indira Nagar  with room service9548086042  for call girls in Indira Nagar  with room service
9548086042 for call girls in Indira Nagar with room service
 
Separation of Lanthanides/ Lanthanides and Actinides
Separation of Lanthanides/ Lanthanides and ActinidesSeparation of Lanthanides/ Lanthanides and Actinides
Separation of Lanthanides/ Lanthanides and Actinides
 
Software Engineering Methodologies (overview)
Software Engineering Methodologies (overview)Software Engineering Methodologies (overview)
Software Engineering Methodologies (overview)
 
CARE OF CHILD IN INCUBATOR..........pptx
CARE OF CHILD IN INCUBATOR..........pptxCARE OF CHILD IN INCUBATOR..........pptx
CARE OF CHILD IN INCUBATOR..........pptx
 
1029-Danh muc Sach Giao Khoa khoi 6.pdf
1029-Danh muc Sach Giao Khoa khoi  6.pdf1029-Danh muc Sach Giao Khoa khoi  6.pdf
1029-Danh muc Sach Giao Khoa khoi 6.pdf
 
Mattingly "AI & Prompt Design: The Basics of Prompt Design"
Mattingly "AI & Prompt Design: The Basics of Prompt Design"Mattingly "AI & Prompt Design: The Basics of Prompt Design"
Mattingly "AI & Prompt Design: The Basics of Prompt Design"
 
POINT- BIOCHEMISTRY SEM 2 ENZYMES UNIT 5.pptx
POINT- BIOCHEMISTRY SEM 2 ENZYMES UNIT 5.pptxPOINT- BIOCHEMISTRY SEM 2 ENZYMES UNIT 5.pptx
POINT- BIOCHEMISTRY SEM 2 ENZYMES UNIT 5.pptx
 
Sanyam Choudhary Chemistry practical.pdf
Sanyam Choudhary Chemistry practical.pdfSanyam Choudhary Chemistry practical.pdf
Sanyam Choudhary Chemistry practical.pdf
 
Accessible design: Minimum effort, maximum impact
Accessible design: Minimum effort, maximum impactAccessible design: Minimum effort, maximum impact
Accessible design: Minimum effort, maximum impact
 
Ecosystem Interactions Class Discussion Presentation in Blue Green Lined Styl...
Ecosystem Interactions Class Discussion Presentation in Blue Green Lined Styl...Ecosystem Interactions Class Discussion Presentation in Blue Green Lined Styl...
Ecosystem Interactions Class Discussion Presentation in Blue Green Lined Styl...
 
Nutritional Needs Presentation - HLTH 104
Nutritional Needs Presentation - HLTH 104Nutritional Needs Presentation - HLTH 104
Nutritional Needs Presentation - HLTH 104
 
BASLIQ CURRENT LOOKBOOK LOOKBOOK(1) (1).pdf
BASLIQ CURRENT LOOKBOOK  LOOKBOOK(1) (1).pdfBASLIQ CURRENT LOOKBOOK  LOOKBOOK(1) (1).pdf
BASLIQ CURRENT LOOKBOOK LOOKBOOK(1) (1).pdf
 
microwave assisted reaction. General introduction
microwave assisted reaction. General introductionmicrowave assisted reaction. General introduction
microwave assisted reaction. General introduction
 
SOCIAL AND HISTORICAL CONTEXT - LFTVD.pptx
SOCIAL AND HISTORICAL CONTEXT - LFTVD.pptxSOCIAL AND HISTORICAL CONTEXT - LFTVD.pptx
SOCIAL AND HISTORICAL CONTEXT - LFTVD.pptx
 
Introduction to Nonprofit Accounting: The Basics
Introduction to Nonprofit Accounting: The BasicsIntroduction to Nonprofit Accounting: The Basics
Introduction to Nonprofit Accounting: The Basics
 
Advance Mobile Application Development class 07
Advance Mobile Application Development class 07Advance Mobile Application Development class 07
Advance Mobile Application Development class 07
 
Call Girls in Dwarka Mor Delhi Contact Us 9654467111
Call Girls in Dwarka Mor Delhi Contact Us 9654467111Call Girls in Dwarka Mor Delhi Contact Us 9654467111
Call Girls in Dwarka Mor Delhi Contact Us 9654467111
 
Disha NEET Physics Guide for classes 11 and 12.pdf
Disha NEET Physics Guide for classes 11 and 12.pdfDisha NEET Physics Guide for classes 11 and 12.pdf
Disha NEET Physics Guide for classes 11 and 12.pdf
 

Geohosting english manual

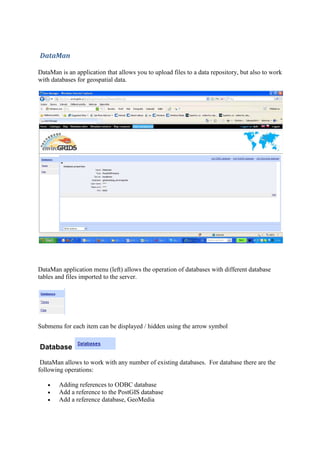
  • 1. DataMan DataMan is an application that allows you to upload files to a data repository, but also to work with databases for geospatial data. DataMan application menu (left) allows the operation of databases with different database tables and files imported to the server. Submenu for each item can be displayed / hidden using the arrow symbol Database DataMan allows to work with any number of existing databases. For database there are the following operations: • Adding references to ODBC database • Add a reference to the PostGIS database • Add a reference database, GeoMedia
  • 2. The procedure for adding references to databases • To add references to the database click on the link "Add database xxx" for the type of database • Fill in the parameters and let the database store • Testing of the connection by clicking on "Test" • Deleting references clicking on delete
  • 3. Tables In the attached database you can create or edit a table: • Select the database • To create a new table click on "Create table" – it opens "Table Editor"
  • 4. • Enter the name of the table • Select the type of geometry or table without geometry • Add additional items of the table by clicking on the link "Add Item" • Table ready to confirm with "OK" For existing tables in the database it is possible to • browse the structure - icon • delete - icon • change the structure - the icon • view the map (in the case of geographic data) - icon
  • 5. Files After clicking on "Files" in the left menu of DataMan you can see a list of available files on the server and available tools.
  • 6. For uploading files to a server (provide next steps • click on "Upload file" – it will display a window with information about free space on the server • • click on the search button • select your preferred file
  • 7. • • upload the file to the server • • the uploaded file to add metadata
  • 8. • For the files on the server, you have the next functions: • view information about a file - icon • download the file to your computer - icon • delete a file from the server - icon • preview file in map window (for geo-data) - icon • import the file into a database (currently only the vector data in SHP files) - icon • transform the file into another coordinate system / projection - icon
  • 9. MapMan - module for creating and publishing of maps compositions MapMan allows integration of data accessible through standard web services (WMS, WFS), together with spatial data stored in databases and files on internal servers. All these data sources can be used for creating map compositions in a web environment. Such newly created composite map can be displayed by the user in several ways - either in standard web browsers (Open Layers, GoogleMap, DHTML client) or on a desktop browser (GoogleEarth). Important is the opportunity to publish these new compositions as a completely new web service - WMS or WFS. You can edit Map composition or selecting existing composition from the list or clicking on button Create project. Creating new composition After you click on "Create Project" you can edit basic information about the composition.
  • 10. There are 3 basic components: • Information about the project • Layers - definition of content composition • Symbols- definition of project presentation
  • 11. The link "Show Map" allows viewing of the processed project in a separate map window using HSLayers. In working window the processed parameters are displayed. Important: At the bottom is the "Save" button. Any changes you make in the project will be stored after confirmation that button! If, for example, you close the browser window without saving changes, changed data will be lost! The new composition is created in three main steps: • Specification of the basic parameters of the project (description, location, coordinate system, display type) • Retrieving and adjustment layers (the choice of a variety of sources and parameters) • The form of the publication project Specification of the basic parameters of the project: • in "Project Information on the left panel, click on "Edit" • Fill in the Project Title, Author, Keywords and Description Composition (abstract) • Define the "project area" - the area is defined by coordinate system and coordinates
  • 12. • • Or you can cut and coordinate system to define themselves o EPSG code directly by entering the coordinates EPSG code can be entered numerically or choose from a predefined list o Or definition of the map window Select the map Select EPSG code Confirm with "OK" Coordinates and EPSG code will automatically be added to the project description • Define "Other Properties" - select the output image format – this can affect the quality and speed of visualisation. • Define "Access to project" - determining who can view and edit. Not for publication outside the application! • To confirm the completed "information about" press "OK" Layers This section allows you to add data layers to the composition from different sources (local and external) and use them in the map compositions. Adding a new layer • In the left column under "Layers", click on "Add layer"
  • 13. There is a list of sources from which you can add data to composition: • WMS servers • Catalog Client • Internal data on a server • WFS servers • PostGIS database Select the data source for adding a layer to locate the relevant data Adding data from a WMS or WFS server
  • 14. • As a source, select WMS server (analogically for WFS services – all next steps are the same for both types of services) • Select address of the WMS server • If access to data require logging, fulfil login parameters • You can also choose WMS server from a t list of favourites servers • If server is successfully connected, you'll see a list of available data In the upper part of the working window, you can select format and coordinate system for publishing the data service. If you use this service frequently in various projects, you can save URL in the list of "Favourite Sites" clicking on "Add Server". Then you will be able to select this server from the drop-down menu in the selection of WMS. For each layer, you can view basic information or preview on the layer in the map window Select the check box on the left for layers you want to add to the map composition.
  • 15. For creating folders (tree structure for the layers) see below select the folder for layers Adding data from the client's catalogue If you do not know the address of the WMS or WFS server for the requested data, you can search using catalogue services. Click the "Add layer" and as a source select "Catalogue Client" In the field "URL catalog services" write the address of the used catalogue service or choose this from the menu. Catalog services must conform to standard OGC CSW. Enter search
  • 16. text and press "Search". Service returns the available data layers. Click on the selected layer. It will subsequently appear in the standard window for adding a layer which you can paste into your project Adding internal data The data that you have available on the server (e.g. data that you uploaded via DataMan) could be added to the composition by the next steps. Click on "Add layer" and a source select "Internal data on a server". From the menu, select the internal directory and click on "Upload"
  • 17. For each layer, you can view basic information or preview on the layer in the map window Select the check box on the left for layers, which you want to add to the map composition. If you have a project with folders (tree structure for the layers - see below), the right to choose which folder to add the selected layer . Select all the layers you want from your server to use and click "OK" Selected layers will be added to your project Adding data from the database The current version can be added to the project data from the database Postgre / PostGIS. Click the "Add layer" and a source select "PostGIS" Enter the server parameters, or select from your favourite sites The result will be the list of available layers.
  • 18. Each layer, you can preview in the map window Select the check box on the left for layers, which you want to add to the map composition. If you have a project to create folders (tree structure for the layers - see below), the right to choose which folder to add the selected layer If you have a project with folders (tree structure for the layers - see below), the right to choose which folder to add the selected layer Select all the layers you want from your server to use and click "OK" Selected layers will be added to your project Working with layers in the map composition With the data layers in composition you can provide next operations. Layers can be: • sorted • deleted from the composition • grouped into folders • set as enabled / disabled
  • 19. Layers can be grouped into different components. However, since the use of folders cannot maintain order, which affects the visibility of each layer is display a list of layers and their configuration is divided into two types: • by orders • by folders Viewing layers by order: Layers are arranged in the same order as they are displayed in the final composition in the map window. Enable means that the layer is visible immediately after loading the project. In case that disabled layer is added to the list of layers in the project, it will not be displayed. Reordering layers • Select the layer "In turn" • Window will display "Layers settings"
  • 20. • Layers can be moved by mouse. • Clicking on the bulb you can determine if the layer will or will not be turned on when you first load the project into the map window • You can also select the layer and move or turn on / off using the link on the right side • Layer can be highlighted and deleted - clicking on the "Delete" , the selected layer are marked as deleted • Note - the actual deletion occurs only after confirmation "OK" button.
  • 21. Working with folders If you want to view layers ordered by folders, select "By folders" To create a presentation folder, click on "Settings" • To create a new folder, type "New folder name” and click on" Create "
  • 22. • To move layers to the folder select the layers you want to move and select the "Active folder", Click on "Move" • •
  • 23. • In this setting, you can also delete layers - select the layer and click on "Delete." Layers are marked as deleted. They will be deleted after confirming the settings with "OK" Display parameters of layers For each layer in the map composition you view and edit their properties. Parameters could be changed by clicking on the layer in the layers list. The range of parameters depends on the type of data (vectors, bitmaps) and also on whether you use option " Basic settings" Example of parameters of WMS using basic settings: In the basic parameters you can change the layer’s title, descriptions of the layer, add the URL of metadata record and assign an ID if you will use in other applications with JavaScript API. For the advanced settings for each layer must be defined the following parameters: • Title • URL Web Services • Name (not changed)! • Format
  • 24. • Coordinate system (projection) • Status (On / Off when you load the map window) As optional parameters for WFS can be defined as: • description layer • ID for use in other applications • URL of metadata • Format of descriptive information • Minimum scale display • Maximum scale display • Expiration time for connection • Style • Transparency • Distance When using vector data from the internal server, you can define your own display parameters for each layer. For vector data it is possible to identify the different styles, these styles can be grouped into complex symbols, and sorted into various classes. Previewing the project During the work with the map composition is possible to view maps click on the link "View Map" at the bottom of the working window. A new window opens with a HSLayers map client and composition will be displayed Displaying and publication of map compositions Processed map composition, you can view: • in HSLayers • in GoogleMaps • in Google Earth where these applications installed on your PC Composition can also be published in other forms: • mapping client HSLayers • Web Map Service (WMS) • Web Feature Service (WFS) - only the vector data • Separate components for insertion into the site
  • 25. View Options, and publishing are available in the dropdown menu "Other Actions" Publishing: In the "Other Actions" menu, select "Publishing Settings" Select how to publish and click on "Publish" Fill in the metadata