SGS 2016 Full Year Results

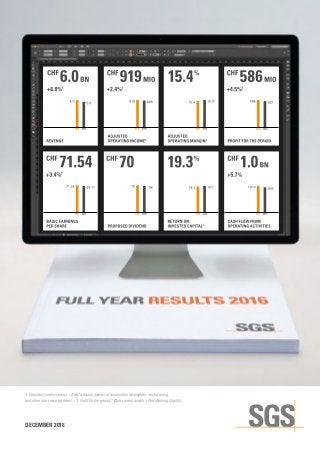
The SGS Group performed solidly in 2016. Total revenues reached CHF 6.0 billion and SGS is on track to deliver the revenue growth projected in the 2020 strategic plan. The Group realized a revenue growth of 6.0% on a constant currency basis, of which 2.5% was organic and 3.5% was contributed by recent acquisitions. On a historical reported basis, Group revenues increased by 4.8%. A new business structure was successfully implemented at the beginning of 2016, with the newly created Agriculture, Food and Life and Transportation business lines performing above expectations. Representing 72% of the Group’s earnings, the non-energy businesses achieved strong organic revenue growth of 6.2%, driving Group performance. You can view our financial reports here: http://www.sgs.com/en/Our-Company/Investor-Relations/Financial-Reports.aspx

Recomendados
Más contenido relacionado
Destacado
Destacado (10)
Más de SGS
Más de SGS (20)
Último
Último (20)
SGS 2016 Full Year Results
- 1. DECEMBER 2016 1. Constant currency basis. - 2. Before amortisation of acquisition intangibles, restructuring and other non-recurring items. - 3. Profit for the period / (Non current assets + Net Working Capital).
- 2. CONSUMER BENEFIT > Lower prices at the checkout SGS SERVICE > Productivity Management Services
- 3. 3 FINANCIAL HIGHLIGHTS (CHF million) 2016 2015 PRO-FORMA2 2015 REVENUE 5 985 5 644 5 712 Change in % 6.0 4.8 ADJUSTED EBITDA1 1 198 1 169 1 191 Change in % 2.5 0.6 ADJUSTED OPERATING INCOME1 919 898 917 Change in % 2.4 0.2 ADJUSTED OPERATING MARGIN IN %1 15.4 15.9 16.1 OPERATING INCOME (EBIT) 816 803 822 Change in % 1.6 (0.7) PROFIT FOR THE PERIOD 586 561 584 Change in % 4.5 0.3 PROFIT ATTRIBUTABLE TO EQUITY HOLDERS OF SGS SA 543 527 549 Change in % 3.0 (1.1) ADJUSTED PROFIT ATTRIBUTABLE TO EQUITY HOLDERS OF SGS SA1 629 603 625 Change in % 4.3 0.6 BASIC EPS (CHF) 71.54 69.17 71.99 ADJUSTED BASIC EPS (CHF)1 83.00 79.07 81.95 DILUTED EPS (CHF) 71.47 69.13 71.95 FREE CASH FLOW3 738 658 (NET DEBT) / NET CASH (736) (482) WEIGHTED AVERAGE NUMBER OF SHARES ('000) 7 583 7 626 AVERAGE NUMBER OF EMPLOYEES 89 626 85 903 1. Before amortisation of acquisition intangibles, restructuring and other non-recurring items. 2. Constant currency basis. 3. Operating Cash Flow less Capital Expenditure.
- 4. 4 ACQUISITIONS COMPLETED IN 2016 NON-ENERGY ORGANIC REVENUE GROWTH DOUBLE-DIGIT GROWTH ADJUSTED EBITDA 19 6.2% 23.6% ENVIRONMENT, HEALTH AND SAFETY 12.9% TRANSPORTATION 10.0% GOVERNMENT AND INSTITUTIONS SERVICES CHF 1.2BN The SGS Group performed solidly in 2016. Total revenues reached CHF 6.0 billion and SGS is on track to deliver the revenue growth projected in the 2020 strategic plan. The Group realised a revenue growth of 6.0% on a constant currency basis, of which 2.5% was organic and 3.5% was contributed by recent acquisitions. On a historical reported basis, Group revenues increased by 4.8%. A new business structure was successfully implemented at the beginning of 2016, with the newly created Agriculture, Food and Life and Transportation business lines performing above expectations. Representing 72% of the Group’s earnings, the non-energy businesses achieved strong organic revenue growth of 6.2%, driving Group performance. Environment, Health and Safety, with a revenue growth of 23.6% (of which 6.9% organic), enjoyed rapid growth in the hospitality segment. Transportation also performed strongly with double-digit growth at 12.9% (of which 7.9% organic) broadening its scope in the mobility sector through new programmes and the acquisition of new expertise. Governments and Institutions showed a notable performance with an organic revenue growth of 10.0% on the back of solid Product Conformity Assessment performance. Certification and Business Enhancement grew at 9.1% (entirely organic) while continuing to diversify its service portfolio with strong growth in training. Agriculture, Food and Life delivered solid revenue growth of 6.1% (of which 4.5% organic), significantly increasing its market share to become one of the world’s largest service providers through the creation of a complete supply chain solution. Consumer and Retail benefited from growth in the Chinese domestic market and e-commerce services. However, energy-related markets remained challenging. Low oil prices, ongoing difficulties in the global gas markets and soft demand for minerals continued to impact demand, creating pricing pressure on services for Minerals, Industrial and Oil, Gas and Chemicals. In light of this, the Group undertook a number of restructuring measures, resulting in one-off expenses, including asset impairments, amounting to CHF 48.8 million (CHF 39.8 million net of taxes). Adjusted EBITDA increased by 2.5% to reach CHF 1 198 million versus prior year on a constant currency basis. Adjusted operating income reached CHF 919 million versus CHF 898 million in prior year, an increase of 2.4% (constant currency basis). The adjusted operating income margin declined compared to prior year level (15.4% versus 15.9% at constant currency). This was primarily attributable to pressure on energy-related business and the impact of investments in IT systems for laboratory operations and human resource management, as well as the development of new shared services infrastructure. Whilst initially dilutive to margins, these undertakings are expected to significantly improve the Group’s operating efficiency, and are an integral part of the transformation initiatives which are at the heart of the 2016-2020 plan. The Group also achieved procurement savings in line with the strategic plan. In addition, the acquisitions of Accutest and Bateman generated lower short-term profitability, but will become margin accretive in the mid term. Net financial expenses increased to CHF 45 million. The overall effective tax rate for the period was 24.0%. Net income reached CHF 586 million, an increase of 4.5% (constant currency basis). Profit attributable to equity holders reached CHF 543 million for the period, an increase of 3.0% over prior year (constant currency basis) and a decrease of 1.1% compared with the CHF 549 million disclosed in 2015 (historical reported basis).
- 5. 5 The Group generated solid operating cash flow at CHF 1 014 million, supported by strong net working capital performance. Net working capital is at a historical low despite a shift to more capital intensive project-related work. Net investments in fixed assets were CHF 276 million and the Group completed 19 acquisitions during the period for a total cash consideration payable of CHF 193 million. In 2016, the Group paid a dividend of CHF 517 million and financed a share buyback for a net amount of CHF 161 million. At 31 December 2016, the Group’s net debt position amounted to CHF 736 million compared with a net debt position of CHF 482 million at 31 December 2015. ACQUISITIONS AND STRATEGIC PARTNERSHIPS The Group completed 19 acquisitions and made two strategic investments in 2016. Business and services expansion continued worldwide with a particular focus on growing operations in China and North America to align with strategic growth objectives. These acquisitions span several business lines, including: Agriculture, Food and Life; Transportation; Industrial; Oil, Gas and Chemicals; Minerals; Environment, Health and Safety; and Consumer and Retail. When combined, these acquisitions added CHF 203 million to the Group’s revenue and CHF 20 million to the operating income in 2016. Acquisitions completed in 2016 include: Accutest Laboratories in the USA, the fifth largest full service environmental testing company in the United States; Bateman Projects in Africa, specialists in process plant design and site engineering services; Compliance Certification Services Inc., one of China’s leading Electro Magnetic Compatibility (EMC) testing laboratories, with operations across Taiwan and China; CyberMetrix Inc. in the USA, providing test cells, equipment, and services to meet the complex testing requirements of engine and power systems and Laboratorios Contecon Urbar in Colombia and Panama, an independent materials testing business focusing on quality control for the construction industry. The Group continued to pursue smaller equity stakes in certain strategic technology companies as illustrated by the recent partnerships with Transparency-One, which provides a platform for supply chain visibility and business risk management, and AgFlow SA, which operates an innovative trade intelligence platform, aggregating over- the-counter (OTC) market data on global grains, oilseeds/proteins and edible oils. SIGNIFICANT MILESTONES During the year, the Group made significant strides in the assessment of its business portfolio to bring greater transparency on new growth projects and to identify non-performing business segments. The development of a strategic dashboard to assess business segments based on growth, margin, cash flow and strategic significance allows the Group to identify strengths and weaknesses more effectively. SGS continued to develop its integrated reporting in support of its sustainability efforts with the creation of an enhanced materiality matrix, incorporating the assessment and findings of the annual risk review. The members of the Operations Council played an important role in this process by assessing the relative impacts of the materiality and business risks. To benefit from economies of scale, a transformation of the support functions was launched in 2016. A governance model was established as a standard for future replication, the major financial back-office streams were identified and related processes redesigned to align with the new financial standard processes. The year also witnessed the strengthening of the Group’s Business Principles and the evolution of policies that address a continually changing market and regulatory environment. An example is the anticipated introduction of the new SGS Human Rights Statement and Code of Conduct for Suppliers. The new guidance will ensure that human rights are respected across all operations and at every step of the supply chain. SUBSEQUENT EVENTS The following acquisitions and strategic investments were completed after 31 December 2016: BF Machinery PTY LTD and CBF Engineering PTY LTD, providing testing, repair, engineering and maintenance services for pumps, valves, hydraulics and plastics systems in Australia; and Laboratoire LCA, offering analytical services, including soil fertility testing, to the agricultural sector in Morocco. In support of the Testing, Inspection and Certification (TIC) 4.0 strategic initiative on digitalisation and data, the Group granted a loan of CHF 3 million to Sensima Inspection in Switzerland. The business provides testing services and equipment using a proprietary core technology based on electromagnetic response measurements (eddy currents) for non-destructive testing applications. SIGNIFICANT SHAREHOLDERS As at 31 December 2016, Groupe Bruxelles Lambert acting through Serena SARL held 16.20% (2015: 15.00%). Mr. August von Finck and members of his family acting in concert held 15.03% (2015: 15.03%), the Bank of New York Mellon Corporation held 3.35% (2015: 3.35%), BlackRock, Inc. held 3.03% (2015: 3.03%) and MFS Investment Management held 3.01% (2015: 3.01%) of the share capital and voting rights of the Company. At the same date, the SGS Group held 3.63% of the share capital of the Company (2015: 2.77%).
- 6. 6 Sergio Marchionne Chairman of the Board Frankie Ng Chief Executive Officer DISTRIBUTION TO SHAREHOLDERS The SGS Board of Directors will recommend to the Annual General Meeting, to be held on 21 March 2017, the approval of a dividend of CHF 70 per share. NEW SHARE BUYBACK PROGRAMME The SGS Board of Directors has authorised a new share buyback programme of up to CHF 250 million. Details will be announced in due time. SUSTAINABILITY Sustainable development is undergoing a pivotal change. The success of the Paris Agreement, the United Nation’s 17 Sustainable Development Goals and the UK’s Modern Slavery Act 2015, provides a clear pathway for future global development, and the corporate sector is uniquely placed to help lead this process. In 2016, significant improvements in the Group’s global safety performance, its CO2 emissions and investment in local communities served to highlight the major strides made towards its Sustainability Ambitions 2020. In addition, the Group maintained its status as a carbon neutral company, and began working towards its goal of having at least 30% of women in leadership positions. For the third consecutive year, SGS was named the leading company in its industry by the Dow Jones Sustainability Indices (DJSI World and DJSI Europe). The Group has consolidated its position in financial sustainability indices and was also recognised as a global leader in responding to climate change, with a position on CDP’s Climate A List. CDP also named SGS as Industrials Sector Leader and Country Leader in the DACH (Germany, Austria and Switzerland) region. The leadership team continued to be actively engaged in the Group’s sustainability performance and participated extensively in key policy issues. For instance, the new Vehicle Emissions Policy will engage managers across the Group in helping to minimise CO2 emissions through their choice of fleet car. It is only by leading by example through actions such as these that SGS can help the corporate sector build a more sustainable economy. GUIDANCE 2017 The Group expects to deliver solid organic revenue growth and higher adjusted operating income on a constant currency basis, and generate robust cash flow. OUTLOOK 2020 The Group remains committed to the aims of its 2020 plan, which are: •• To average mid single-digit organic growth, with improvement over the period underpinned by the new structure and new strategic initiatives. •• To accelerate Mergers and Acquisitions activities with acquired revenue in the range of CHF 1 billion over the period. •• To achieve an adjusted operating income margin of at least 18% by the end of the period bolstered by the new structure, efficiency improvement initiatives and improved pricing. •• To ensure strong cash conversion. •• To see solid returns on invested capital. •• To offer solid dividend distributions, in line with the improvement in net earnings. 23 January 2017
- 7. SGS SERVICE Polymer Testing CONSUMER BENEFIT More responsive carbon fibre products
- 8. 8 (CHF million) 2016 2015 PRO-FORMA2, 3 20153 REVENUE 934.9 880.9 892.4 Change in % 6.1 4.8 ADJUSTED OPERATING INCOME¹ 147.2 144.0 146.8 Change in % 2.2 0.3 MARGIN %¹ 15.7 16.3 16.5 1. Before amortisation of acquisition intangibles, restructuring and other non-recurring items. - 2. Constant currency basis. - 3. Restated figures due to the change in business structure. SGS SERVICE Laboratory Fleece Testing CONSUMER BENEFIT Woollen products that are as comfy as they are supposed to be AGRICULTURE, FOOD AND LIFE The business placed a strong emphasis on Laboratory expansion and strategic investments to support the TIC 4.0 initiatives in supply chain management, food regulatory compliance and market data. GROWTH AND REVENUE Agriculture, Food and Life achieved solid revenue growth of 6.1% (of which 4.5% organic) to CHF 935 million for the year, with strong performance from Life, Food and Trade activities tempered by a slowdown in the agricultural input market which affected the demand for contract research activities. Recent acquisitions in the UK, Canada and Brazil made favourable contributions to overall growth. Food activities delivered solid growth driven by strong testing services across Asia and high demand for certification activities, particularly in North America. Strong growth in commodity services in the first half of 2016 slowed as crop quality and weather-related events in Europe affected export volumes during the traditional peak period. Recent efforts to clean the portfolio and exit non-core Logistics operations resulted in reduced revenues but will improve margins. Seed and Crop activities continued to be impacted by the slow input market and drought in Southern Africa. Life laboratory activities maintained double-digit growth in 2016. Key drivers were strong growth in Asia and the USA, and acquisitive growth from Quality Compliance Laboratories Inc. in Canada. Clinical Research experienced a slowdown in the second half of the year due to the postponement of projects in the Clinical Pharmacology Unit. ADJUSTED OPERATING MARGIN Adjusted operating margin declined from 16.3% to 15.7% in prior year (constant currency basis) reflecting the challenges in the agricultural input market as well as the recent investments made to enhance the laboratory network. ACQUISITIONS AND STRATEGIC PARTNERSHIPS During the year, the Group acquired a 75% share in Unigeo Agricultura de Precisâo in Brazil, a leader in precision farming services; and also acquired the assets and license of John R. McCrea Agency, Inc. (McCrea), an official designated inspection agency active in the USA. In addition, the Group acquired two companies providing analytical services – Biopremier, a leader in next-generation sequencing technologies in Portugal; and Laagrima, specialising in consultations and analytical services to the food and hospitality market in Morocco. In support of its TIC 4.0 strategic initiative, the Group acquired minority stakes in Transparency One in the USA, a platform for supply chain visibility and risk management, and AgFlow SA in Switzerland, which operates an innovative trade intelligence platform aggregating OTC market data on global grains, oilseeds/proteins and edible oils. Under the same initiative, the Group also acquired a controlling interest in C-Labs, a start-up based in Switzerland, developing solutions for transforming food regulatory compliance.
- 9. 9 (CHF million) 2016 2015 PRO-FORMA2 2015 REVENUE 635.0 618.9 632.8 Change in % 2.6 0.3 ADJUSTED OPERATING INCOME¹ 90.9 86.6 89.6 Change in % 5.0 1.5 MARGIN %¹ 14.3 14.0 14.2 1. Before amortisation of acquisition intangibles, restructuring and other non-recurring items. - 2. Constant Currency basis. SGS SERVICE Diamond Classification and Evaluation CONSUMER BENEFIT Knowing your diamond is ethically sourced MINERALS The outlook for Energy Minerals in South Africa remains strong. The new world-class sampling and laboratory facility at the Richards Bay Coal Terminal started a seven-year contract, in addition to an award of five new onsite coal laboratory contracts. GROWTH AND REVENUE Minerals delivered revenue growth of 2.6% (of which -0.2% organic) to CHF 635 million for the year, performing above expectations, in a market that continues to experience reduced exploration expenditures. Geochemistry laboratories delivered strong growth with global sample volumes increasing 11% over prior year as a result of improved efficiencies and integrated service packages. Demand for laboratory outsourcing continued to grow, with five new contracts starting during the year. A further six new contracts are expected to begin in 2017. Energy Minerals delivered exceptional growth in South Africa, Russia, Colombia and Vietnam and a more stable performance in Australia and the USA despite market contraction. The commencement of a seven-year contract in the new world-class sampling and laboratory facility at the Richards Bay Coal Terminal in 2016, along with the award of five onsite coal contracts, has provided the base for a strong energy minerals outlook in South Africa for 2017. Trade services achieved solid performance in steel and raw materials and fertiliser trading activities, with Russia, Mexico and China driving growth. However, these results were partially offset by flat performance in non-ferrous activities. The business added mine and plant services to its portfolio in 2016. This expansion has led to the securing of plant optimisation contracts in Russia and Mexico, with a solid pipeline of opportunities for 2017. Metallurgy continued to be impacted by reduced exploration expenditure in 2016, although performance showed improvement in the second half of the year. ADJUSTED OPERATING MARGIN The adjusted operating margin for the period increased to 14.3% from 14.0% in prior year (constant currency basis), as a result of gains achieved from efficiency and optimisation initiatives across the global network. ACQUISITIONS During the first quarter, the Group concluded the acquisition of Bateman Projects in Africa, which specialises in process plant design and site engineering services. The acquisition has further strengthened the Group’s position as the leading one-stop-shop service provider.
- 10. 10 (CHF million) 2016 2015 PRO-FORMA2, 3 20153 REVENUE 1 098.4 1 122.2 1 126.4 Change in % (2.1) (2.5) ADJUSTED OPERATING INCOME¹ 116.4 126.5 128.6 Change in % (8.0) (9.5) MARGIN %¹ 10.6 11.3 11.4 1. Before amortisation of acquisition intangibles, restructuring and other non-recurring items. - 2. Constant currency basis. - 3. Restated figures due to the change in business structure. SGS SERVICE Statutory and Voluntary Inspection Services CONSUMER BENEFIT A safe gas supply to your home OIL, GAS AND CHEMICALS SGS will provide offshore inspectors and third party laboratory services for Shell’s Prelude floating liquefied natural gas (LNG) project, ensuring expert support in independent quantity and quality measurements for one of the most significant projects of its kind ever undertaken. GROWTH AND REVENUE Oil, Gas and Chemicals reported a decline in revenue of -2.1% (of which -2.5% organic) to CHF 1 098 million for the year. Performance was affected by continued low oil prices and further market deterioration. Trade-related services remained flat. Despite some customer-driven procurement activities leading to volume splits and a reduced number of physical transactions, the business remained resilient to industry-wide price adjustment pressure and increased its market share in most regions. Plant and Terminal Operations remained stable compared to the prior year. North America, the strongest region, delivered low single-digit growth, while performance in Europe was impacted by procurement-driven volume splits and the loss of important contracts as a result of pricing. Upstream Services experienced a decline, mainly in the exploration sector in Australia and the Sub-Surface Consultancy segment. The deterioration of the security situation in some regions also resulted in the withdrawal of teams. This decline was marginally offset by several contract wins in the Production segment. Oil Condition Monitoring delivered single-digit growth driven by strong performance across the laboratory network from international and local customers. The Non-Inspection Related Testing business declined slightly, impacted by industry in-sourcing trends and reduced investment in laboratories. Cargo Treatment Services and Fuel Integrity Programmes (FIP) were impacted by the cessation of FIPs in Saudi Arabia and Ghana. The rest of the business remained flat. The Sample Management segment delivered high double-digit growth. Measurements and Instrumentation operations posted high single-digit growth in all regions, with performance driven by an improved execution platform and stable statutory calibration requirements. ADJUSTED OPERATING MARGIN The adjusted operating margin decreased from 11.3% in prior year (constant currency basis) to 10.6%. The decrease can be attributed to revenue decline, which was partially offset by strict cost- control measures and an improvement in revenue quality as a result of strong contract performance reviews. ACQUISITIONS During the year, the Group acquired Cargo Compliance Company in the Netherlands, active in packing, storage, consulting, classification and professional training for the handling of dangerous goods. This has established SGS as the Dutch market leader in this growing segment.
- 11. 11 (CHF million) 2016 2015 PRO-FORMA2, 3 20153 REVENUE 872.8 821.2 826.1 Change in % 6.3 5.7 ADJUSTED OPERATING INCOME¹ 223.6 212.0 215.7 Change in % 5.5 3.7 MARGIN %¹ 25.6 25.8 26.1 1. Before amortisation of acquisition intangibles, restructuring and other non-recurring items. - 2. Constant currency basis. - 3. Restated figures due to the change in business structure. SGS SERVICE REACH Testing Services CONSUMER BENEFIT Chemicals present in your accessories limited to safe levels CONSUMER AND RETAILCONSUMER AND RETAIL During 2016, the business successfully launched Supplier Quality Engineering Service, a turnkey solution to support global Electrical and Electronics clients from supplier selection, research and development, regulatory compliance to onsite production monitoring. This high-value service is already proving to be a success, especially for clients launching products in multiple markets. GROWTH AND REVENUE Consumer and Retail delivered revenue growth of 6.3% (of which 4.7% organic) to CHF 873 million for the year. High single-digit growth was achieved in Northern Central and Southern Europe, Eastern Europe and Middle East, Africa, China and Hong Kong and South East Asia. Softlines reported robust growth over the year. This was attributable to the acquisition of new global accounts, improved market share in Footwear Testing and Consulting, as well as the expansion of its footprint in emerging markets. Softlines also benefited from increased activity related to Detox and zero discharge of hazardous chemicals (ZDHC) campaigns. Despite difficult market conditions for wireless testing due to the reduction in the number of mobile phone models, Electrical and Electronics achieved solid growth and benefited from high volume in Restrictive Substance Testing as well as in Electrical Magnetic Compatibility, Safety and Reliability testing activities. Cosmetics, Personal Care and Household delivered high growth throughout the year, especially in China, Germany and North America. High single-digit growth in Hardlines was driven by the acquisition of new global customers in both the toys and juvenile products segment and the hardgoods segment, as well as an increased level of activity in the e-market sector. ADJUSTED OPERATING MARGIN The adjusted operating margin for the period decreased from 25.8% in prior year (constant currency basis) to 25.6% as a result of difficult market conditions in Wireless. ACQUISITIONS During 2016 the Group acquired Integrated Paper Services Inc. (IPS Testing) in the USA, an independent testing laboratory offering physical and analytical testing in both the consumer and supplier environments, and Compliance Certification Services Inc., one of the China’s leading Electro Magnetic Compatibility testing laboratories with operations throughout Taiwan and China.
- 12. 12 (CHF million) 2016 2015 PRO-FORMA2, 3 20153 REVENUE 324.1 297.0 298.6 Change in % 9.1 8.5 ADJUSTED OPERATING INCOME¹ 57.5 48.2 48.7 Change in % 19.3 18.1 MARGIN %¹ 17.7 16.2 16.3 1. Before amortisation of acquisition intangibles, restructuring and other non-recurring items. - 2. Constant currency basis. - 3. Restated figures due to the change in business structure. SGS SERVICE BS 8555 Certification CONSUMER BENEFIT Your favourite coffee being environmentally friendly too CERTIFICATION AND BUSINESS ENHANCEMENT With the aim of building its profile as a leading solution provider, the business won a contract to develop e-learning courses for a leading brewing company in Peru. The contract win has given the business a foothold in the solution provision market in Peru. GROWTH AND REVENUE Certification and Business Enhancement delivered solid revenue growth of 9.1% (entirely organic) to CHF 324 million for the year. Training activities, focused on the adoption of new standards and regulations, were a key driver. The business experienced strong client demand for the new ISO 9001:2015 and ISO 14001 standards driving double-digit growth in Training Services. In addition, the development of technical training dedicated to specific industries in China and the gradual roll-out of new online courses around the network also contributed significantly to growth. Performance Management delivered double-digit growth as a result of a combination of factors, including significant contract wins from Spanish and British tour operators in hospitality excellence services along with the development of local initiatives to meet the increasing demand from customers to create customised programmes. ADJUSTED OPERATING MARGIN The adjusted operating margin for the year increased to 17.7% from 16.2% in prior year (constant currency basis). Growth was driven by improved efficiency along with the recent opening of a second global business centre in Asia. In addition, restructuring completed at the end of 2015 helped Germany to return to growth and profitability.
- 13. 13 (CHF million) 2016 2015 PRO-FORMA2, 3 20153 REVENUE 890.9 844.2 852.4 Change in % 5.5 4.5 ADJUSTED OPERATING INCOME¹ 83.6 93.9 95.5 Change in % (11.0) (12.5) MARGIN %¹ 9.4 11.1 11.2 1. Before amortisation of acquisition intangibles, restructuring and other non-recurring items. - 2. Constant currency basis. - 3. Restated figures due to the change in business structure. SGS SERVICE Feasibility Study CONSUMER BENEFIT Efficient and appropriate use of taxpayers’ money INDUSTRIAL The recently acquired Matrolab in South Africa has developed a solid relationship with the South Africa National Roads Agency Ltd (SANRAL) through its onsite laboratories. The network, currently consisting of 50 onsite laboratories and generating a significant portion of revenues, boasts a solid growth pipeline. GROWTH AND REVENUE Industrial delivered revenue growth of 5.5% (of which -2.6 % organic) to CHF 891 million for the year, despite an organic decline in the Energy and Construction markets impacting the TIC sector. The slowdown in the Energy market was primarily related to depressed oil and gas activities. A reduction in capital investment and spending continued to put pressure on volumes and prices in North America, South Eastern Asia Pacific and Africa. The pressure was partially offset by solid downstream activity in the Middle East and organic growth in the energy market in China and the nuclear market in Western Europe. Infrastructure and Construction activities were affected by reduced public investment in some South American countries and Europe. However, this decline was mitigated by the growth in construction testing activities in Africa and in project supervision in Chile. The Group continued to extend its laboratory testing network, adding new capabilities in construction and calibration testing, which delivered double-digit growth. ADJUSTED OPERATING MARGIN The adjusted operating margin for the period declined from 11.1% in prior year (constant currency basis) to 9.4%. The performance was impacted by difficult market conditions in oil and gas, in addition to overall price pressure. ACQUISITIONS During the year, the Group acquired Matrolab Group in South Africa, Laboratorios Contecon Urbar in Panama and Colombia, and Laboratorio de Control Técnico de Calidad de Construcción Eecolab Limitada in Chile. These South American acquisitions focus on quality control testing in the construction industries. It also acquired Roos+Bijl in the Netherlands, which provides engineering and consulting, project management, asset management and legal services for all types of underground infrastructure.
- 14. 14 (CHF million) 2016 2015 PRO-FORMA2, 3 20153 REVENUE 464.3 375.7 375.6 Change in % 23.6 23.6 ADJUSTED OPERATING INCOME¹ 54.9 48.0 48.0 Change in % 14.4 14.4 MARGIN %¹ 11.8 12.8 12.8 1. Before amortisation of acquisition intangibles, restructuring and other non-recurring items. - 2. Constant currency basis. - 3. Restated figures due to the change in business structure. SGS SERVICE Ballast Water Sampling CONSUMER BENEFIT The long-term protection of our oceans ENVIRONMENT, HEALTH AND SAFETY The adoption of the International Maritime Organization Ballast Water Management Convention and new vessel emission standards are expected to accelerate Marine services revenue. GROWTH AND REVENUE Environment, Health and Safety delivered strong revenue growth of 23.6% (of which 6.9% organic) to CHF 464 million for the year. Growth was driven by the expansion of environment testing services in North America, increased volumes from global health and safety contracts (mainly in Europe), and strong trends in the dioxins market in Brazil, China and Taiwan. Europe delivered strong results from high-volume and high-margin laboratory contracts, particularly in Germany, Italy and the Benelux countries. Health and safety contracts wins in the hospitality and real estate sectors were also a factor. North America benefited from the acquisition of Accutest Laboratories and AXYS Analytical Services Ltd., expanding the footprint and service portfolio. China and Taiwan delivered significant growth from high demand for testing services due to increased enforcement and environmental regulations. In South America, high single-digit growth came from a rapidly developing dioxins market in Brazil and 2015 acquisitions that performed in line with expectations. In Australia, slower economic activities in the oil and mining sectors continued to hamper growth. ADJUSTED OPERATING MARGIN The adjusted operating margin for the year decreased from 12.8% in prior year (constant currency basis) to 11.8%. The decline can be attributed to a temporary margin dilutive effect from the integration of the Accutest acquisition which was partially offset by the completion of several large projects in Europe. ACQUISITIONS During the year, the Group acquired the assets of Accutest Laboratories, the fifth largest full-service environmental testing company in the United States, and AXYS Analytical Services Ltd., the North American leader in ultra trace analysis of Persistent Organic Pollutants, Contaminants of Emerging Concerns and the early development stages of the fast-growing metabolomics business. These acquisitions enhanced the geographical footprint and boosted its service portfolio in North America.
- 15. 15 (CHF million) 2016 2015 PRO-FORMA2, 3 20153 REVENUE 489.8 433.7 447.6 Change in % 12.9 9.4 ADJUSTED OPERATING INCOME¹ 78.5 80.4 82.1 Change in % (2.4) (4.4) MARGIN %¹ 16.0 18.5 18.3 1. Before amortisation of acquisition intangibles, restructuring and other non-recurring items. - 2. Constant currency basis. - 3. Restated figures due to the change in business structure. SGS SERVICE Aviation Fuel Testing CONSUMER BENEFIT Peace of mind when flying TRANSPORTATION SGS opened a state-of-the-art facility in Michigan capable of performing servo-hydraulic, shock and vibration testing. This facility provides an increase in capacity in close proximity to many of our automotive customers, and expands our capabilities to cover a wider transportation market. GROWTH AND REVENUE Transportation delivered strong revenue growth of 12.9% (of which 7.9% organic) to CHF 490 million for the year. Growth was driven by all activities of the business. Regulated services strengthened its position in the Americas, Europe and Africa, with solid growth in Vehicle Inspection Services along with a new contract awarded and successfully deployed in France to administer driving theory tests. This contract generated strong results in the second half of the year. In Mauritius, the Group started inspections in the fourth quarter following the award of a contract for the management of a test station in 2013. In Uganda, inspections started at the end of the second half of the year and implementation is on schedule. In Argentina, the first inspections relating to a new contract were performed in the fourth quarter at two new stations in Buenos Aires. In the USA, a contract extension, including increased scope, was signed with the State of California to run the next generation electronic transmission data management service for the California Smog Check programme. In addition, Field Inspection activities delivered solid results, supported by increased inspection volumes from existing clients in Europe and the USA. Testing Services for materials, components and vehicles and engines continued to grow with solid contributions from operations in China, France, India and the USA. The business also expanded its services to include lightweight materials testing for aerospace and automotive applications in France. Field Services’ supply chain operations began to focus on the new quality standard IATF 16949 for the automotive industry, which will come into effect in 2018 and will oblige clients to adapt their quality management systems. Services delivered by recently acquired companies have been replicated successfully in new regions. ADJUSTED OPERATING MARGIN The adjusted operating margin for the period declined from 18.5% in prior year to 16.0% (constant currency basis). The decrease can be attributed to investments in the development of testing activities and start-up costs for the new contracts signed in the Americas and Africa. ACQUISITIONS The Group acquired CyberMetrix Inc. in the USA, providing high horsepower engine testing services to meet the complex emission standard requirements on engines.
- 16. 16 (CHF million) 2016 2015 PRO-FORMA2 2015 REVENUE 274.7 249.8 260.0 Change in % 10.0 5.7 ADJUSTED OPERATING INCOME¹ 66.6 58.0 62.3 Change in % 14.8 6.9 MARGIN %¹ 24.2 23.2 24.0 1. Before amortisation of acquisition intangibles, restructuring and other non-recurring items. - 2. Constant Currency basis. SGS SERVICE Forest Management Certification CONSUMER BENEFIT Forests for our grandchildren to enjoy GOVERNMENTS AND INSTITUTIONS During the year, the Group launched SGS Renovo, a unique, trademarked e-waste management solution, with four contracts secured around the world. GROWTH AND REVENUE Governments and Institutions delivered solid growth of 10.0% (entirely organic) to CHF 275 million for the year, with a continued trend of solid performance from Product Conformity Assessments (PCA). The PCA market share strengthened remarkably during the period. In addition, two new programmes were implemented in Cameroon and Gabon, with the contract in Cameroon coming online in the second half of 2016. The Business delivered exceptional organic growth with the completion of the e-Gov programme (Inland Revenue Management platform) deployment in Ghana and a new 100% scanning programme which was launched using SGS Dtect® , a revolutionary remote inspection solution in Cameroon in 2016. Single Window solutions growth was driven by strong performance in Ghana and Madagascar, where increased import volumes had a significant impact. The new valuation solution, SGS E-Valuator™ was successfully launched in Haiti and fully implemented in Cameroon. The solution corresponds with the Group’s strategy of implementing World Trade Organization and World Customs Organization recommendations to discontinue pre-shipment inspections. ADJUSTED OPERATING MARGIN The adjusted operating margin for the year significantly increased to 24.2% from 23.2% in prior year (constant currency basis), driven by strong trade volume from PCA and Single Window solutions.
- 17. SGS SERVICE Supplier Quality Engineering (SQE) CONSUMER BENEFIT Products at the quality you expect
- 18. 18 CONDENSED CONSOLIDATED FINANCIAL STATEMENTS FOR THE PERIOD ENDED 31 DECEMBER 2016 (CHF million) NOTES 2016 2015 REVENUE 5 985 5 712 Salaries, wages and subcontractors’ expenses (3 377) (3 194) Depreciation, amortisation and impairment (336) (322) Other operating expenses (1 456) (1 374) OPERATING INCOME (EBIT) 5 816 822 Net financial expenses (45) (43) PROFIT BEFORE TAXES 771 779 Taxes (185) (195) PROFIT FOR THE PERIOD 586 584 Profit attributable to: Equity holders of SGS SA 543 549 Non-controlling interests 43 35 BASIC EARNINGS PER SHARE (IN CHF) 6 71.54 71.99 DILUTED EARNINGS PER SHARE (IN CHF) 6 71.47 71.95 CONDENSED CONSOLIDATED INCOME STATEMENT CONDENSED CONSOLIDATED STATEMENT OF COMPREHENSIVE INCOME (CHF million) 2016 2015 Actuarial gains/(losses) on defined benefit plans (3) (40) Income tax on actuarial gains/(losses) taken directly to equity 3 9 Items that will be not subsequently reclassified to income statement - (31) Exchange differences and other (29) (254) Items that may be subsequently reclassified to income statement (29) (254) OTHER COMPREHENSIVE INCOME FOR THE PERIOD (29) (285) Profit for the period 586 584 TOTAL COMPREHENSIVE INCOME FOR THE PERIOD 557 299 Attributable to: Equity holders of SGS SA 519 266 Non-controlling interests 38 33
- 19. 19 CONDENSED CONSOLIDATED BALANCE SHEET AT 31 DECEMBER (CHF million) NOTES 2016 20151 NON-CURRENT ASSETS Land, buildings and equipment 972 964 Goodwill and other intangible assets 1 441 1 306 Other non-current assets 325 347 TOTAL NON-CURRENT ASSETS 2 738 2 617 CURRENT ASSETS Trade accounts and notes receivable 997 917 Other current assets 630 626 Cash and marketable securities 984 1 734 TOTAL CURRENT ASSETS 2 611 3 277 TOTAL ASSETS 5 349 5 894 TOTAL EQUITY 1 853 1 981 NON-CURRENT LIABILITIES Loans and obligations under finance leases 3 1 719 1 723 Provisions and other non-current liabilities 289 338 TOTAL NON-CURRENT LIABILITIES 2 008 2 061 CURRENT LIABILITIES Trade and other payables 641 526 Other liabilities 3 847 1 326 TOTAL CURRENT LIABILITIES 1 488 1 852 TOTAL LIABILITIES 3 496 3 913 TOTAL EQUITY AND LIABILITIES 5 349 5 894 1. Restated figures (note 3). SGS SERVICE Digital Services CONSUMER BENEFIT A more secure internet
- 20. 20 CONDENSED CONSOLIDATED CASH FLOW STATEMENT (CHF million) 2016 2015 PROFIT FOR THE PERIOD 586 584 Other non-cash items 560 541 Decrease in working capital 75 160 Taxes paid (207) (223) Core operating cash flow1 1 014 1 062 Pension funds special contribution - (103) CASH FLOW FROM OPERATING ACTIVITIES 1 014 959 Net (purchase) of fixed assets (276) (286) Net (acquisition) of businesses (172) (104) Decrease/(Increase) in marketable securities and other 247 (235) CASH FLOW FROM INVESTING ACTIVITIES (201) (625) Dividends paid to equity holders of SGS SA (517) (522) Dividends paid to non-controlling interests (39) (34) Transactions with non-controlling interests (4) (2) Net cash received/(paid) on treasury shares (161) (147) (Reimbursments)/Proceeds of corporate bonds (491) 549 Interest paid (58) (55) Net cash flows on interest rate swaps - 16 (Decrease)/increase in borrowings (3) (15) CASH FLOW FROM FINANCING ACTIVITIES (1 273) (210) Currency translation (55) 25 (DECREASE)/INCREASE IN CASH AND CASH EQUIVALENTS (515) 149 1. Before cash flow related to pension funds special contribution. CONDENSED CONSOLIDATED STATEMENT OF CHANGES IN EQUITY ATTRIBUTABLE TO (CHF million) EQUITY HOLDERS OF SGS SA NON-CONTROLLING INTERESTS TOTAL EQUITY BALANCE AT 1 JANUARY 2015 2 327 76 2 403 Total comprehensive income for the period 266 33 299 Dividends paid (522) (34) (556) Share-based payments 9 - 9 Movement in non-controlling interests (1) - (1) Movement on treasury shares (149) - (149) Deferred tax on pension funds special contribution (24) - (24) BALANCE AS AT 31 DECEMBER 2015 1 906 75 1 981 Total comprehensive income for the period 519 38 557 Dividends paid (517) (39) (556) Share-based payments 16 - 16 Movement in non-controlling interests 5 6 11 Movement on treasury shares (156) - (156) BALANCE AS AT 31 DECEMBER 2016 1 773 80 1 853
- 21. 21 1. BASIS OF PREPARATION These condensed consolidated financial statements have been prepared in accordance with the measurement and recognition criteria of International Financial Reporting Standards (IFRS). 2. SIGNIFICANT ACCOUNTING POLICIES The condensed financial statements have been prepared in accordance with the accounting policies applied by the Group in its consolidated financial statements for the year ended 31 December 2015, except for the Group’s adoption of new amendments effective 1 January 2016. These amendments had no significant impact on the Group consolidated financial statements. 3. RESTATEMENT Two bonds with a face value of CHF 492 million indicated in note 23 of the 2015 Annual report were incorrectly disclosed as “Non-current” instead of “Current” Loans obligations under finance leases. As a result, the Non-current versus the Current part of the Loans obligations under finance leases were respectively over and understated by CHF 491 million as at 31 December 2015. The restated 2015 balance sheet figures take into account these adjustments. There is no impact on previously reported net debt, total liabilities or profit for the period. 4. ACQUISITIONS In 2016, the Group acquired 100% of Accutest Laboratories, 100% of Cybermetrix Inc. and 100% of Compliance Certification Services Inc. for the purchase prices of CHF 38 million, CHF 32 million and CHF 29 million respectively. The Group also completed a further 16 acquisitions during the year with a combined purchase price of CHF 94 million. NOTES TO THE CONDENSED CONSOLIDATED FINANCIAL STATEMENTS 5. ANALYSIS OF OPERATING INCOME (CHF million) 2016 2015 Adjusted operating income 919 917 Restructuring costs (49) (64) Amortisation of acquisition intangibles (26) (21) Other non-recurring items (28) (10) OPERATING INCOME 816 822 6. EARNINGS PER SHARE 2016 2015 Profit attributable to equity holders of SGS SA (CHF million) 543 549 Weighted average number of shares (‘000) 7 583 7 626 BASIC EARNINGS PER SHARE (CHF) 71.54 71.99 2016 2015 Profit attributable to equity holders of SGS SA (CHF million) 543 549 Diluted weighted average number of shares (‘000) 7 591 7 630 DILUTED EARNINGS PER SHARE (CHF) 71.47 71.95
- 22. 22 7. EXCHANGE RATES The most significant currencies for the Group were translated at the following exchange rates into Swiss Francs. YEAR-END RATES ANNUAL AVERAGE RATES 2016 2015 2016 2015 Australia AUD 100 74.00 72.24 73.27 72.44 Brazil BRL 100 31.23 25.64 28.38 29.37 Canada CAD 100 75.88 71.54 74.36 75.45 Chile CLP 100 0.15 0.14 0.15 0.15 China CNY 100 14.75 15.28 14.83 15.32 Eurozone EUR 100 107.12 108.42 109.01 106.91 United Kingdom GBP 100 125.75 146.91 133.60 147.19 Hong Kong HKD 100 13.23 12.79 12.69 12.42 Taiwan TWD 100 3.18 3.01 3.05 3.03 USA USD 100 102.57 99.15 98.49 96.26 DISCLAIMER This PDF version is an exact copy of the document provided to SGS shareholders. Except when you are a shareholder, this material is provided for information purposes only and is not, in particular, intended to confer any legal rights on you. This document does not constitute an invitation to invest in SGS shares. Any decisions you make in reliance on this information are solely your responsibility. This document is given as of the dates specified, is not updated and any forward looking statements are made subject to the following reservations: This document contains certain forward looking statements that are neither historical facts nor guarantees of future performance. Because these statements involve risks and uncertainties that are beyond control or estimation of SGS, there are important factors that could cause actual results to differ materially from those expressed or implied by these forward looking statements. These statements speak only as of the date of this document. Except as required by any applicable law or regulation, SGS expressly disclaims any obligation to release publicly any updates or revisions to any forward looking statements contained herein to reflect any change in SGS group’s expectations with regard thereto or any change in events or conditions on which any such statements are based.
- 23. 23 SHAREHOLDER INFORMATION SGS SA CORPORATE OFFICE 1 place des Alpes P.O. Box 2152 CH – 1211 Geneva 1 t +41 (0)22 739 91 11 f +41 (0)22 739 98 86 e sgs.investor.relations@sgs.com www.sgs.com ANNUAL GENERAL MEETING OF SHAREHOLDERS Monday, 21 March 2017 Geneva, Switzerland 2017 HALF YEAR RESULTS Monday, 17 July 2017 INVESTOR DAYS (IN ASIA) Thursday and Friday 26 and 27 October 2017 DIVIDEND PAYMENT DATE Ex-Date: 23 March 2017 Record data: 24 March 2017 Payment date: 27 March 2017 STOCK EXCHANGE LISTING SIX Swiss Exchange, SGSN STOCK EXCHANGE TRADING SIX Swiss Exchange COMMON STOCK SYMBOLS Bloomberg: Registered Share: SGSN.VX Reuters: Registered Share: SGSN.VX Telekurs: Registered Share: SGSN ISIN: Registered Share: CH0002497458 Swiss security number: 249745 CORPORATE DEVELOPMENT, COMMUNICATIONS INVESTOR RELATIONS Jean-Luc de Buman SGS SA 1 place des Alpes P.O. Box 2152 CH – 1211 Geneva 1 t +41 (0)22 739 93 31 f +41 (0)22 739 92 00 www.sgs.com