SlideShare una empresa de Scribd logo
1 de 20
Descargar para leer sin conexión
1.	 Constant currency (CCY)*.
2.	 Percentage points.
3.	 Historical currency.
*	 Alternative Performance Measures (APM),
refer to the ‘2022 Half Year APM’ document.
Half Year
Results
2022
Revenue
CHF 3.3BN
+6.8%1
	 +5.8% organic*  +5.2%3
Profit for the period
CHF 294MIO
+1.4%
Basic earnings per share
CHF 36.78
+1.4%
Return on invested capital*
18.4%
+0.6pp2
Cash flow from operations
CHF 263 MIO
(23.1)%
Adjusted operating income*
CHF 458MIO
+1.6%1
Adjusted operating income margin*
14.1%
(0.7)pp1,2
Free cash flow*
CHF 11MIO
(88.2)%
People Planet Performance
Financial Highlights
(CHF million) June 2022 June 2021 Change in %
June 2021
CCY2
Change in
CCY2
%
Revenue 3 255 3 094 5.2 3 047 6.8
Operating income (EBIT) 423 430 (1.6) 425 (0.5)
Operating income margin 13.0% 13.9% 13.9%
Adjusted operating income* 458 457 0.2 451 1.6
Adjusted operating income margin* 14.1% 14.8% 14.8%
EBITDA* 678 678 0.0 669 1.3
Adjusted EBITDA* 694 686 1.2 676 2.7
Profit for the period 294 290 1.4
Profit attributable to equity holders of SGS SA 276 272 1.5
Adjusted profit attributable to equity holders of SGS SA* 303 292 3.8
Basic EPS (CHF) 36.78 36.29 1.4
Diluted EPS (CHF) 36.71 36.27 1.2
Adjusted basic EPS (CHF)* 40.37 38.87 3.9
Cash flow from operating activities 263 342 (23.1)
Free cash flow* 11 93 (88.2)
Return on invested capital* 18.4% 17.8%
Weighted average number of shares ('000) 7 489 7 485
Average FTE1
95 889 92 143 4.1
1.	
Full Time Equivalent (FTE) employees.
2.	
Constant currency (CCY)*.
*	
Alternative Performance Measures (APM), refer to the ‘2022 Half Year APM’ document.
1
2022 Half Year
Results
SGS | 2022 Half Year Results
A strong operational performance despite challenging market conditions
“We achieved strong growth reflecting the resilience of our global network. All divisions and regions contributed to this performance despite the
challenging market conditions faced during H1. These include the impact of the war in Ukraine, continued supply chain disruption, rising global
inflation, and Covid-related absenteeism and restrictions in China. China, our largest affiliate, resumed its strong growth trajectory in June.
“Through the investment and acquisitions we are making in our focus areas, and the commitment of our colleagues, SGS is becoming
an even more resilient, sustainable and data-driven company delivering on our strategic objectives.” Frankie Ng, CEO of SGS
Enabling a better, safer and more interconnected world
Growth in sustainable solutions combined with our corporate sustainability performance, supports our purpose of enabling a better, safer
and more interconnected world for all our stakeholders.
•	 We are developing new and innovative sustainability solutions in all divisions and geographies across the portfolio including sustainability
assurance, greenhouse gas emissions verification, green buildings and zero waste certification, recycled content testing and environmental
claim management.
•	 A number of corporate sustainability achievements in H1 includes: aligning our targets to the Science Based Targets initiative (SBTi) of
1.5 degrees and net zero pathway; launching our updated human rights policy; strengthening our vehicle emissions policy and prioritizing
energy efficient building investments, two major sources of our carbon emissions; and establishing a dedicated sustainability committee
of the Board.
Delivering on our strategy
We continue to invest in our strategic priority areas including our platform for growth.
•	 Revenue under our Sustainability Solutions Framework increased from 45% in 2020 to 47% in 2021, moving towards our target of 50%
in 2023. This reflects our commitment to make our company and supply chain more sustainable, and to support our customers on their
sustainability journeys.
•	 Continued capex investment in our strategic priority areas. For example, wireless laboratories accounted for over one fifth of our large
growth capex projects in H1 and we are on track to open three new cybersecurity laboratories in 2022 and one in Q1 2023, to help meet
the strong demand.
•	 9% of revenue has been migrated to next generation digital platforms, services and solutions, supporting our target of 20% by 2023:
	 – 
We continue to strengthen our platform for growth through our investment in ‘Level Up’ finance, IT and operational initiatives.
For example, over 50% of geochemistry samples in Natural Resources are now processed through our latest generation of digital labs,
and we are targeting 80% by Q1 2023.
	 – 
In Health  Nutrition, over 75% of our drug development sites are live with our new centralized electronic quality, document and training
management system.
	 – 
The launch of Knowledge’s new digital CertIQ application platform, which digitalizes the entire certification process and reporting from
customer contact through certificate issuance, is a significant enhancement in the digitalization of our customer journey.
•	 Organic* growth was strong in Softlines, Food, Industrial Public Health  Safety, mineral-related activities and Knowledge, especially Consulting.
•	 We completed three acquisitions, all aligned to our focus megatrends and acquired the remaining 49% of Digicomply, our AI end-to-end
digital regulatory compliance platform. The integration of SGS Analytics continues to progress well and the acquisition of proderm GmbH,
completed on 8 July 2022, further accelerates our ambition to become the clear Cosmetics  Hygiene market leader.
Our people are our paramount priority
•	 We have prioritized the safety, security and well-being of all our colleagues impacted by the war in Ukraine. At the same time, we have
suspended business development and investment activities and reduced our portfolio of services in Russia.
•	 Support has been provided to our colleagues impacted by the Covid-related restrictions in China.
A strong financial performance
Total revenue reached CHF 3.3 billion, up 5.2% (6.8% at constant currency*), with strong mid-single digit growth achieved across all
divisions. Organic revenue* increased by 5.8%, supported by pricing initiatives to pass on the majority of cost inflation.
Operating income decreased from CHF 430 million in prior year to CHF 423 million in 2022, mainly impacted by Covid-related restrictions in
China which are now lifted.
Adjusted operating income* slightly increased from CHF 457 million in prior year to CHF 458 million in 2022, an increase of 0.2%
(1.6% at constant currency*). Excluding China, adjusted operating income* growth was double digit.
Adjusted operating income margin* decreased from 14.8% in prior year (also 14.8% at constant currency*) to 14.1% in 2022, solely
driven by the temporary Covid-related lockdown restrictions in China, most notably in Shanghai.
Net financial expenses slightly decreased from CHF 23 million in prior year to CHF 20 million in 2022.
Effective tax rate (ETR) decreased from 29% in prior year to 27%, reflecting a normalization of non-deductible expenses.
Profit attributable to equity holders increased slightly by 1.5% over prior year, from CHF 272 million to CHF 276 million in 2022.
Basic earnings per share increased from CHF 36.29 in prior year to CHF 36.78, an increase of 1.4%.
Cash flow from operating activities decreased from CHF 342 million in prior year to CHF 263 million in 2022, mainly due to higher net
working capital requirement to support the strong revenue growth. This resulted in a positive operating net working capital* at 1.8% as a
percentage of revenue compared to (0.1)% in prior year.
Free cash flow (FCF)* decreased from CHF 93 million in prior year to CHF 11 million in 2022 due to the higher net working capital
requirement.
*	 Alternative Performance Measures (APM), refer to the ‘2022 Half Year APM’ document.
2022 Half Year
Results
2
SGS | 2022 Half Year Results
Investment activities: Net capital expenditure increased from CHF 147 million in prior year to CHF 150 million, and the Group completed
three acquisitions for a total consideration of CHF 17 million, out of which CHF 11 million was paid in H1 2022.
Financing activities: In 2022, the Group paid a dividend of CHF 599 million and initiated a new share buyback program for up to a total of
CHF 250 million, out of which CHF 35 million was spent in H1 2022.
Return on invested capital (ROIC)* increased from 17.8% in prior year to 18.4% in 2022.
As at 30 June 2022, the Group net debt* increased from CHF 1 691 million in December 2021 to CHF 2 363 million, mainly due to dividend
payment.
Business growth and adjusted operating income margin H1 2022
(CHF million) Revenue Growth at CCY1
Organic* growth
at CCY1
Adjusted operating
income*
Adjusted operating
income margin*
Connectivity  Products 642 4.2% 3.1% 149 23.2%
Health  Nutrition 442 8.9% 5.2% 55 12.4%
Industries  Environment 1 070 6.0% 5.6% 92 8.6%
Natural Resources 766 8.3% 7.6% 98 12.8%
Knowledge 335 8.4% 8.4% 64 19.1%
Total 3 255 6.8% 5.8% 458 14.1%
Acquisitions
Date Location Division FTE
Gas Analysis Services 28 February 2022 Ireland Industries  Environment 36
Ecotecnos 6 May 2022 Chile Industries  Environment 27
AIEX 9 May 2022 France Industries  Environment 24
We are on track for our mid-term 2020-2023 targets
People Planet Performance
Ensuring diversity
Nurture diversity and inclusion based on
merit by ensuring equal opportunity to all
employees and evolving our gender diversity
to 30% women in leadership
at CEO-3 positions and above
Reducing our CO2 emissions
Support the transition to a low-carbon world
by meeting our Science-based Target of
reducing our CO2 emissions per revenue
by 35%²
High-single digit constant currency
revenue Compound Annual Growth
Rate (CAGR)
Driven by mid-single digit organic* growth
per annum and a focus on MA
World Class Service (WCS)
Promote a culture of operational safety,
efficiency and excellence through our WCS
program: 20% of our WCS labs (2020
perimeter) reaching WCS Bronze award level
Sustainability Solutions
Support our customers on their journey to
sustainability by increasing the proportion
of revenue generated by our sustainability
solutions to above 50%
 10% adjusted operating
income* CAGR
Supporting personal development
Support the personal development of our
employees by increasing the completion rate
of job-related training by 10%³
Integrity principles
Reduce the impact that our supply chain
has on society by committing our strategic
suppliers to support our integrity principles
Strong Economic Value Added discipline
(EVA)
Positive impact on communities
Increase by 10%³ our positive impact
on our communities through employee
volunteering, focusing on vulnerable groups
including those affected by pandemics
Energy efficiency
Increasing annually the number of energy
efficiency measures in our 100 most energy
intensive owned buildings
Maintain or grow the dividend
per share
1.	 Constant currency (CCY)*.
2.	 Against a 2014 baseline.
3.	 Against a 2019 baseline.
*	 Alternative Performance Measures (APM), refer to the ‘2022 Half Year APM’ document.
3
2022 Half Year
Results
SGS | 2022 Half Year Results
*	 Alternative Performance Measures (APM), refer to the ‘2022 Half Year APM’ document.
Outlook 2022
•	 Mid-single digit organic growth
•	 Improving adjusted operating income* with margin* at a similar level to prior year
•	 Strong cash conversion
•	 Maintain best-in-class organic return on invested capital*
•	 Accelerate investment into our strategic focus areas with MA as a key differentiator
•	 At least maintain the dividend and utilize our new share buyback program on an opportunistic basis as part of our flexible capital
allocation strategy
Subsequent events
On 5 July 2022, the Group announced the acquisition of Silver State Analytical Laboratories, Inc. and its sister company Excelchem
Laboratories, Inc. in the United States. They provide quality analytical and microbiological testing (certified and independent) and support
services for clients in the environmental, water, utility, engineering, construction, food processing, chemical, mining, healthcare, resort and
hospitality industries.
On 8 July 2022, the Group announced the acquisition of proderm GmbH in Germany, a leading provider of advanced clinical testing solutions
for cosmetics, personal care and medical products.
Board changes
On 29 March 2022, Phyllis Cheung was elected as a member of the Board of Directors bringing 30 years of experience in the consumer
industry. In her most recent role as CEO of McDonald’s China, Ms. Cheung successfully doubled the number of restaurants in China and led
the company’s digital transformation to elevate the customer dining experience through omni-channel digital platforms.
Significant shareholders
As at 30 June 2022, Groupe Bruxelles Lambert (acting through Serena SARL and URDAC) held 19.11% (December 2021: 19.11%) and
BlackRock Inc. held 5.02% (December 2021: below 5%) of the share capital and voting rights of the company. At the same date, the Group
held 0.38% of the share capital of the company (December 2021: 0.04%).
Calvin Grieder
Chair of the Board of Directors
Frankie Ng
Chief Executive Officer
19 July 2022
2022 Half Year
Results
4
SGS | 2022 Half Year Results
(CHF million) June 2022 June 2021
Change
in %
June 2021
CCY1
Change in
CCY1
%
Revenue 642 618 3.9 616 4.2
Adjusted operating income* 149 142 4.9 141 5.7
Margin %* 23.2 23.0 22.9
Connectivity  Products revenue grew by 4.2% at constant currency (organic growth was 3.1%) to CHF 642 million despite the impact of
Covid-related restrictions in China.
Connectivity organic growth was above the divisional average across all segments. Strong double-digit organic growth in Q1, supported by
our investments in high technology segments and product safety, was partially offset by Covid-related restrictions on restricted substances
testing and field services in China. Brightsight positively contributed to performance.
Softlines grew organically well above the divisional average as the market continued its recovery. Disruption in China was minimized through
effective domestic sample management, while Turkey, India and Bangladesh all gained market share.
Hardlines declined organically, impacted by supply chain disruption in Hardgoods with particularly challenging market conditions in
automotive.
Trade Facilitation Services reported solid organic growth driven by the expansion of eCustoms services in Europe. The strong performance
was achieved notwithstanding the challenging market conditions.
The adjusted operating income margin increased to 23.2% from 22.9% in prior year (at constant currency), driven by collections in Trade
Facilitation Services, an improvement in profitability in cybersecurity and strong performance from key affiliates such as Turkey, India and
Bangladesh. This more than offset the continued long-term investment in our network and the impact of Covid-related restrictions in China.
(CHF million) June 2022 June 2021
Change
in %
June 2021
CCY1
Change in
CCY1
%
Revenue 442 414 6.8 406 8.9
Adjusted operating income* 55 64 (14.1) 63 (12.7)
Margin %* 12.4 15.5 15.5
Health  Nutrition revenue grew by 8.9% at constant currency (organic growth was 5.2%) to CHF 442 million supported by growth
across all geographies and recent acquisitions. Strong growth was achieved despite the remaining pandemic restrictions and a reduction
in COVID-19 vaccine-related activities.
Food grew organically above the divisional average supported by growth across the network.
Crop Science performance was impacted by the slowdown in environmental impact studies on plant protection products in Europe and
lower seed testing volumes.
Health Science grew organically below the divisional average impacted by a significant reduction in Covid vaccine-related testing; much
of this volume has already been replaced and these projects are starting to ramp up. Excluding this impact, growth was strong, notably
Clinical Research, while our recent acquisitions added to reported growth.
Cosmetics  Hygiene grew broadly in line with the divisional organic average, supported by growing clinical and panel activity, while
reported growth was complemented by the acquisition of IDEA.
The adjusted operating income margin decreased to 12.4% from 15.5% in prior year (at constant currency) affected by the end of Covid
vaccine-related testing, disruption in China in Q2 and continued investment in our global lab network.
Connectivity  Products
Health  Nutrition
1.	 Constant currency (CCY) – Definition in APM.
*	 Alternative Performance Measures (APM), refer to the ‘2022 Half Year APM’ document.
5
2022 Half Year
Results
SGS | 2022 Half Year Results
(CHF million) June 2022 June 2021
Change
in %
June 2021
CCY1
Change in
CCY1
%
Revenue 1 070 1 033 3.6 1 009 6.0
Adjusted operating income* 92 99 (7.1) 97 (5.2)
Margin %* 8.6 9.6 9.6
Industries  Environment revenue increased by 6.0% at constant currency (organic growth was 5.6%) to CHF 1 070 million.
A strong increase in demand for environmental field services offset lower volumes of non-destructive testing and supply chain services in
Field Services and Inspection.
Technical Assessment  Advisory delivered double-digit organic growth, continuing to benefit from the increase in supervision and
consulting work in Latin America and a very strong overall performance in Eastern Europe and in the Middle East.
Industrial and Public Health  Safety grew organically above the divisional average. This included good performances in both health 
safety services in Western European countries and material testing in North America, as well as strong volumes in Asia.
Environmental Testing grew below the divisional organic level with double-digit growth in the USA and Latin America partially offset by
lower volumes in some other regions.
Public Mandates revenue declined due to lost contracts in Africa, partly compensated by price increases in Latin American vehicle
compliance services.
Specialty Services organic growth was above the divisional average benefiting from a resumption of upstream services.
The adjusted operating income margin decreased to 8.6% from 9.6% in prior year (at constant currency) mainly due to Covid-related
restrictions in China, the ramp up of new contracts, mix and collection delays from certain governments and related projects. This was
partially offset by the positive performance in our recent acquisition in Technical Assessment  Advisory and the cost synergies achieved
from the integration of SGS Analytics.
(CHF million) June 2022 June 2021
Change
in %
June 2021
CCY1
Change in
CCY1
%
Revenue 766 716 7.0 707 8.3
Adjusted operating income* 98 90 8.9 89 10.1
Margin %* 12.8 12.6 12.6
Natural Resources revenue grew by 8.3% at constant currency (organic growth was 7.6%) to CHF 766 million driven by continued
momentum in the mining industry and a recovery in oil and gas in certain regions.
Trade  Inspection grew below the divisional organic level. High-single digit growth in Minerals Commodities and solid growth in Oil and Gas
Commodities was offset by Agricultural Commodities, the result of volatile meteorological conditions in key markets and trade restrictions.
Laboratory Testing grew in double digits organically. Across the network, Geochemistry volumes are being driven by continued strength
in mineral exploration while we have extended our leadership position in onsite laboratories by winning new laboratory contracts in Latin
America, South East Asia Pacific and Africa. High-single digit organic growth in oil and gas analytical services was supported by outsourcing
in Europe, North America, Central Asia and the acquisition of Sulphur Experts Inc. added to total growth.
Metallurgy  Consulting also delivered double-digit organic growth driven by service expansion and project wins in North and Latin
America.
Market Intelligence grew above the divisional organic average benefiting from the continued rollout of digital services across the supply
chain.
The adjusted operating income margin increased to 12.8% from 12.6% in prior year (at constant currency) supported by the strong
growth in minerals and oil and gas testing activities.
Industries  Environment
Natural Resources
1.	 Constant currency (CCY) – Definition in APM.
*	 Alternative Performance Measures (APM), refer to the ‘2022 Half Year APM’ document.
Acquisitions
•	 Gas Analysis Services
•	 Ecotecnos
•	 AIEX
2022 Half Year
Results
6
SGS | 2022 Half Year Results
(CHF million) June 2022 June 2021
Change
in %
June 2021
CCY1
Change in
CCY1
%
Revenue 335 313 7.0 309 8.4
Adjusted operating income* 64 62 3.2 61 4.9
Margin %* 19.1 19.8 19.7
Knowledge revenue grew by 8.4% at constant currency and organically to CHF 335 million with growth across all strategic business units
and in all geographies.
Management System Certification grew in all geographies organically, but below the divisional average. The lower growth reflects a
challenging comparable period as 2021 was a re-certification year. Food certification delivered strong growth across all regions while medical
devices and security services reported double-digit growth.
Customized Audits grew organically below the divisional average. Second party audit work was impacted by restrictions in China. This was
compensated by double-digit growth from Responsible Business Services across all regions and ESG services.
Consulting grew at a materially higher rate than the divisional organic average. This was primarily driven by the very strong performance of
Maine Pointe, benefiting from strong demand for supply chain optimization and performance improvement services.
Academy organic growth was below the divisional average. A good performance in Africa, Western Europe and Asia excluding China.
The adjusted operating income margin decreased to 19.1% from 19.7% in prior year (at constant currency) impacted by the change in
geographical and service mix.
Knowledge
1.	 Constant currency (CCY) – Definition in APM.
*	 Alternative Performance Measures (APM), refer to the ‘2022 Half Year APM’ document.
7
2022 Half Year
Results
SGS | 2022 Half Year Results
Interim condensed consolidated financial statements
Condensed consolidated income statement
For the period ended 30 June 2022
(CHF million) Notes June 2022 June 2021
Revenue 4 3 255 3 094
Salaries and wages (1 665) (1 576)
Subcontractors’ expenses (193) (187)
Depreciation, amortization and impairment (255) (248)
Other operating expenses (719) (653)
Operating income (EBIT) 4 423 430
Financial income 9 6
Financial expenses (29) (29)
Share of profit of associates and joint ventures 1 1
Profit before taxes 404 408
Taxes 6 (110) (118)
Profit for the period 294 290
Profit attributable to:
Equity holders of SGS SA 276 272
Non-controlling interests 18 18
Basic earnings per share (in CHF) 7 36.78 36.29
Diluted earnings per share (in CHF) 7 36.71 36.27
Condensed consolidated statement of comprehensive income
For the period ended 30 June 2022
(CHF million) Notes June 2022 June 2021
Actuarial (losses)/gains on defined benefit plans 13 (22) 39
Income tax on actuarial (losses)/gains 5 (3)
Items that will not be subsequently reclassified to income
statement
(17) 36
Exchange differences (20) 68
Items that may be subsequently reclassified to income
statement
(20) 68
Other comprehensive income/(loss) for the period (37) 104
Profit for the period 294 290
Total comprehensive income for the period 257 394
Attributable to:
Equity holders of SGS SA 240 373
Non-controlling interests 17 21
2022 Half Year
Results
8
SGS | 2022 Half Year Results
Condensed consolidated balance sheet
For the period ended 30 June 2022
(CHF million) Notes June 2022 December 2021
Assets
Non-current assets
Property, plant and equipment 930 925
Right-of-use assets 610 605
Goodwill 8 1 761 1 778
Other intangible assets 357 382
Investments in joint ventures, associates and other companies 27 26
Deferred tax assets 183 164
Other non-current assets 147 173
Total non-current assets 4 015 4 053
Current assets
Inventories 60 59
Unbilled revenues and work in progress 242 175
Trade receivables 975 928
Other receivables and prepayments 278 204
Current tax assets 107 108
Cash and cash equivalents 1 118 1 480
Total current assets 2 780 2 954
Total assets 6 795 7 007
Equity and liabilities
Capital and reserves
Share capital 7 7
Reserves 757 1 118
Treasury shares (64) (8)
Equity attributable to equity holders of SGS SA 700 1 117
Non-controlling interests 99 85
Total equity 799 1 202
Non-current liabilities
Loans and other financial liabilities 12 2 522 2 889
Lease liabilities 479 481
Deferred tax liabilities 82 92
Defined benefit obligations 74 84
Provisions 91 90
Total non-current liabilities 3 248 3 636
Current liabilities
Trade and other payables 646 687
Contract liabilities 229 221
Current tax liabilities 162 169
Loans and other financial liabilities 12 959 282
Lease liabilities 162 155
Provisions 61 60
Other creditors and accruals 529 595
Total current liabilities 2 748 2 169
Total liabilities 5 996 5 805
Total equity and liabilities 6 795 7 007
9
2022 Half Year
Results
SGS | 2022 Half Year Results
Condensed consolidated statement of changes in equity
For the period ended 30 June 2022
Attributable to:
(CHF million)
Share
capital
Treasury
shares
Capital
reserve
Cumulative
translation
adjustments
Cumulative
(losses)/gains
on defined
benefit plans
net of tax
Retained
earnings
and
Group
reserves
Equity
holders
of SGS SA
Non-
controlling
interests
Total
equity
Balance at 1 January 2021 8 (230) 160 (1 307) (241) 2 670 1 060 74 1 134
Profit for the period – – – – – 272 272 18 290
Other comprehensive income
for the period
– – – 65 36 – 101 3 104
Total comprehensive income for
the period
– – – 65 36 272 373 21 394
Dividends paid – – – – – (599) (599) (4) (603)
Share-based payments – – 8 – – – 8 – 8
Movement in
non-controlling interests
– – – – – 18 18 4 22
Movement on treasury shares – 53 (42) – – (10) 1 – 1
Balance at 30 June 2021 8 (177) 126 (1 242) (205) 2 351 861 95 956
Balance at 1 January 2022 7 (8) 130 (1 342) (190) 2 520 1 117 85 1 202
Profit for the period – – – – – 276 276 18 294
Other comprehensive income
for the period
– – – (19) (17) – (36) (1) (37)
Total comprehensive income for
the period
– – – (19) (17) 276 240 17 257
Dividends paid – – – – – (599) (599) (3) (602)
Share-based payments – – 9 – – – 9 – 9
Movement in non-controlling
interests
– – – – – (6) (6) – (6)
Movement on treasury shares – (56) (4) – – (1) (61) – (61)
Balance at 30 June 2022 7 (64) 135 (1 361) (207) 2 190 700 99 799
2022 Half Year
Results
10
SGS | 2022 Half Year Results
Condensed consolidated cash flow statement
For the period ended 30 June 2022
(CHF million) Notes June 2022 June 2021
Profit for the period 294 290
Non-cash and non-operating items 405 404
(Increase) in working capital (299) (202)
Taxes paid (137) (150)
Cash flow from operating activities 263 342
Purchase of property, plant and equipment and other intangible assets (156) (150)
Disposal of property, plant and equipment and other intangible assets 6 3
Acquisition of businesses 9 (11) (103)
Cash paid on other non-current assets – (1)
Proceeds received from investments in joint ventures, associates and
other companies
– 2
Interest received 8 7
Proceeds from marketable securities – 1
Cash flow used by investing activities (153) (241)
Dividends paid to equity holders of SGS SA (599) (599)
Dividends paid to non-controlling interests (3) (4)
Transaction with non-controlling interests (9) (11)
Cash paid on treasury shares (51) –
Proceeds from corporate bonds – 817
Payment of corporate bonds (250) (276)
Interest paid (32) (38)
Payment of lease liabilities (92) (91)
Proceeds from borrowings 592 44
Payment of borrowings – (553)
Cash flow used by financing activities (444) (711)
Currency translation (28) 13
(Decrease) in cash and cash equivalents (362) (597)
Cash and cash equivalents at beginning of year 1 480 1 766
(Decrease) in cash and cash equivalents (362) (597)
Cash and cash equivalents at end of the period 1 118 1 169
11
2022 Half Year
Results
SGS | 2022 Half Year Results
1. Activities of the Group
SGS SA and its subsidiaries (the “Group”) operate around the world under the name SGS. The head office of the Group is located in Geneva,
Switzerland. SGS is the global leader in testing, inspection and certification (TIC) services supporting international trade in agriculture,
minerals, petroleum and consumer products. It also provides these services to governments, international institutions and customers
engaged in the industrial, environmental and life sciences sectors.
2. Basis of preparation and significant events
Basis of preparation
These unaudited interim condensed consolidated financial statements have been prepared in accordance with International Accounting
Standard 34 Interim Financial Reporting and should be read in conjunction with the consolidated financial statements of the Group for the
year-end 31 December 2021 that were prepared in compliance with the International Financial Reporting Standards (IFRS).
COVID-19 pandemic and geopolitical instability
COVID-19 and recent geopolitical events have impacted the economy and financial markets. Many industries are facing challenges, including
supply-chain disruption, inflation, deteriorating credit and liquidity concerns. Most notably, the Group’s half-year operational performance was
temporarily affected by Covid-related restrictions in China. The Group exposure to Russia and Ukraine is limited.
Consequently, these 2022 interim condensed consolidated financial statements were prepared with particular attention to (i) the impairment
of non-current assets, (ii) the appropriateness of the allowances for trade receivables, unbilled revenue and work in progress, (iii) the level
of provision for risks, as well as (iv) accounting for government grants. No material impacts were recognized in these interim condensed
consolidated financial statements.
3. Changes to the Group’s accounting policies
The accounting policies used in the preparation and presentation of the interim condensed consolidated financial statements are consistent
with those used in the annual consolidated financial statements of the Group.
Several new amendments and interpretations were adopted effective 1 January 2022 but have no material impact on the Group’s interim
condensed consolidated financial statements.
4. Analysis of operating income
(CHF million) June 2022 June 2021
Adjusted operating income* 458 457
Amortization and impairment of acquired intangibles (19) (19)
Restructuring costs (10) (1)
Transaction and integration costs (6) (7)
Operating income 423 430
June 2022
(CHF million) Revenue
Adjusted
operating
income*
Amortization
of acquisition
intangibles
Restructuring
costs
Transaction
and integration
costs
Operating
income
by business
Connectivity  Products 642 149 (3) (1) – 145
Health  Nutrition 442 55 (5) (1) (2) 47
Industries  Environment 1 070 92 (10) (3) (3) 76
Natural Resources 766 98 – (4) (1) 93
Knowledge 335 64 (1) (1) – 62
Total 3 255 458 (19) (10) (6) 423
Notes to the interim condensed consolidated financial statements
*	 Alternative Performance Measures (APM), refer to the ‘2022 Half Year APM’ document.
2022 Half Year
Results
12
SGS | 2022 Half Year Results
June 2021
(CHF million) Revenue
Adjusted
operating
income*
Amortization
of acquisition
intangibles
Restructuring
costs
Transaction
and integration
costs
Operating
income
by business
Connectivity  Products 618 142 (1) – – 141
Health  Nutrition 414 64 (2) – (3) 59
Industries  Environment 1 033 99 (11) – (4) 84
Natural Resources 716 90 (1) (1) – 88
Knowledge 313 62 (4) – – 58
Total 3 094 457 (19) (1) (7) 430
All segment revenues reported above are from external customers. The adjusted operating income* represents the profit earned by each
segment. This is the main measure reported to the chief operating decision makers for the purposes of resource allocation and assessment
of segmental performance.
5. Revenue from contracts with customers
Group’s revenue from contracts with customers by timing of recognition
June 2022 June 2021
(CHF million)
Services
transferred at
a point in time
Services
transferred
over time
Services
transferred at
a point in time
Services
transferred
over time
Connectivity  Products 85% 15% 86% 14%
Health  Nutrition 84% 16% 86% 14%
Industries  Environment 71% 29% 68% 32%
Natural Resources 84% 16% 83% 17%
Knowledge 90% 10% 97% 3%
Total 80% 20% 80% 20%
6. Taxes
(CHF million) June 2022 June 2021
Current taxes 136 130
Deferred tax (credit) relating to the origination and reversal
of temporary differences
(26) (12)
Total 110 118
(CHF million) June 2022 June 2021
Profit before taxes 404 408
Tax at statutory rates applicable to the profits earned in the country concerned 76 80
Tax effect of non-deductible or non-taxable items 8 9
Tax effect on losses not currently treated as being recoverable in future years 1 1
Tax effect on losses previously considered irrecoverable, now expected to be recoverable (2) (4)
Non-creditable foreign withholding taxes 21 18
Minimum taxes 4 2
Prior period adjustments 1 5
Rate changes – 6
Other 1 1
Tax charge 110 118
*	 Alternative Performance Measures (APM), refer to the ‘2022 Half Year APM’ document.
13
2022 Half Year
Results
SGS | 2022 Half Year Results
7. Earnings Per Share
June 2022 June 2021
Profit attributable to equity holders of SGS SA (CHF million) 276 272
Weighted average number of shares (‘000) 7 489 7 485
Basic earnings per share (CHF) 36.78 36.29
June 2022 June 2021
Profit attributable to equity holders of SGS SA (CHF million) 276 272
Diluted weighted average number of shares (‘000) 7 504 7 491
Diluted earnings per share (CHF) 36.71 36.27
8. Goodwill
(CHF million) June 2022 June 2021
Cost
At 1 January 1 778 1 651
Additions 14 79
Consideration / fair value adjustments on prior years’ acquisitions 1 –
Exchange differences (32) 44
At end of the period 1 761 1 774
The goodwill arising on acquisitions relates to the value of the underlying business and expected synergies as well as the value of the
qualified workforce that do not meet the criteria for recognition as separable intangible assets. None of the goodwill arising on acquisitions
completed as at 30 June 2022 is expected to be tax deductible.
9. Acquisitions
In H1 2022, the Group completed three acquisitions.
•	 100% of Gas Analysis Services (GAS), a company specialized in instrumentation and gas analysis testing in Ireland (effective
28 February 2022)
•	 100% of Ecotecnos, a company providing sea monitoring and oceanography services in Chile (effective 6 May 2022)
•	 100% of AIEX, a company providing technical and welding inspection services in the nuclear and marine industries in France (effective
9 May 2022)
These companies were acquired for a total consideration of CHF 17 million, out of which CHF 11 million was paid in H1, and the total goodwill
generated on these transactions amounted to CHF 14 million.
All the above transactions contributed a total of CHF 4 million in revenue and CHF 1 million in operating income in H1 2022. Had all
acquisitions been effective 1 January 2022, the revenue for the period from these acquisitions would have been CHF 7 million and the
operating income would have been CHF 1 million.
Date Location Division FTE
Gas Analysis Services 28 February 2022 Ireland Industries  Environment 36
Ecotecnos 6 May 2022 Chile Industries  Environment 27
AIEX 9 May 2022 France Industries  Environment 24
In compliance with IFRS 3, fair value on acquisition remains provisional for a 12-month period following the date of acquisition, during which
the Group can finalize the purchase price allocation.
The Group incurred transaction-related costs of CHF 6 million (2021: CHF 7 million) related to integration costs, external legal fees, due
diligence expenses and the costs of maintaining an internal acquisition department. These expenses are reported within other operating
expenses in the interim condensed consolidated income statement.
2022 Half Year
Results
14
SGS | 2022 Half Year Results
10. Credit risk management
Credit risk arises from the possibility that customers may not be able to settle their obligations as agreed. It arises principally from the Group’s
commercial activities. Trade receivable, unbilled revenues and work in progress are subject to a policy of active risk management which
focuses on the assessment of country risk, credit limits and approval procedures. Due to its large geographic base and number of customers,
the Group is not exposed to material concentrations of credit risk on its trade receivables, unbilled revenue and work in progress.
As at 30 June 2022, unbilled revenue and work in progress amounted to CHF 242 million (December 2021: CHF 175 million) which is net of
an allowance for expected credit losses of CHF 19 million (December 2021: CHF 15 million).
Set out below is the information about the credit risk exposure on the Group’s trade receivables using a provision matrix based on aging of
trade receivables as of invoice date at 30 June 2022.
(CHF million)
Expected credit
loss range Gross carrying amount Expected credit loss
0 - 90 days 0%-5% 880 4
91 - 120 days 10%-25% 55 10
121 - 180 days 20%-50% 49 16
181 - 240 days 35%-75% 29 14
241 - 300 days 50%-75% 16 11
301 - 360 days 75%-100% 10 9
 360 days 100% 106 106
Total 1 145 170
Set out below is the information about the credit risk exposure on the Group’s trade receivables using a provision matrix based on aging of
trade receivables as of invoice date at 31 December 2021.
(CHF million)
Expected credit
loss range Gross carrying amount Expected credit loss
0 - 90 days 0%-5% 863 4
91 - 120 days 10%-25% 43 8
121 - 180 days 20%-50% 36 14
181 - 240 days 35%-75% 20 12
241 - 300 days 50%-75% 11 8
301 - 360 days 75%-100% 7 6
 360 days 100% 110 110
Total 1 090 162
11. Fair value measurement recognized in the balance sheet
There was no transfer between fair value level categories during the period. Derivative assets 2022: CHF 27 million (2021: CHF 11 million)
qualify as Level 2 fair value measurement category. Derivative assets consist of foreign currency forward contracts that are measured using
quoted forward exchange rates and yield curves derived from quoted interest rates matching maturities of the contract.
The corporate bonds qualify as fair value Level 1, which amounts to CHF 2 685 million (2021: CHF 3 166 million).
Other financial liabilities include CHF 29 million qualifying as fair value Level 3 (2021: CHF 33 million), which represents the estimated present
value of the redemption amount to acquire the remaining non-controlling interests of acquisitions if the put/call option is exercised.
Subsequent changes in the valuation of the redemption amount to acquire the remaining non-controlling interests of acquisitions if the put/
call option is exercised shall be recognized directly in equity attributable to owners, including the unwinding of the discount.
The remaining other financial liabilities qualify as Level 2, determined in accordance with generally accepted pricing models.
15
2022 Half Year
Results
SGS | 2022 Half Year Results
12. Loans and other financial liabilities
(CHF million) June 2022 December 2021
Bank loans and commercial paper 579 5
Corporate bonds 2 819 3 100
Put option on acquisition 29 33
Other financial liabilities 26 26
Derivatives 28 7
Total 3 481 3 171
Current 959 282
Non-current 2 522 2 889
Liquidity risk management
In H1 2022, the Group reimbursed two bonds maturing in February 2022, for a total amount of CHF 250 million. Furthermore, the Group
started to issue commercial paper out of its EUR 1 billion Euro Commercial Paper (ECP) program, for an amount of EUR 334 million
(CHF 334 million) as at 30 June 2022, as well as withdrew EUR 200 million (CHF 200 million) as at 30 June 2022 from its EUR 1 billion
sustainability-linked revolving credit facility.
13. Defined Benefit obligations
COVID-19 and recent geopolitical events have had a significant impact on market fluctuations. Discount rates rose since 31 December 2021,
while year-to-date equity and bond returns are negative. SGS remeasured the defined benefit plans in Switzerland, the USA, and the UK
as at 30 June 2022. The impact on the net pension liability for the first six months of 2022 is an actuarial loss of CHF 22 million. It has been
recognized in other comprehensive income and is subject to future volatility.
14. Subsequent events
On 5 July 2022, the Group announced the acquisition of Silver State Analytical Laboratories, Inc. and its sister company Excelchem
Laboratories, Inc. in the United States. They provide quality analytical and microbiological testing (certified and independent) and support
services for clients in the environmental, water, utility, engineering, construction, food processing, chemical, mining, healthcare, resort and
hospitality industries.
On 8 July 2022, the Group announced the acquisition of 100% of the shares of proderm GmbH, for a purchase price of CHF 45 Mio.
Founded in 1994, proderm is a clinical research organization, specialized in advanced solutions for cosmetics and personal care as well as
medical clinical studies. This acquisition further supports the Group strategic expansion in cosmetics and hygiene as part of our Health 
Nutrition division.
The financial effects of the above transactions have not been brought to account at 30 June 2022. The operating results and assets and
liabilities of the company will be included in our second-half consolidated financial statements.
Assets acquired and liabilities assumed
Following those two subsequent acquisitions, SGS has started the purchase price allocation (PPA) exercise. Specifically, intangible assets
identification and fair valuation are still at a very early stage of the PPA process. At the date of publication of these condensed consolidated
financial statements, SGS has thus not completed the initial accounting of the business combinations.
15. Approval of interim condensed consolidated financial statements and subsequent events
These interim condensed consolidated financial statements were authorized for issue by the Board of Directors on 18 July 2022.
16. Exchange rates
The main currency for the Group were translated at the following exchange rates into Swiss Francs.
Statement of financial position
period-end rates
Income statement
period average rates
June 2022 December 2021 June 2022 June 2021
Australia AUD 100 65.71 66.59 67.97 70.02
Canada CAD 100 73.95 71.65 74.23 72.79
Chile CLP 100 0.10 0.11 0.11 0.13
China CNY 100 14.26 14.40 14.57 14.03
Eurozone EUR 100 99.70 103.78 103.23 109.43
Korea KRW 100 0.07 0.08 0.08 0.08
United Kingdom GBP 100 115.93 123.57 122.62 126.01
Russia RUB 100 1.84 1.24 1.27 1.22
Taiwan TWD 100 3.21 3.32 3.29 3.24
USA USD 100 95.47 91.72 94.35 90.81
2022 Half Year
Results
16
SGS | 2022 Half Year Results
Shareholder Information
SGS SA corporate office
1 place des Alpes
P.O. Box 2152
CH – 1211 Geneva 1
t	 +41 (0)22 739 91 11
f	 +41 (0)22 739 98 86
e	sgs.investor.relations@sgs.com
www.sgs.com
Stock exchange listing
SIX Swiss Exchange, SGSN
Stock exchange trading
SIX Swiss Exchange
Common stock symbols
Bloomberg: Registered Share: SGSN.SW
Reuters: Registered Share: SGSN.S
Telekurs: Registered Share: SGSN
ISIN: Registered Share: CH0002497458
Swiss security number: 249745
Investor Relations
Toby Reeks
SGS SA
1 place des Alpes
P.O. Box 2152
CH – 1211 Geneva 1
t	 +41 (0)22 739 99 87
m	 +44 7899 800 575
www.sgs.com
Investor days
17-20 November 2022
Istanbul, Turkey
2023 full year results
Thursday, 26 January 2023
Annual General Meeting
of Shareholders
Tuesday, 28 March 2023
Geneva Switzerland
Media relations
Magali Dauwalder
SGS SA
1 place des Alpes
P.O. Box 2152
CH – 1211 Geneva 1
t	 +41 (0)22 739 95 51
m	 +41 (0)79 329 46 70
www.sgs.com
Disclaimer
This material is provided for information
purposes only and is not intended to
confer any legal rights to you.
This document does not constitute
an invitation to invest in SGS shares.
Any decisions you make in reliance on this
information are solely your responsibility.
This document is given as of the dates
specified, is not updated and any forward-
looking statements are made subject to the
following reservations:
This document contains certain forward-
looking statements that are neither historical
facts nor guarantees of future performance.
Because these statements involve risks
and uncertainties that are beyond control
or estimation of SGS, there are important
factors that could cause actual results
to differ materially from those expressed
or implied by these forward-looking
statements. These statements speak
only as of the date of this document.
Except as required by any applicable law
or regulation, SGS expressly disclaims any
obligation to release publicly any updates or
revisions to any forward-looking statements
contained herein to reflect any change in
SGS Group’s expectations with regard
thereto or any change in events or conditions
on which any such statements are based.
© SGS SA – 2022 – All Rights Reserved. SGS is a registered
trademark of SGS Société Générale de Surveillance SA.

Más contenido relacionado

Similar a SGS 2022 Half Year Results Report

Solvay 9 months 2018 results - Presentation
Solvay 9 months 2018 results - PresentationSolvay 9 months 2018 results - Presentation
Solvay 9 months 2018 results - PresentationSolvay Group
 
Bruker Q3'18 Earnings Slides
Bruker Q3'18 Earnings SlidesBruker Q3'18 Earnings Slides
Bruker Q3'18 Earnings SlidesInvestorBruker
 
SGS 2023 Results and Strategic Update.pdf
SGS 2023 Results and Strategic Update.pdfSGS 2023 Results and Strategic Update.pdf
SGS 2023 Results and Strategic Update.pdfSGS
 
SGS 2017 Half Year Results
SGS 2017 Half Year ResultsSGS 2017 Half Year Results
SGS 2017 Half Year ResultsSGS
 
SGS 2022 Full Year Results Presentation
SGS 2022 Full Year Results PresentationSGS 2022 Full Year Results Presentation
SGS 2022 Full Year Results PresentationSGS
 
Q2'18 earnings slides final 2 aug18
Q2'18 earnings slides final 2 aug18Q2'18 earnings slides final 2 aug18
Q2'18 earnings slides final 2 aug18InvestorBruker
 
Q118 earnings slides final 03 may18
Q118 earnings slides final 03 may18Q118 earnings slides final 03 may18
Q118 earnings slides final 03 may18InvestorBruker
 
SGS 2015 Annual Report
SGS 2015 Annual ReportSGS 2015 Annual Report
SGS 2015 Annual ReportSGS
 
FY-2021-Results-2022-24-Plan.pdf
FY-2021-Results-2022-24-Plan.pdfFY-2021-Results-2022-24-Plan.pdf
FY-2021-Results-2022-24-Plan.pdfGruppo TIM
 
SGS 2016 Annual Report
SGS 2016 Annual ReportSGS 2016 Annual Report
SGS 2016 Annual ReportSGS
 
Business_Presentation_Update.pdf
Business_Presentation_Update.pdfBusiness_Presentation_Update.pdf
Business_Presentation_Update.pdfAnupaRathore
 
FY 2020 results
FY 2020 resultsFY 2020 results
FY 2020 resultsSnam
 
TIM Group - Q2-2022 Results
TIM Group - Q2-2022 ResultsTIM Group - Q2-2022 Results
TIM Group - Q2-2022 ResultsGruppo TIM
 
RIL-4Q-FY23-Analyst-Presentation.pdf
RIL-4Q-FY23-Analyst-Presentation.pdfRIL-4Q-FY23-Analyst-Presentation.pdf
RIL-4Q-FY23-Analyst-Presentation.pdfRACHNASAHA2
 
Q3 15 earnings slides-final
Q3 15 earnings slides-finalQ3 15 earnings slides-final
Q3 15 earnings slides-finalInvestorBruker
 
Klöckner & Co SE Press Conference Presentation Q2 2016 results
Klöckner & Co SE Press Conference Presentation Q2 2016 resultsKlöckner & Co SE Press Conference Presentation Q2 2016 results
Klöckner & Co SE Press Conference Presentation Q2 2016 resultsKlöckner & Co SE
 
Presentation of the CEO Dr. Bernd Scheifele, Annual General Meeting 2017
Presentation of the CEO Dr. Bernd Scheifele, Annual General Meeting 2017Presentation of the CEO Dr. Bernd Scheifele, Annual General Meeting 2017
Presentation of the CEO Dr. Bernd Scheifele, Annual General Meeting 2017HeidelbergCement
 
SGS 2020 Integrated Annual Report
SGS 2020 Integrated Annual ReportSGS 2020 Integrated Annual Report
SGS 2020 Integrated Annual ReportSGS
 
Leonardo 1H 2023 Results
Leonardo 1H 2023 ResultsLeonardo 1H 2023 Results
Leonardo 1H 2023 ResultsLeonardo
 

Similar a SGS 2022 Half Year Results Report (20)

Solvay 9 months 2018 results - Presentation
Solvay 9 months 2018 results - PresentationSolvay 9 months 2018 results - Presentation
Solvay 9 months 2018 results - Presentation
 
Bruker Q3'18 Earnings Slides
Bruker Q3'18 Earnings SlidesBruker Q3'18 Earnings Slides
Bruker Q3'18 Earnings Slides
 
SGS 2023 Results and Strategic Update.pdf
SGS 2023 Results and Strategic Update.pdfSGS 2023 Results and Strategic Update.pdf
SGS 2023 Results and Strategic Update.pdf
 
SGS 2017 Half Year Results
SGS 2017 Half Year ResultsSGS 2017 Half Year Results
SGS 2017 Half Year Results
 
SGS 2022 Full Year Results Presentation
SGS 2022 Full Year Results PresentationSGS 2022 Full Year Results Presentation
SGS 2022 Full Year Results Presentation
 
Q2'18 earnings slides final 2 aug18
Q2'18 earnings slides final 2 aug18Q2'18 earnings slides final 2 aug18
Q2'18 earnings slides final 2 aug18
 
Q118 earnings slides final 03 may18
Q118 earnings slides final 03 may18Q118 earnings slides final 03 may18
Q118 earnings slides final 03 may18
 
SGS 2015 Annual Report
SGS 2015 Annual ReportSGS 2015 Annual Report
SGS 2015 Annual Report
 
FY-2021-Results-2022-24-Plan.pdf
FY-2021-Results-2022-24-Plan.pdfFY-2021-Results-2022-24-Plan.pdf
FY-2021-Results-2022-24-Plan.pdf
 
SGS 2016 Annual Report
SGS 2016 Annual ReportSGS 2016 Annual Report
SGS 2016 Annual Report
 
Business_Presentation_Update.pdf
Business_Presentation_Update.pdfBusiness_Presentation_Update.pdf
Business_Presentation_Update.pdf
 
FY 2020 results
FY 2020 resultsFY 2020 results
FY 2020 results
 
TIM Group - Q2-2022 Results
TIM Group - Q2-2022 ResultsTIM Group - Q2-2022 Results
TIM Group - Q2-2022 Results
 
Q317 earnings slides
Q317 earnings slidesQ317 earnings slides
Q317 earnings slides
 
RIL-4Q-FY23-Analyst-Presentation.pdf
RIL-4Q-FY23-Analyst-Presentation.pdfRIL-4Q-FY23-Analyst-Presentation.pdf
RIL-4Q-FY23-Analyst-Presentation.pdf
 
Q3 15 earnings slides-final
Q3 15 earnings slides-finalQ3 15 earnings slides-final
Q3 15 earnings slides-final
 
Klöckner & Co SE Press Conference Presentation Q2 2016 results
Klöckner & Co SE Press Conference Presentation Q2 2016 resultsKlöckner & Co SE Press Conference Presentation Q2 2016 results
Klöckner & Co SE Press Conference Presentation Q2 2016 results
 
Presentation of the CEO Dr. Bernd Scheifele, Annual General Meeting 2017
Presentation of the CEO Dr. Bernd Scheifele, Annual General Meeting 2017Presentation of the CEO Dr. Bernd Scheifele, Annual General Meeting 2017
Presentation of the CEO Dr. Bernd Scheifele, Annual General Meeting 2017
 
SGS 2020 Integrated Annual Report
SGS 2020 Integrated Annual ReportSGS 2020 Integrated Annual Report
SGS 2020 Integrated Annual Report
 
Leonardo 1H 2023 Results
Leonardo 1H 2023 ResultsLeonardo 1H 2023 Results
Leonardo 1H 2023 Results
 

Más de SGS

SGS First Quarter 2024 Sales Update Press Release EN.pdf
SGS First Quarter 2024 Sales Update Press Release EN.pdfSGS First Quarter 2024 Sales Update Press Release EN.pdf
SGS First Quarter 2024 Sales Update Press Release EN.pdfSGS
 
SGS First Quarter 2024 Sales Update Presentation EN.pdf
SGS First Quarter 2024 Sales Update Presentation EN.pdfSGS First Quarter 2024 Sales Update Presentation EN.pdf
SGS First Quarter 2024 Sales Update Presentation EN.pdfSGS
 
SGS 2023 Half Year Results Presentation
SGS 2023 Half Year Results PresentationSGS 2023 Half Year Results Presentation
SGS 2023 Half Year Results PresentationSGS
 
SGS 2022 Full Year Results Alternative Performance Measures Report
SGS 2022 Full Year Results Alternative Performance Measures ReportSGS 2022 Full Year Results Alternative Performance Measures Report
SGS 2022 Full Year Results Alternative Performance Measures ReportSGS
 
SGS 2022 Half Year Results Alternative Performance Measures Report
SGS 2022 Half Year Results Alternative Performance Measures ReportSGS 2022 Half Year Results Alternative Performance Measures Report
SGS 2022 Half Year Results Alternative Performance Measures ReportSGS
 
SGS 2021 Corporate Sustainability Report
SGS 2021 Corporate Sustainability ReportSGS 2021 Corporate Sustainability Report
SGS 2021 Corporate Sustainability ReportSGS
 
SGS 2021 Integrated Annual Report
SGS 2021 Integrated Annual ReportSGS 2021 Integrated Annual Report
SGS 2021 Integrated Annual ReportSGS
 
SGS 2021 Full Year Results Alternative Performance Measures
SGS 2021 Full Year Results Alternative Performance MeasuresSGS 2021 Full Year Results Alternative Performance Measures
SGS 2021 Full Year Results Alternative Performance MeasuresSGS
 
SGS Intron Bulletin
SGS Intron BulletinSGS Intron Bulletin
SGS Intron BulletinSGS
 
Danone Fruit Supply Chain Mapping via Transparency-One Platform
Danone Fruit Supply Chain Mapping via Transparency-One PlatformDanone Fruit Supply Chain Mapping via Transparency-One Platform
Danone Fruit Supply Chain Mapping via Transparency-One PlatformSGS
 
SGS 2021 Half Year Results Alternative Performance Measures Report
SGS 2021 Half Year Results Alternative Performance Measures ReportSGS 2021 Half Year Results Alternative Performance Measures Report
SGS 2021 Half Year Results Alternative Performance Measures ReportSGS
 
SGS 2021 Half Year Results Presentation
SGS 2021 Half Year Results PresentationSGS 2021 Half Year Results Presentation
SGS 2021 Half Year Results PresentationSGS
 
SGS INTRON BULLETIN – NUMMER 33
SGS INTRON BULLETIN – NUMMER 33SGS INTRON BULLETIN – NUMMER 33
SGS INTRON BULLETIN – NUMMER 33SGS
 
SGS 2020 Full Year Results Presentation
SGS 2020 Full Year Results PresentationSGS 2020 Full Year Results Presentation
SGS 2020 Full Year Results PresentationSGS
 
SGS INTRON BULLETIN – NUMMER 32
SGS INTRON BULLETIN – NUMMER 32SGS INTRON BULLETIN – NUMMER 32
SGS INTRON BULLETIN – NUMMER 32SGS
 
SGS INTRON BULLETIN - SEPTEMBER 2020
SGS INTRON BULLETIN - SEPTEMBER 2020SGS INTRON BULLETIN - SEPTEMBER 2020
SGS INTRON BULLETIN - SEPTEMBER 2020SGS
 
SGS 2020 Half Year Results Presentation
SGS 2020 Half Year Results PresentationSGS 2020 Half Year Results Presentation
SGS 2020 Half Year Results PresentationSGS
 
SGS INTRON BULLETIN – NUMMER 31
SGS INTRON BULLETIN – NUMMER 31SGS INTRON BULLETIN – NUMMER 31
SGS INTRON BULLETIN – NUMMER 31SGS
 
SGS Expertise for COVID-19 Clinical Trials
SGS Expertise for COVID-19 Clinical TrialsSGS Expertise for COVID-19 Clinical Trials
SGS Expertise for COVID-19 Clinical TrialsSGS
 
SGS 2019 Integrated Annual Report
SGS 2019 Integrated Annual ReportSGS 2019 Integrated Annual Report
SGS 2019 Integrated Annual ReportSGS
 

Más de SGS (20)

SGS First Quarter 2024 Sales Update Press Release EN.pdf
SGS First Quarter 2024 Sales Update Press Release EN.pdfSGS First Quarter 2024 Sales Update Press Release EN.pdf
SGS First Quarter 2024 Sales Update Press Release EN.pdf
 
SGS First Quarter 2024 Sales Update Presentation EN.pdf
SGS First Quarter 2024 Sales Update Presentation EN.pdfSGS First Quarter 2024 Sales Update Presentation EN.pdf
SGS First Quarter 2024 Sales Update Presentation EN.pdf
 
SGS 2023 Half Year Results Presentation
SGS 2023 Half Year Results PresentationSGS 2023 Half Year Results Presentation
SGS 2023 Half Year Results Presentation
 
SGS 2022 Full Year Results Alternative Performance Measures Report
SGS 2022 Full Year Results Alternative Performance Measures ReportSGS 2022 Full Year Results Alternative Performance Measures Report
SGS 2022 Full Year Results Alternative Performance Measures Report
 
SGS 2022 Half Year Results Alternative Performance Measures Report
SGS 2022 Half Year Results Alternative Performance Measures ReportSGS 2022 Half Year Results Alternative Performance Measures Report
SGS 2022 Half Year Results Alternative Performance Measures Report
 
SGS 2021 Corporate Sustainability Report
SGS 2021 Corporate Sustainability ReportSGS 2021 Corporate Sustainability Report
SGS 2021 Corporate Sustainability Report
 
SGS 2021 Integrated Annual Report
SGS 2021 Integrated Annual ReportSGS 2021 Integrated Annual Report
SGS 2021 Integrated Annual Report
 
SGS 2021 Full Year Results Alternative Performance Measures
SGS 2021 Full Year Results Alternative Performance MeasuresSGS 2021 Full Year Results Alternative Performance Measures
SGS 2021 Full Year Results Alternative Performance Measures
 
SGS Intron Bulletin
SGS Intron BulletinSGS Intron Bulletin
SGS Intron Bulletin
 
Danone Fruit Supply Chain Mapping via Transparency-One Platform
Danone Fruit Supply Chain Mapping via Transparency-One PlatformDanone Fruit Supply Chain Mapping via Transparency-One Platform
Danone Fruit Supply Chain Mapping via Transparency-One Platform
 
SGS 2021 Half Year Results Alternative Performance Measures Report
SGS 2021 Half Year Results Alternative Performance Measures ReportSGS 2021 Half Year Results Alternative Performance Measures Report
SGS 2021 Half Year Results Alternative Performance Measures Report
 
SGS 2021 Half Year Results Presentation
SGS 2021 Half Year Results PresentationSGS 2021 Half Year Results Presentation
SGS 2021 Half Year Results Presentation
 
SGS INTRON BULLETIN – NUMMER 33
SGS INTRON BULLETIN – NUMMER 33SGS INTRON BULLETIN – NUMMER 33
SGS INTRON BULLETIN – NUMMER 33
 
SGS 2020 Full Year Results Presentation
SGS 2020 Full Year Results PresentationSGS 2020 Full Year Results Presentation
SGS 2020 Full Year Results Presentation
 
SGS INTRON BULLETIN – NUMMER 32
SGS INTRON BULLETIN – NUMMER 32SGS INTRON BULLETIN – NUMMER 32
SGS INTRON BULLETIN – NUMMER 32
 
SGS INTRON BULLETIN - SEPTEMBER 2020
SGS INTRON BULLETIN - SEPTEMBER 2020SGS INTRON BULLETIN - SEPTEMBER 2020
SGS INTRON BULLETIN - SEPTEMBER 2020
 
SGS 2020 Half Year Results Presentation
SGS 2020 Half Year Results PresentationSGS 2020 Half Year Results Presentation
SGS 2020 Half Year Results Presentation
 
SGS INTRON BULLETIN – NUMMER 31
SGS INTRON BULLETIN – NUMMER 31SGS INTRON BULLETIN – NUMMER 31
SGS INTRON BULLETIN – NUMMER 31
 
SGS Expertise for COVID-19 Clinical Trials
SGS Expertise for COVID-19 Clinical TrialsSGS Expertise for COVID-19 Clinical Trials
SGS Expertise for COVID-19 Clinical Trials
 
SGS 2019 Integrated Annual Report
SGS 2019 Integrated Annual ReportSGS 2019 Integrated Annual Report
SGS 2019 Integrated Annual Report
 

Último

VVIP Pune Call Girls Handewadi WhatSapp Number 8005736733 With Elite Staff An...
VVIP Pune Call Girls Handewadi WhatSapp Number 8005736733 With Elite Staff An...VVIP Pune Call Girls Handewadi WhatSapp Number 8005736733 With Elite Staff An...
VVIP Pune Call Girls Handewadi WhatSapp Number 8005736733 With Elite Staff An...SUHANI PANDEY
 
Editing progress 20th march.docxxxxxxxxx
Editing progress 20th march.docxxxxxxxxxEditing progress 20th march.docxxxxxxxxx
Editing progress 20th march.docxxxxxxxxxMollyBrown86
 
Pakistani Call girls in Ajman +971563133746 Ajman Call girls
Pakistani Call girls in Ajman +971563133746 Ajman Call girlsPakistani Call girls in Ajman +971563133746 Ajman Call girls
Pakistani Call girls in Ajman +971563133746 Ajman Call girlsgwenoracqe6
 
Top Rated Call Girls In Podanur 📱 {7001035870} VIP Escorts Podanur
Top Rated Call Girls In Podanur 📱 {7001035870} VIP Escorts PodanurTop Rated Call Girls In Podanur 📱 {7001035870} VIP Escorts Podanur
Top Rated Call Girls In Podanur 📱 {7001035870} VIP Escorts Podanurdharasingh5698
 
Ambala Escorts Service ☎️ 6378878445 ( Sakshi Sinha ) High Profile Call Girls...
Ambala Escorts Service ☎️ 6378878445 ( Sakshi Sinha ) High Profile Call Girls...Ambala Escorts Service ☎️ 6378878445 ( Sakshi Sinha ) High Profile Call Girls...
Ambala Escorts Service ☎️ 6378878445 ( Sakshi Sinha ) High Profile Call Girls...mriyagarg453
 
VVIP Pune Call Girls Sopan Baug WhatSapp Number 8005736733 With Elite Staff A...
VVIP Pune Call Girls Sopan Baug WhatSapp Number 8005736733 With Elite Staff A...VVIP Pune Call Girls Sopan Baug WhatSapp Number 8005736733 With Elite Staff A...
VVIP Pune Call Girls Sopan Baug WhatSapp Number 8005736733 With Elite Staff A...SUHANI PANDEY
 
Teck Investor Presentation, April 24, 2024
Teck Investor Presentation, April 24, 2024Teck Investor Presentation, April 24, 2024
Teck Investor Presentation, April 24, 2024TeckResourcesLtd
 
SME IPO and sme ipo listing consultants .pptx
SME IPO and sme ipo listing consultants .pptxSME IPO and sme ipo listing consultants .pptx
SME IPO and sme ipo listing consultants .pptxindia IPO
 
Collective Mining | Corporate Presentation - April 2024
Collective Mining | Corporate Presentation - April 2024Collective Mining | Corporate Presentation - April 2024
Collective Mining | Corporate Presentation - April 2024CollectiveMining1
 
Enjoy Night⚡Call Girls Udyog Vihar Gurgaon >༒8448380779 Escort Service
Enjoy Night⚡Call Girls Udyog Vihar Gurgaon >༒8448380779 Escort ServiceEnjoy Night⚡Call Girls Udyog Vihar Gurgaon >༒8448380779 Escort Service
Enjoy Night⚡Call Girls Udyog Vihar Gurgaon >༒8448380779 Escort ServiceDelhi Call girls
 
VIP Call Girl Amritsar 7001035870 Enjoy Call Girls With Our Escorts
VIP Call Girl Amritsar 7001035870 Enjoy Call Girls With Our EscortsVIP Call Girl Amritsar 7001035870 Enjoy Call Girls With Our Escorts
VIP Call Girl Amritsar 7001035870 Enjoy Call Girls With Our Escortssonatiwari757
 
Collective Mining | Corporate Presentation - May 2024
Collective Mining | Corporate Presentation - May 2024Collective Mining | Corporate Presentation - May 2024
Collective Mining | Corporate Presentation - May 2024CollectiveMining1
 
Corporate Presentation Probe May 2024.pdf
Corporate Presentation Probe May 2024.pdfCorporate Presentation Probe May 2024.pdf
Corporate Presentation Probe May 2024.pdfProbe Gold
 

Último (20)

VVIP Pune Call Girls Handewadi WhatSapp Number 8005736733 With Elite Staff An...
VVIP Pune Call Girls Handewadi WhatSapp Number 8005736733 With Elite Staff An...VVIP Pune Call Girls Handewadi WhatSapp Number 8005736733 With Elite Staff An...
VVIP Pune Call Girls Handewadi WhatSapp Number 8005736733 With Elite Staff An...
 
(👉゚9999965857 ゚)👉 VIP Call Girls Greater Noida 👉 Delhi 👈 : 9999 Cash Payment...
(👉゚9999965857 ゚)👉 VIP Call Girls Greater Noida  👉 Delhi 👈 : 9999 Cash Payment...(👉゚9999965857 ゚)👉 VIP Call Girls Greater Noida  👉 Delhi 👈 : 9999 Cash Payment...
(👉゚9999965857 ゚)👉 VIP Call Girls Greater Noida 👉 Delhi 👈 : 9999 Cash Payment...
 
Editing progress 20th march.docxxxxxxxxx
Editing progress 20th march.docxxxxxxxxxEditing progress 20th march.docxxxxxxxxx
Editing progress 20th march.docxxxxxxxxx
 
Call Girls 🫤 East Of Kailash ➡️ 9999965857 ➡️ Delhi 🫦 Russian Escorts FULL ...
Call Girls 🫤 East Of Kailash ➡️ 9999965857  ➡️ Delhi 🫦  Russian Escorts FULL ...Call Girls 🫤 East Of Kailash ➡️ 9999965857  ➡️ Delhi 🫦  Russian Escorts FULL ...
Call Girls 🫤 East Of Kailash ➡️ 9999965857 ➡️ Delhi 🫦 Russian Escorts FULL ...
 
Vip Call Girls Vasant Kunj ➡️ Delhi ➡️ 9999965857 No Advance 24HRS Live
Vip Call Girls Vasant Kunj ➡️ Delhi ➡️ 9999965857 No Advance 24HRS LiveVip Call Girls Vasant Kunj ➡️ Delhi ➡️ 9999965857 No Advance 24HRS Live
Vip Call Girls Vasant Kunj ➡️ Delhi ➡️ 9999965857 No Advance 24HRS Live
 
Pakistani Call girls in Ajman +971563133746 Ajman Call girls
Pakistani Call girls in Ajman +971563133746 Ajman Call girlsPakistani Call girls in Ajman +971563133746 Ajman Call girls
Pakistani Call girls in Ajman +971563133746 Ajman Call girls
 
Top Rated Call Girls In Podanur 📱 {7001035870} VIP Escorts Podanur
Top Rated Call Girls In Podanur 📱 {7001035870} VIP Escorts PodanurTop Rated Call Girls In Podanur 📱 {7001035870} VIP Escorts Podanur
Top Rated Call Girls In Podanur 📱 {7001035870} VIP Escorts Podanur
 
(‿ˠ‿) Independent Call Girls Laxmi Nagar 👉 9999965857 👈 Delhi : 9999 Cash Pa...
(‿ˠ‿) Independent Call Girls Laxmi Nagar 👉 9999965857 👈 Delhi  : 9999 Cash Pa...(‿ˠ‿) Independent Call Girls Laxmi Nagar 👉 9999965857 👈 Delhi  : 9999 Cash Pa...
(‿ˠ‿) Independent Call Girls Laxmi Nagar 👉 9999965857 👈 Delhi : 9999 Cash Pa...
 
Ambala Escorts Service ☎️ 6378878445 ( Sakshi Sinha ) High Profile Call Girls...
Ambala Escorts Service ☎️ 6378878445 ( Sakshi Sinha ) High Profile Call Girls...Ambala Escorts Service ☎️ 6378878445 ( Sakshi Sinha ) High Profile Call Girls...
Ambala Escorts Service ☎️ 6378878445 ( Sakshi Sinha ) High Profile Call Girls...
 
@9999965857 🫦 Sexy Desi Call Girls Janakpuri 💓 High Profile Escorts Delhi 🫶
@9999965857 🫦 Sexy Desi Call Girls Janakpuri 💓 High Profile Escorts Delhi 🫶@9999965857 🫦 Sexy Desi Call Girls Janakpuri 💓 High Profile Escorts Delhi 🫶
@9999965857 🫦 Sexy Desi Call Girls Janakpuri 💓 High Profile Escorts Delhi 🫶
 
(INDIRA) Call Girl Kashmir Call Now 8617697112 Kashmir Escorts 24x7
(INDIRA) Call Girl Kashmir Call Now 8617697112 Kashmir Escorts 24x7(INDIRA) Call Girl Kashmir Call Now 8617697112 Kashmir Escorts 24x7
(INDIRA) Call Girl Kashmir Call Now 8617697112 Kashmir Escorts 24x7
 
VVIP Pune Call Girls Sopan Baug WhatSapp Number 8005736733 With Elite Staff A...
VVIP Pune Call Girls Sopan Baug WhatSapp Number 8005736733 With Elite Staff A...VVIP Pune Call Girls Sopan Baug WhatSapp Number 8005736733 With Elite Staff A...
VVIP Pune Call Girls Sopan Baug WhatSapp Number 8005736733 With Elite Staff A...
 
Teck Investor Presentation, April 24, 2024
Teck Investor Presentation, April 24, 2024Teck Investor Presentation, April 24, 2024
Teck Investor Presentation, April 24, 2024
 
SME IPO and sme ipo listing consultants .pptx
SME IPO and sme ipo listing consultants .pptxSME IPO and sme ipo listing consultants .pptx
SME IPO and sme ipo listing consultants .pptx
 
Collective Mining | Corporate Presentation - April 2024
Collective Mining | Corporate Presentation - April 2024Collective Mining | Corporate Presentation - April 2024
Collective Mining | Corporate Presentation - April 2024
 
Enjoy Night⚡Call Girls Udyog Vihar Gurgaon >༒8448380779 Escort Service
Enjoy Night⚡Call Girls Udyog Vihar Gurgaon >༒8448380779 Escort ServiceEnjoy Night⚡Call Girls Udyog Vihar Gurgaon >༒8448380779 Escort Service
Enjoy Night⚡Call Girls Udyog Vihar Gurgaon >༒8448380779 Escort Service
 
Russian Call Girls Rohini Sector 3 💓 Delhi 9999965857 @Sabina Modi VVIP MODEL...
Russian Call Girls Rohini Sector 3 💓 Delhi 9999965857 @Sabina Modi VVIP MODEL...Russian Call Girls Rohini Sector 3 💓 Delhi 9999965857 @Sabina Modi VVIP MODEL...
Russian Call Girls Rohini Sector 3 💓 Delhi 9999965857 @Sabina Modi VVIP MODEL...
 
VIP Call Girl Amritsar 7001035870 Enjoy Call Girls With Our Escorts
VIP Call Girl Amritsar 7001035870 Enjoy Call Girls With Our EscortsVIP Call Girl Amritsar 7001035870 Enjoy Call Girls With Our Escorts
VIP Call Girl Amritsar 7001035870 Enjoy Call Girls With Our Escorts
 
Collective Mining | Corporate Presentation - May 2024
Collective Mining | Corporate Presentation - May 2024Collective Mining | Corporate Presentation - May 2024
Collective Mining | Corporate Presentation - May 2024
 
Corporate Presentation Probe May 2024.pdf
Corporate Presentation Probe May 2024.pdfCorporate Presentation Probe May 2024.pdf
Corporate Presentation Probe May 2024.pdf
 

SGS 2022 Half Year Results Report

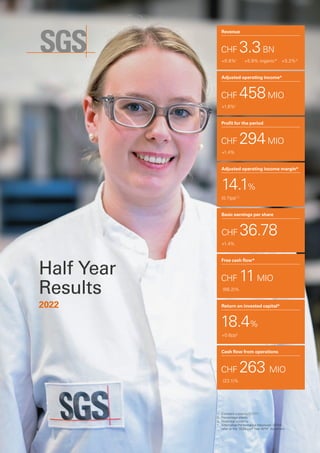
  • 1. 1. Constant currency (CCY)*. 2. Percentage points. 3. Historical currency. * Alternative Performance Measures (APM), refer to the ‘2022 Half Year APM’ document. Half Year Results 2022 Revenue CHF 3.3BN +6.8%1 +5.8% organic*  +5.2%3 Profit for the period CHF 294MIO +1.4% Basic earnings per share CHF 36.78 +1.4% Return on invested capital* 18.4% +0.6pp2 Cash flow from operations CHF 263 MIO (23.1)% Adjusted operating income* CHF 458MIO +1.6%1 Adjusted operating income margin* 14.1% (0.7)pp1,2 Free cash flow* CHF 11MIO (88.2)%
  • 3. Financial Highlights (CHF million) June 2022 June 2021 Change in % June 2021 CCY2 Change in CCY2 % Revenue 3 255 3 094 5.2 3 047 6.8 Operating income (EBIT) 423 430 (1.6) 425 (0.5) Operating income margin 13.0% 13.9% 13.9% Adjusted operating income* 458 457 0.2 451 1.6 Adjusted operating income margin* 14.1% 14.8% 14.8% EBITDA* 678 678 0.0 669 1.3 Adjusted EBITDA* 694 686 1.2 676 2.7 Profit for the period 294 290 1.4 Profit attributable to equity holders of SGS SA 276 272 1.5 Adjusted profit attributable to equity holders of SGS SA* 303 292 3.8 Basic EPS (CHF) 36.78 36.29 1.4 Diluted EPS (CHF) 36.71 36.27 1.2 Adjusted basic EPS (CHF)* 40.37 38.87 3.9 Cash flow from operating activities 263 342 (23.1) Free cash flow* 11 93 (88.2) Return on invested capital* 18.4% 17.8% Weighted average number of shares ('000) 7 489 7 485 Average FTE1 95 889 92 143 4.1 1. Full Time Equivalent (FTE) employees. 2. Constant currency (CCY)*. * Alternative Performance Measures (APM), refer to the ‘2022 Half Year APM’ document. 1 2022 Half Year Results SGS | 2022 Half Year Results
  • 4. A strong operational performance despite challenging market conditions “We achieved strong growth reflecting the resilience of our global network. All divisions and regions contributed to this performance despite the challenging market conditions faced during H1. These include the impact of the war in Ukraine, continued supply chain disruption, rising global inflation, and Covid-related absenteeism and restrictions in China. China, our largest affiliate, resumed its strong growth trajectory in June. “Through the investment and acquisitions we are making in our focus areas, and the commitment of our colleagues, SGS is becoming an even more resilient, sustainable and data-driven company delivering on our strategic objectives.” Frankie Ng, CEO of SGS Enabling a better, safer and more interconnected world Growth in sustainable solutions combined with our corporate sustainability performance, supports our purpose of enabling a better, safer and more interconnected world for all our stakeholders. • We are developing new and innovative sustainability solutions in all divisions and geographies across the portfolio including sustainability assurance, greenhouse gas emissions verification, green buildings and zero waste certification, recycled content testing and environmental claim management. • A number of corporate sustainability achievements in H1 includes: aligning our targets to the Science Based Targets initiative (SBTi) of 1.5 degrees and net zero pathway; launching our updated human rights policy; strengthening our vehicle emissions policy and prioritizing energy efficient building investments, two major sources of our carbon emissions; and establishing a dedicated sustainability committee of the Board. Delivering on our strategy We continue to invest in our strategic priority areas including our platform for growth. • Revenue under our Sustainability Solutions Framework increased from 45% in 2020 to 47% in 2021, moving towards our target of 50% in 2023. This reflects our commitment to make our company and supply chain more sustainable, and to support our customers on their sustainability journeys. • Continued capex investment in our strategic priority areas. For example, wireless laboratories accounted for over one fifth of our large growth capex projects in H1 and we are on track to open three new cybersecurity laboratories in 2022 and one in Q1 2023, to help meet the strong demand. • 9% of revenue has been migrated to next generation digital platforms, services and solutions, supporting our target of 20% by 2023: –  We continue to strengthen our platform for growth through our investment in ‘Level Up’ finance, IT and operational initiatives. For example, over 50% of geochemistry samples in Natural Resources are now processed through our latest generation of digital labs, and we are targeting 80% by Q1 2023. –  In Health Nutrition, over 75% of our drug development sites are live with our new centralized electronic quality, document and training management system. –  The launch of Knowledge’s new digital CertIQ application platform, which digitalizes the entire certification process and reporting from customer contact through certificate issuance, is a significant enhancement in the digitalization of our customer journey. • Organic* growth was strong in Softlines, Food, Industrial Public Health Safety, mineral-related activities and Knowledge, especially Consulting. • We completed three acquisitions, all aligned to our focus megatrends and acquired the remaining 49% of Digicomply, our AI end-to-end digital regulatory compliance platform. The integration of SGS Analytics continues to progress well and the acquisition of proderm GmbH, completed on 8 July 2022, further accelerates our ambition to become the clear Cosmetics Hygiene market leader. Our people are our paramount priority • We have prioritized the safety, security and well-being of all our colleagues impacted by the war in Ukraine. At the same time, we have suspended business development and investment activities and reduced our portfolio of services in Russia. • Support has been provided to our colleagues impacted by the Covid-related restrictions in China. A strong financial performance Total revenue reached CHF 3.3 billion, up 5.2% (6.8% at constant currency*), with strong mid-single digit growth achieved across all divisions. Organic revenue* increased by 5.8%, supported by pricing initiatives to pass on the majority of cost inflation. Operating income decreased from CHF 430 million in prior year to CHF 423 million in 2022, mainly impacted by Covid-related restrictions in China which are now lifted. Adjusted operating income* slightly increased from CHF 457 million in prior year to CHF 458 million in 2022, an increase of 0.2% (1.6% at constant currency*). Excluding China, adjusted operating income* growth was double digit. Adjusted operating income margin* decreased from 14.8% in prior year (also 14.8% at constant currency*) to 14.1% in 2022, solely driven by the temporary Covid-related lockdown restrictions in China, most notably in Shanghai. Net financial expenses slightly decreased from CHF 23 million in prior year to CHF 20 million in 2022. Effective tax rate (ETR) decreased from 29% in prior year to 27%, reflecting a normalization of non-deductible expenses. Profit attributable to equity holders increased slightly by 1.5% over prior year, from CHF 272 million to CHF 276 million in 2022. Basic earnings per share increased from CHF 36.29 in prior year to CHF 36.78, an increase of 1.4%. Cash flow from operating activities decreased from CHF 342 million in prior year to CHF 263 million in 2022, mainly due to higher net working capital requirement to support the strong revenue growth. This resulted in a positive operating net working capital* at 1.8% as a percentage of revenue compared to (0.1)% in prior year. Free cash flow (FCF)* decreased from CHF 93 million in prior year to CHF 11 million in 2022 due to the higher net working capital requirement. * Alternative Performance Measures (APM), refer to the ‘2022 Half Year APM’ document. 2022 Half Year Results 2 SGS | 2022 Half Year Results
  • 5. Investment activities: Net capital expenditure increased from CHF 147 million in prior year to CHF 150 million, and the Group completed three acquisitions for a total consideration of CHF 17 million, out of which CHF 11 million was paid in H1 2022. Financing activities: In 2022, the Group paid a dividend of CHF 599 million and initiated a new share buyback program for up to a total of CHF 250 million, out of which CHF 35 million was spent in H1 2022. Return on invested capital (ROIC)* increased from 17.8% in prior year to 18.4% in 2022. As at 30 June 2022, the Group net debt* increased from CHF 1 691 million in December 2021 to CHF 2 363 million, mainly due to dividend payment. Business growth and adjusted operating income margin H1 2022 (CHF million) Revenue Growth at CCY1 Organic* growth at CCY1 Adjusted operating income* Adjusted operating income margin* Connectivity Products 642 4.2% 3.1% 149 23.2% Health Nutrition 442 8.9% 5.2% 55 12.4% Industries Environment 1 070 6.0% 5.6% 92 8.6% Natural Resources 766 8.3% 7.6% 98 12.8% Knowledge 335 8.4% 8.4% 64 19.1% Total 3 255 6.8% 5.8% 458 14.1% Acquisitions Date Location Division FTE Gas Analysis Services 28 February 2022 Ireland Industries Environment 36 Ecotecnos 6 May 2022 Chile Industries Environment 27 AIEX 9 May 2022 France Industries Environment 24 We are on track for our mid-term 2020-2023 targets People Planet Performance Ensuring diversity Nurture diversity and inclusion based on merit by ensuring equal opportunity to all employees and evolving our gender diversity to 30% women in leadership at CEO-3 positions and above Reducing our CO2 emissions Support the transition to a low-carbon world by meeting our Science-based Target of reducing our CO2 emissions per revenue by 35%² High-single digit constant currency revenue Compound Annual Growth Rate (CAGR) Driven by mid-single digit organic* growth per annum and a focus on MA World Class Service (WCS) Promote a culture of operational safety, efficiency and excellence through our WCS program: 20% of our WCS labs (2020 perimeter) reaching WCS Bronze award level Sustainability Solutions Support our customers on their journey to sustainability by increasing the proportion of revenue generated by our sustainability solutions to above 50% 10% adjusted operating income* CAGR Supporting personal development Support the personal development of our employees by increasing the completion rate of job-related training by 10%³ Integrity principles Reduce the impact that our supply chain has on society by committing our strategic suppliers to support our integrity principles Strong Economic Value Added discipline (EVA) Positive impact on communities Increase by 10%³ our positive impact on our communities through employee volunteering, focusing on vulnerable groups including those affected by pandemics Energy efficiency Increasing annually the number of energy efficiency measures in our 100 most energy intensive owned buildings Maintain or grow the dividend per share 1. Constant currency (CCY)*. 2. Against a 2014 baseline. 3. Against a 2019 baseline. * Alternative Performance Measures (APM), refer to the ‘2022 Half Year APM’ document. 3 2022 Half Year Results SGS | 2022 Half Year Results
  • 6. * Alternative Performance Measures (APM), refer to the ‘2022 Half Year APM’ document. Outlook 2022 • Mid-single digit organic growth • Improving adjusted operating income* with margin* at a similar level to prior year • Strong cash conversion • Maintain best-in-class organic return on invested capital* • Accelerate investment into our strategic focus areas with MA as a key differentiator • At least maintain the dividend and utilize our new share buyback program on an opportunistic basis as part of our flexible capital allocation strategy Subsequent events On 5 July 2022, the Group announced the acquisition of Silver State Analytical Laboratories, Inc. and its sister company Excelchem Laboratories, Inc. in the United States. They provide quality analytical and microbiological testing (certified and independent) and support services for clients in the environmental, water, utility, engineering, construction, food processing, chemical, mining, healthcare, resort and hospitality industries. On 8 July 2022, the Group announced the acquisition of proderm GmbH in Germany, a leading provider of advanced clinical testing solutions for cosmetics, personal care and medical products. Board changes On 29 March 2022, Phyllis Cheung was elected as a member of the Board of Directors bringing 30 years of experience in the consumer industry. In her most recent role as CEO of McDonald’s China, Ms. Cheung successfully doubled the number of restaurants in China and led the company’s digital transformation to elevate the customer dining experience through omni-channel digital platforms. Significant shareholders As at 30 June 2022, Groupe Bruxelles Lambert (acting through Serena SARL and URDAC) held 19.11% (December 2021: 19.11%) and BlackRock Inc. held 5.02% (December 2021: below 5%) of the share capital and voting rights of the company. At the same date, the Group held 0.38% of the share capital of the company (December 2021: 0.04%). Calvin Grieder Chair of the Board of Directors Frankie Ng Chief Executive Officer 19 July 2022 2022 Half Year Results 4 SGS | 2022 Half Year Results
  • 7. (CHF million) June 2022 June 2021 Change in % June 2021 CCY1 Change in CCY1 % Revenue 642 618 3.9 616 4.2 Adjusted operating income* 149 142 4.9 141 5.7 Margin %* 23.2 23.0 22.9 Connectivity Products revenue grew by 4.2% at constant currency (organic growth was 3.1%) to CHF 642 million despite the impact of Covid-related restrictions in China. Connectivity organic growth was above the divisional average across all segments. Strong double-digit organic growth in Q1, supported by our investments in high technology segments and product safety, was partially offset by Covid-related restrictions on restricted substances testing and field services in China. Brightsight positively contributed to performance. Softlines grew organically well above the divisional average as the market continued its recovery. Disruption in China was minimized through effective domestic sample management, while Turkey, India and Bangladesh all gained market share. Hardlines declined organically, impacted by supply chain disruption in Hardgoods with particularly challenging market conditions in automotive. Trade Facilitation Services reported solid organic growth driven by the expansion of eCustoms services in Europe. The strong performance was achieved notwithstanding the challenging market conditions. The adjusted operating income margin increased to 23.2% from 22.9% in prior year (at constant currency), driven by collections in Trade Facilitation Services, an improvement in profitability in cybersecurity and strong performance from key affiliates such as Turkey, India and Bangladesh. This more than offset the continued long-term investment in our network and the impact of Covid-related restrictions in China. (CHF million) June 2022 June 2021 Change in % June 2021 CCY1 Change in CCY1 % Revenue 442 414 6.8 406 8.9 Adjusted operating income* 55 64 (14.1) 63 (12.7) Margin %* 12.4 15.5 15.5 Health Nutrition revenue grew by 8.9% at constant currency (organic growth was 5.2%) to CHF 442 million supported by growth across all geographies and recent acquisitions. Strong growth was achieved despite the remaining pandemic restrictions and a reduction in COVID-19 vaccine-related activities. Food grew organically above the divisional average supported by growth across the network. Crop Science performance was impacted by the slowdown in environmental impact studies on plant protection products in Europe and lower seed testing volumes. Health Science grew organically below the divisional average impacted by a significant reduction in Covid vaccine-related testing; much of this volume has already been replaced and these projects are starting to ramp up. Excluding this impact, growth was strong, notably Clinical Research, while our recent acquisitions added to reported growth. Cosmetics Hygiene grew broadly in line with the divisional organic average, supported by growing clinical and panel activity, while reported growth was complemented by the acquisition of IDEA. The adjusted operating income margin decreased to 12.4% from 15.5% in prior year (at constant currency) affected by the end of Covid vaccine-related testing, disruption in China in Q2 and continued investment in our global lab network. Connectivity Products Health Nutrition 1. Constant currency (CCY) – Definition in APM. * Alternative Performance Measures (APM), refer to the ‘2022 Half Year APM’ document. 5 2022 Half Year Results SGS | 2022 Half Year Results
  • 8. (CHF million) June 2022 June 2021 Change in % June 2021 CCY1 Change in CCY1 % Revenue 1 070 1 033 3.6 1 009 6.0 Adjusted operating income* 92 99 (7.1) 97 (5.2) Margin %* 8.6 9.6 9.6 Industries Environment revenue increased by 6.0% at constant currency (organic growth was 5.6%) to CHF 1 070 million. A strong increase in demand for environmental field services offset lower volumes of non-destructive testing and supply chain services in Field Services and Inspection. Technical Assessment Advisory delivered double-digit organic growth, continuing to benefit from the increase in supervision and consulting work in Latin America and a very strong overall performance in Eastern Europe and in the Middle East. Industrial and Public Health Safety grew organically above the divisional average. This included good performances in both health safety services in Western European countries and material testing in North America, as well as strong volumes in Asia. Environmental Testing grew below the divisional organic level with double-digit growth in the USA and Latin America partially offset by lower volumes in some other regions. Public Mandates revenue declined due to lost contracts in Africa, partly compensated by price increases in Latin American vehicle compliance services. Specialty Services organic growth was above the divisional average benefiting from a resumption of upstream services. The adjusted operating income margin decreased to 8.6% from 9.6% in prior year (at constant currency) mainly due to Covid-related restrictions in China, the ramp up of new contracts, mix and collection delays from certain governments and related projects. This was partially offset by the positive performance in our recent acquisition in Technical Assessment Advisory and the cost synergies achieved from the integration of SGS Analytics. (CHF million) June 2022 June 2021 Change in % June 2021 CCY1 Change in CCY1 % Revenue 766 716 7.0 707 8.3 Adjusted operating income* 98 90 8.9 89 10.1 Margin %* 12.8 12.6 12.6 Natural Resources revenue grew by 8.3% at constant currency (organic growth was 7.6%) to CHF 766 million driven by continued momentum in the mining industry and a recovery in oil and gas in certain regions. Trade Inspection grew below the divisional organic level. High-single digit growth in Minerals Commodities and solid growth in Oil and Gas Commodities was offset by Agricultural Commodities, the result of volatile meteorological conditions in key markets and trade restrictions. Laboratory Testing grew in double digits organically. Across the network, Geochemistry volumes are being driven by continued strength in mineral exploration while we have extended our leadership position in onsite laboratories by winning new laboratory contracts in Latin America, South East Asia Pacific and Africa. High-single digit organic growth in oil and gas analytical services was supported by outsourcing in Europe, North America, Central Asia and the acquisition of Sulphur Experts Inc. added to total growth. Metallurgy Consulting also delivered double-digit organic growth driven by service expansion and project wins in North and Latin America. Market Intelligence grew above the divisional organic average benefiting from the continued rollout of digital services across the supply chain. The adjusted operating income margin increased to 12.8% from 12.6% in prior year (at constant currency) supported by the strong growth in minerals and oil and gas testing activities. Industries Environment Natural Resources 1. Constant currency (CCY) – Definition in APM. * Alternative Performance Measures (APM), refer to the ‘2022 Half Year APM’ document. Acquisitions • Gas Analysis Services • Ecotecnos • AIEX 2022 Half Year Results 6 SGS | 2022 Half Year Results
  • 9. (CHF million) June 2022 June 2021 Change in % June 2021 CCY1 Change in CCY1 % Revenue 335 313 7.0 309 8.4 Adjusted operating income* 64 62 3.2 61 4.9 Margin %* 19.1 19.8 19.7 Knowledge revenue grew by 8.4% at constant currency and organically to CHF 335 million with growth across all strategic business units and in all geographies. Management System Certification grew in all geographies organically, but below the divisional average. The lower growth reflects a challenging comparable period as 2021 was a re-certification year. Food certification delivered strong growth across all regions while medical devices and security services reported double-digit growth. Customized Audits grew organically below the divisional average. Second party audit work was impacted by restrictions in China. This was compensated by double-digit growth from Responsible Business Services across all regions and ESG services. Consulting grew at a materially higher rate than the divisional organic average. This was primarily driven by the very strong performance of Maine Pointe, benefiting from strong demand for supply chain optimization and performance improvement services. Academy organic growth was below the divisional average. A good performance in Africa, Western Europe and Asia excluding China. The adjusted operating income margin decreased to 19.1% from 19.7% in prior year (at constant currency) impacted by the change in geographical and service mix. Knowledge 1. Constant currency (CCY) – Definition in APM. * Alternative Performance Measures (APM), refer to the ‘2022 Half Year APM’ document. 7 2022 Half Year Results SGS | 2022 Half Year Results
  • 10. Interim condensed consolidated financial statements Condensed consolidated income statement For the period ended 30 June 2022 (CHF million) Notes June 2022 June 2021 Revenue 4 3 255 3 094 Salaries and wages (1 665) (1 576) Subcontractors’ expenses (193) (187) Depreciation, amortization and impairment (255) (248) Other operating expenses (719) (653) Operating income (EBIT) 4 423 430 Financial income 9 6 Financial expenses (29) (29) Share of profit of associates and joint ventures 1 1 Profit before taxes 404 408 Taxes 6 (110) (118) Profit for the period 294 290 Profit attributable to: Equity holders of SGS SA 276 272 Non-controlling interests 18 18 Basic earnings per share (in CHF) 7 36.78 36.29 Diluted earnings per share (in CHF) 7 36.71 36.27 Condensed consolidated statement of comprehensive income For the period ended 30 June 2022 (CHF million) Notes June 2022 June 2021 Actuarial (losses)/gains on defined benefit plans 13 (22) 39 Income tax on actuarial (losses)/gains 5 (3) Items that will not be subsequently reclassified to income statement (17) 36 Exchange differences (20) 68 Items that may be subsequently reclassified to income statement (20) 68 Other comprehensive income/(loss) for the period (37) 104 Profit for the period 294 290 Total comprehensive income for the period 257 394 Attributable to: Equity holders of SGS SA 240 373 Non-controlling interests 17 21 2022 Half Year Results 8 SGS | 2022 Half Year Results
  • 11. Condensed consolidated balance sheet For the period ended 30 June 2022 (CHF million) Notes June 2022 December 2021 Assets Non-current assets Property, plant and equipment 930 925 Right-of-use assets 610 605 Goodwill 8 1 761 1 778 Other intangible assets 357 382 Investments in joint ventures, associates and other companies 27 26 Deferred tax assets 183 164 Other non-current assets 147 173 Total non-current assets 4 015 4 053 Current assets Inventories 60 59 Unbilled revenues and work in progress 242 175 Trade receivables 975 928 Other receivables and prepayments 278 204 Current tax assets 107 108 Cash and cash equivalents 1 118 1 480 Total current assets 2 780 2 954 Total assets 6 795 7 007 Equity and liabilities Capital and reserves Share capital 7 7 Reserves 757 1 118 Treasury shares (64) (8) Equity attributable to equity holders of SGS SA 700 1 117 Non-controlling interests 99 85 Total equity 799 1 202 Non-current liabilities Loans and other financial liabilities 12 2 522 2 889 Lease liabilities 479 481 Deferred tax liabilities 82 92 Defined benefit obligations 74 84 Provisions 91 90 Total non-current liabilities 3 248 3 636 Current liabilities Trade and other payables 646 687 Contract liabilities 229 221 Current tax liabilities 162 169 Loans and other financial liabilities 12 959 282 Lease liabilities 162 155 Provisions 61 60 Other creditors and accruals 529 595 Total current liabilities 2 748 2 169 Total liabilities 5 996 5 805 Total equity and liabilities 6 795 7 007 9 2022 Half Year Results SGS | 2022 Half Year Results
  • 12. Condensed consolidated statement of changes in equity For the period ended 30 June 2022 Attributable to: (CHF million) Share capital Treasury shares Capital reserve Cumulative translation adjustments Cumulative (losses)/gains on defined benefit plans net of tax Retained earnings and Group reserves Equity holders of SGS SA Non- controlling interests Total equity Balance at 1 January 2021 8 (230) 160 (1 307) (241) 2 670 1 060 74 1 134 Profit for the period – – – – – 272 272 18 290 Other comprehensive income for the period – – – 65 36 – 101 3 104 Total comprehensive income for the period – – – 65 36 272 373 21 394 Dividends paid – – – – – (599) (599) (4) (603) Share-based payments – – 8 – – – 8 – 8 Movement in non-controlling interests – – – – – 18 18 4 22 Movement on treasury shares – 53 (42) – – (10) 1 – 1 Balance at 30 June 2021 8 (177) 126 (1 242) (205) 2 351 861 95 956 Balance at 1 January 2022 7 (8) 130 (1 342) (190) 2 520 1 117 85 1 202 Profit for the period – – – – – 276 276 18 294 Other comprehensive income for the period – – – (19) (17) – (36) (1) (37) Total comprehensive income for the period – – – (19) (17) 276 240 17 257 Dividends paid – – – – – (599) (599) (3) (602) Share-based payments – – 9 – – – 9 – 9 Movement in non-controlling interests – – – – – (6) (6) – (6) Movement on treasury shares – (56) (4) – – (1) (61) – (61) Balance at 30 June 2022 7 (64) 135 (1 361) (207) 2 190 700 99 799 2022 Half Year Results 10 SGS | 2022 Half Year Results
  • 13. Condensed consolidated cash flow statement For the period ended 30 June 2022 (CHF million) Notes June 2022 June 2021 Profit for the period 294 290 Non-cash and non-operating items 405 404 (Increase) in working capital (299) (202) Taxes paid (137) (150) Cash flow from operating activities 263 342 Purchase of property, plant and equipment and other intangible assets (156) (150) Disposal of property, plant and equipment and other intangible assets 6 3 Acquisition of businesses 9 (11) (103) Cash paid on other non-current assets – (1) Proceeds received from investments in joint ventures, associates and other companies – 2 Interest received 8 7 Proceeds from marketable securities – 1 Cash flow used by investing activities (153) (241) Dividends paid to equity holders of SGS SA (599) (599) Dividends paid to non-controlling interests (3) (4) Transaction with non-controlling interests (9) (11) Cash paid on treasury shares (51) – Proceeds from corporate bonds – 817 Payment of corporate bonds (250) (276) Interest paid (32) (38) Payment of lease liabilities (92) (91) Proceeds from borrowings 592 44 Payment of borrowings – (553) Cash flow used by financing activities (444) (711) Currency translation (28) 13 (Decrease) in cash and cash equivalents (362) (597) Cash and cash equivalents at beginning of year 1 480 1 766 (Decrease) in cash and cash equivalents (362) (597) Cash and cash equivalents at end of the period 1 118 1 169 11 2022 Half Year Results SGS | 2022 Half Year Results
  • 14. 1. Activities of the Group SGS SA and its subsidiaries (the “Group”) operate around the world under the name SGS. The head office of the Group is located in Geneva, Switzerland. SGS is the global leader in testing, inspection and certification (TIC) services supporting international trade in agriculture, minerals, petroleum and consumer products. It also provides these services to governments, international institutions and customers engaged in the industrial, environmental and life sciences sectors. 2. Basis of preparation and significant events Basis of preparation These unaudited interim condensed consolidated financial statements have been prepared in accordance with International Accounting Standard 34 Interim Financial Reporting and should be read in conjunction with the consolidated financial statements of the Group for the year-end 31 December 2021 that were prepared in compliance with the International Financial Reporting Standards (IFRS). COVID-19 pandemic and geopolitical instability COVID-19 and recent geopolitical events have impacted the economy and financial markets. Many industries are facing challenges, including supply-chain disruption, inflation, deteriorating credit and liquidity concerns. Most notably, the Group’s half-year operational performance was temporarily affected by Covid-related restrictions in China. The Group exposure to Russia and Ukraine is limited. Consequently, these 2022 interim condensed consolidated financial statements were prepared with particular attention to (i) the impairment of non-current assets, (ii) the appropriateness of the allowances for trade receivables, unbilled revenue and work in progress, (iii) the level of provision for risks, as well as (iv) accounting for government grants. No material impacts were recognized in these interim condensed consolidated financial statements. 3. Changes to the Group’s accounting policies The accounting policies used in the preparation and presentation of the interim condensed consolidated financial statements are consistent with those used in the annual consolidated financial statements of the Group. Several new amendments and interpretations were adopted effective 1 January 2022 but have no material impact on the Group’s interim condensed consolidated financial statements. 4. Analysis of operating income (CHF million) June 2022 June 2021 Adjusted operating income* 458 457 Amortization and impairment of acquired intangibles (19) (19) Restructuring costs (10) (1) Transaction and integration costs (6) (7) Operating income 423 430 June 2022 (CHF million) Revenue Adjusted operating income* Amortization of acquisition intangibles Restructuring costs Transaction and integration costs Operating income by business Connectivity Products 642 149 (3) (1) – 145 Health Nutrition 442 55 (5) (1) (2) 47 Industries Environment 1 070 92 (10) (3) (3) 76 Natural Resources 766 98 – (4) (1) 93 Knowledge 335 64 (1) (1) – 62 Total 3 255 458 (19) (10) (6) 423 Notes to the interim condensed consolidated financial statements * Alternative Performance Measures (APM), refer to the ‘2022 Half Year APM’ document. 2022 Half Year Results 12 SGS | 2022 Half Year Results
  • 15. June 2021 (CHF million) Revenue Adjusted operating income* Amortization of acquisition intangibles Restructuring costs Transaction and integration costs Operating income by business Connectivity Products 618 142 (1) – – 141 Health Nutrition 414 64 (2) – (3) 59 Industries Environment 1 033 99 (11) – (4) 84 Natural Resources 716 90 (1) (1) – 88 Knowledge 313 62 (4) – – 58 Total 3 094 457 (19) (1) (7) 430 All segment revenues reported above are from external customers. The adjusted operating income* represents the profit earned by each segment. This is the main measure reported to the chief operating decision makers for the purposes of resource allocation and assessment of segmental performance. 5. Revenue from contracts with customers Group’s revenue from contracts with customers by timing of recognition June 2022 June 2021 (CHF million) Services transferred at a point in time Services transferred over time Services transferred at a point in time Services transferred over time Connectivity Products 85% 15% 86% 14% Health Nutrition 84% 16% 86% 14% Industries Environment 71% 29% 68% 32% Natural Resources 84% 16% 83% 17% Knowledge 90% 10% 97% 3% Total 80% 20% 80% 20% 6. Taxes (CHF million) June 2022 June 2021 Current taxes 136 130 Deferred tax (credit) relating to the origination and reversal of temporary differences (26) (12) Total 110 118 (CHF million) June 2022 June 2021 Profit before taxes 404 408 Tax at statutory rates applicable to the profits earned in the country concerned 76 80 Tax effect of non-deductible or non-taxable items 8 9 Tax effect on losses not currently treated as being recoverable in future years 1 1 Tax effect on losses previously considered irrecoverable, now expected to be recoverable (2) (4) Non-creditable foreign withholding taxes 21 18 Minimum taxes 4 2 Prior period adjustments 1 5 Rate changes – 6 Other 1 1 Tax charge 110 118 * Alternative Performance Measures (APM), refer to the ‘2022 Half Year APM’ document. 13 2022 Half Year Results SGS | 2022 Half Year Results
  • 16. 7. Earnings Per Share June 2022 June 2021 Profit attributable to equity holders of SGS SA (CHF million) 276 272 Weighted average number of shares (‘000) 7 489 7 485 Basic earnings per share (CHF) 36.78 36.29 June 2022 June 2021 Profit attributable to equity holders of SGS SA (CHF million) 276 272 Diluted weighted average number of shares (‘000) 7 504 7 491 Diluted earnings per share (CHF) 36.71 36.27 8. Goodwill (CHF million) June 2022 June 2021 Cost At 1 January 1 778 1 651 Additions 14 79 Consideration / fair value adjustments on prior years’ acquisitions 1 – Exchange differences (32) 44 At end of the period 1 761 1 774 The goodwill arising on acquisitions relates to the value of the underlying business and expected synergies as well as the value of the qualified workforce that do not meet the criteria for recognition as separable intangible assets. None of the goodwill arising on acquisitions completed as at 30 June 2022 is expected to be tax deductible. 9. Acquisitions In H1 2022, the Group completed three acquisitions. • 100% of Gas Analysis Services (GAS), a company specialized in instrumentation and gas analysis testing in Ireland (effective 28 February 2022) • 100% of Ecotecnos, a company providing sea monitoring and oceanography services in Chile (effective 6 May 2022) • 100% of AIEX, a company providing technical and welding inspection services in the nuclear and marine industries in France (effective 9 May 2022) These companies were acquired for a total consideration of CHF 17 million, out of which CHF 11 million was paid in H1, and the total goodwill generated on these transactions amounted to CHF 14 million. All the above transactions contributed a total of CHF 4 million in revenue and CHF 1 million in operating income in H1 2022. Had all acquisitions been effective 1 January 2022, the revenue for the period from these acquisitions would have been CHF 7 million and the operating income would have been CHF 1 million. Date Location Division FTE Gas Analysis Services 28 February 2022 Ireland Industries Environment 36 Ecotecnos 6 May 2022 Chile Industries Environment 27 AIEX 9 May 2022 France Industries Environment 24 In compliance with IFRS 3, fair value on acquisition remains provisional for a 12-month period following the date of acquisition, during which the Group can finalize the purchase price allocation. The Group incurred transaction-related costs of CHF 6 million (2021: CHF 7 million) related to integration costs, external legal fees, due diligence expenses and the costs of maintaining an internal acquisition department. These expenses are reported within other operating expenses in the interim condensed consolidated income statement. 2022 Half Year Results 14 SGS | 2022 Half Year Results
  • 17. 10. Credit risk management Credit risk arises from the possibility that customers may not be able to settle their obligations as agreed. It arises principally from the Group’s commercial activities. Trade receivable, unbilled revenues and work in progress are subject to a policy of active risk management which focuses on the assessment of country risk, credit limits and approval procedures. Due to its large geographic base and number of customers, the Group is not exposed to material concentrations of credit risk on its trade receivables, unbilled revenue and work in progress. As at 30 June 2022, unbilled revenue and work in progress amounted to CHF 242 million (December 2021: CHF 175 million) which is net of an allowance for expected credit losses of CHF 19 million (December 2021: CHF 15 million). Set out below is the information about the credit risk exposure on the Group’s trade receivables using a provision matrix based on aging of trade receivables as of invoice date at 30 June 2022. (CHF million) Expected credit loss range Gross carrying amount Expected credit loss 0 - 90 days 0%-5% 880 4 91 - 120 days 10%-25% 55 10 121 - 180 days 20%-50% 49 16 181 - 240 days 35%-75% 29 14 241 - 300 days 50%-75% 16 11 301 - 360 days 75%-100% 10 9 360 days 100% 106 106 Total 1 145 170 Set out below is the information about the credit risk exposure on the Group’s trade receivables using a provision matrix based on aging of trade receivables as of invoice date at 31 December 2021. (CHF million) Expected credit loss range Gross carrying amount Expected credit loss 0 - 90 days 0%-5% 863 4 91 - 120 days 10%-25% 43 8 121 - 180 days 20%-50% 36 14 181 - 240 days 35%-75% 20 12 241 - 300 days 50%-75% 11 8 301 - 360 days 75%-100% 7 6 360 days 100% 110 110 Total 1 090 162 11. Fair value measurement recognized in the balance sheet There was no transfer between fair value level categories during the period. Derivative assets 2022: CHF 27 million (2021: CHF 11 million) qualify as Level 2 fair value measurement category. Derivative assets consist of foreign currency forward contracts that are measured using quoted forward exchange rates and yield curves derived from quoted interest rates matching maturities of the contract. The corporate bonds qualify as fair value Level 1, which amounts to CHF 2 685 million (2021: CHF 3 166 million). Other financial liabilities include CHF 29 million qualifying as fair value Level 3 (2021: CHF 33 million), which represents the estimated present value of the redemption amount to acquire the remaining non-controlling interests of acquisitions if the put/call option is exercised. Subsequent changes in the valuation of the redemption amount to acquire the remaining non-controlling interests of acquisitions if the put/ call option is exercised shall be recognized directly in equity attributable to owners, including the unwinding of the discount. The remaining other financial liabilities qualify as Level 2, determined in accordance with generally accepted pricing models. 15 2022 Half Year Results SGS | 2022 Half Year Results
  • 18. 12. Loans and other financial liabilities (CHF million) June 2022 December 2021 Bank loans and commercial paper 579 5 Corporate bonds 2 819 3 100 Put option on acquisition 29 33 Other financial liabilities 26 26 Derivatives 28 7 Total 3 481 3 171 Current 959 282 Non-current 2 522 2 889 Liquidity risk management In H1 2022, the Group reimbursed two bonds maturing in February 2022, for a total amount of CHF 250 million. Furthermore, the Group started to issue commercial paper out of its EUR 1 billion Euro Commercial Paper (ECP) program, for an amount of EUR 334 million (CHF 334 million) as at 30 June 2022, as well as withdrew EUR 200 million (CHF 200 million) as at 30 June 2022 from its EUR 1 billion sustainability-linked revolving credit facility. 13. Defined Benefit obligations COVID-19 and recent geopolitical events have had a significant impact on market fluctuations. Discount rates rose since 31 December 2021, while year-to-date equity and bond returns are negative. SGS remeasured the defined benefit plans in Switzerland, the USA, and the UK as at 30 June 2022. The impact on the net pension liability for the first six months of 2022 is an actuarial loss of CHF 22 million. It has been recognized in other comprehensive income and is subject to future volatility. 14. Subsequent events On 5 July 2022, the Group announced the acquisition of Silver State Analytical Laboratories, Inc. and its sister company Excelchem Laboratories, Inc. in the United States. They provide quality analytical and microbiological testing (certified and independent) and support services for clients in the environmental, water, utility, engineering, construction, food processing, chemical, mining, healthcare, resort and hospitality industries. On 8 July 2022, the Group announced the acquisition of 100% of the shares of proderm GmbH, for a purchase price of CHF 45 Mio. Founded in 1994, proderm is a clinical research organization, specialized in advanced solutions for cosmetics and personal care as well as medical clinical studies. This acquisition further supports the Group strategic expansion in cosmetics and hygiene as part of our Health Nutrition division. The financial effects of the above transactions have not been brought to account at 30 June 2022. The operating results and assets and liabilities of the company will be included in our second-half consolidated financial statements. Assets acquired and liabilities assumed Following those two subsequent acquisitions, SGS has started the purchase price allocation (PPA) exercise. Specifically, intangible assets identification and fair valuation are still at a very early stage of the PPA process. At the date of publication of these condensed consolidated financial statements, SGS has thus not completed the initial accounting of the business combinations. 15. Approval of interim condensed consolidated financial statements and subsequent events These interim condensed consolidated financial statements were authorized for issue by the Board of Directors on 18 July 2022. 16. Exchange rates The main currency for the Group were translated at the following exchange rates into Swiss Francs. Statement of financial position period-end rates Income statement period average rates June 2022 December 2021 June 2022 June 2021 Australia AUD 100 65.71 66.59 67.97 70.02 Canada CAD 100 73.95 71.65 74.23 72.79 Chile CLP 100 0.10 0.11 0.11 0.13 China CNY 100 14.26 14.40 14.57 14.03 Eurozone EUR 100 99.70 103.78 103.23 109.43 Korea KRW 100 0.07 0.08 0.08 0.08 United Kingdom GBP 100 115.93 123.57 122.62 126.01 Russia RUB 100 1.84 1.24 1.27 1.22 Taiwan TWD 100 3.21 3.32 3.29 3.24 USA USD 100 95.47 91.72 94.35 90.81 2022 Half Year Results 16 SGS | 2022 Half Year Results
  • 19. Shareholder Information SGS SA corporate office 1 place des Alpes P.O. Box 2152 CH – 1211 Geneva 1 t +41 (0)22 739 91 11 f +41 (0)22 739 98 86 e sgs.investor.relations@sgs.com www.sgs.com Stock exchange listing SIX Swiss Exchange, SGSN Stock exchange trading SIX Swiss Exchange Common stock symbols Bloomberg: Registered Share: SGSN.SW Reuters: Registered Share: SGSN.S Telekurs: Registered Share: SGSN ISIN: Registered Share: CH0002497458 Swiss security number: 249745 Investor Relations Toby Reeks SGS SA 1 place des Alpes P.O. Box 2152 CH – 1211 Geneva 1 t +41 (0)22 739 99 87 m +44 7899 800 575 www.sgs.com Investor days 17-20 November 2022 Istanbul, Turkey 2023 full year results Thursday, 26 January 2023 Annual General Meeting of Shareholders Tuesday, 28 March 2023 Geneva Switzerland Media relations Magali Dauwalder SGS SA 1 place des Alpes P.O. Box 2152 CH – 1211 Geneva 1 t +41 (0)22 739 95 51 m +41 (0)79 329 46 70 www.sgs.com Disclaimer This material is provided for information purposes only and is not intended to confer any legal rights to you. This document does not constitute an invitation to invest in SGS shares. Any decisions you make in reliance on this information are solely your responsibility. This document is given as of the dates specified, is not updated and any forward- looking statements are made subject to the following reservations: This document contains certain forward- looking statements that are neither historical facts nor guarantees of future performance. Because these statements involve risks and uncertainties that are beyond control or estimation of SGS, there are important factors that could cause actual results to differ materially from those expressed or implied by these forward-looking statements. These statements speak only as of the date of this document. Except as required by any applicable law or regulation, SGS expressly disclaims any obligation to release publicly any updates or revisions to any forward-looking statements contained herein to reflect any change in SGS Group’s expectations with regard thereto or any change in events or conditions on which any such statements are based.
  • 20. © SGS SA – 2022 – All Rights Reserved. SGS is a registered trademark of SGS Société Générale de Surveillance SA.