Intra lase's international expansion a growing global presence
•
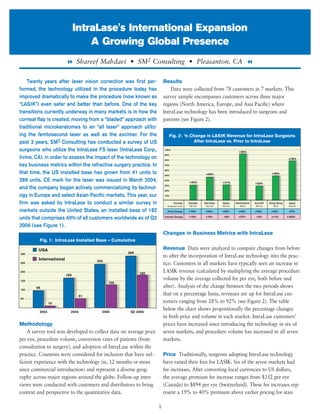
0 recomendaciones•348 vistas

IntraLase has expanded internationally with 182 laser systems installed outside the US as of mid-2006, comprising 40% of their total installed base. A survey of 78 IntraLase customers in 7 countries found that revenues increased 28-92% after adopting IntraLase, with price increases in 6 countries and volume increases in all 7. Adoption rates within practices varied by country from 55% in Spain to over 95% in Asia/Pacific markets. Each country profile provided details on the LASIK market, number of IntraLase placements, and impact of IntraLase on prices, volumes, revenues and adoption rates.

Recomendados
Recomendados
Más contenido relacionado
Similar a Intra lase's international expansion a growing global presence
Similar a Intra lase's international expansion a growing global presence (7)
Más de SM2 Strategic
Más de SM2 Strategic (20)
Último
Último (20)
Intra lase's international expansion a growing global presence
- 1. IntraLase's International Expansion A Growing Global Presence 8 Shareef Mahdavi • SM2 Consulting • Pleasanton, CA 7 Twenty years after laser vision correction was first per- Results formed, the technology utilized in the procedure today has Data were collected from 78 customers in 7 markets. This improved dramatically to make the procedure (now known as survey sample encompasses customers across three major “LASIK”) even safer and better than before. One of the key regions (North America, Europe, and Asia Pacific) where transitions currently underway in many markets is in how the IntraLase technology has been introduced to surgeons and corneal flap is created, moving from a “bladed” approach with patients (see Figure 2). traditional microkeratomes to an “all laser” approach utiliz- ing the femtosecond laser as well as the excimer. For the Fig. 2: % Change in LASIK Revenue for IntraLase Surgeons past 3 years, SM2 Consulting has conducted a survey of US After IntraLase vs. Prior to IntraLase surgeons who utilize the IntraLase FS laser (IntraLase Corp., 100% +92% Irvine, CA), in order to assess the impact of the technology on 90% 80% +78% key business metrics within the refractive surgery practice. In 70% that time, the US installed base has grown from 41 units to 60% +46% +49% 50% 289 units. CE mark for the laser was issued in March 2004, 40% +30% +31% +28% and the company began actively commercializing its technol- 30% 20% ogy in Europe and select Asian Pacific markets. This year, our 10% firm was asked by IntraLase to conduct a similar survey in Country IntraLase Units Canada N=13 Germany N=13 Spain N=19 Switzerland N=4 Aus/NZ N=10 Hong Kong N=7 Japan N=12 markets outside the United States, an installed base of 182 Price Change +19% +23% +23% +40% +25% +33% -37% units that comprises 40% of all customers worldwide as of Q2 Volume Change +10% +19% +6% +37% +2% +11% +182% 2006 (see Figure 1). Changes in Business Metrics with IntraLase Fig. 1: IntraLase Installed Base – Cumulative USA Revenue Data were analyzed to compare changes from before 289 300 to after the incorporation of IntraLase technology into the prac- International 243 250 tice. Customers in all markets have typically seen an increase in 200 182 LASIK revenue (calculated by multiplying the average procedure 166 150 volume by the average collected fee per eye, both before and 128 96 after). Analysis of the change between the two periods shows 100 51 that on a percentage basis, revenues are up for IntraLase cus- 50 10 tomers ranging from 28% to 92% (see Figure 2). The table 2003 2004 2005 Q2 2006 below the chart shows proportionally the percentage changes in both price and volume in each market. IntraLase customers’ Methodology prices have increased since introducing the technology in six of A survey tool was developed to collect data on average price seven markets, and procedure volume has increased in all seven per eye, procedure volume, conversion rates of patients (from markets. consultation to surgery), and adoption of IntraLase within the practice. Countries were considered for inclusion that have suf- Price Traditionally, surgeons adopting IntraLase technology ficient experience with the technology (ie, 12 months or more have raised their fees for LASIK. Six of the seven markets had since commercial introduction) and represent a diverse geog- fee increases. After converting local currencies to US dollars, raphy across major regions around the globe. Follow-up inter- the average premium fee increase ranges from $352 per eye views were conducted with customers and distributors to bring (Canada) to $894 per eye (Switzerland). These fee increases rep- context and perspective to the quantitative data. resent a 19% to 40% premium above earlier pricing for stan- 1
- 2. dard LASIK. By comparison, US surgeons showed an increase of (Germany) to 14% (Australia/New Zealand). Spain, with a pre- $394 per eye (24% higher than non-IntraLase fees) in the most existing conversion of 98%, had little room for improvement. recent survey in 2005. Japan, by contrast, saw fee decreases averaging $575 (37%) in its market. Japan’s market dynamics Adoption In the Asia/Pacific markets, IntraLase is used by are extremely different than those of other major markets and its customers nearly exclusively (95% to 99%). IntraLase is are explained more fully in a later section. A summary of LASIK used for the vast majority of cases by IntraLase customers in prices in each market is shown in Figure 3. Switzerland (86%), Canada (84%), and Germany (72%). The anomaly here is Spain at 55% of cases, which will be discussed Fig. 3: LASIK Pricing per Eye further below. See Figure 5. Before and After IntraLase (US Dollars) Premium Fig. 5: Adoption of IntraLase within the Practice Fees Weighted Average: % of LASIK performed with IntraLase $1,842 Can $2,194 +$352 99% 100% 96% 95% $2,583 Germany $3,177 +$594 84% 86% 80% 72% $1,157 Hong Kong $1,543 +$386 60% 55% $1,976 Aus/ N Z $2,470 +$494 40% $1,503 Spain $1,851 +$349 20% $2,234 Switzerland $3,128 +$894 Canada Germany Spain Switzerland Aus/NZ Hong Kong Japan $1,050 Japan $1,625 -$575 Market-by-Market Summary $1,000 $1,500 $2,000 $2,500 $3,000 $3,500 Procedure Volume The change in the average number of Canada – “Premium total LASIK procedures performed each month ranges from a Market Recovery” CANADA modest 2– 6% (two markets) to a moderate 11 – 37% (four With the excimer Population: 32 Million markets) to an extreme 182% increase in Japan. Other tech- laser available commer- Number of Laser Centers: 69 nologies, such as customized wavefront, have been in place in cially in 1990, Canada Number of IntraLase Placements: 13 these markets and does not account for the differences seen in is the world’s most 2006 # of LASIK eyes (est): 90,000 this survey. In the case of Japan, it appears that procedure pric- experienced market with 2006 # of IntraLase eyes (est): 20,000 ing has had a highly significant impact on procedure volume. laser vision correction. Volume changes are summarized in Figure 4. Peaking with over 120 centers in the late 1990s, the impact of negative media attention and discount pricing led to a “shake- Fig. 4: Average Total LASIK Procedures (Eyes) per Month out” that has settled currently at 69 excimer laser centers. Before and After IntraLase IntraLase technology, which was introduced commercially in MARKET BEFORE AFTER INCREASE % INCREASE 2005, has experienced the most rapid adoption of any technol- ogy for laser vision correction, with installations in 13 centers Canada 152 168 16 11% Germany 85 101 16 19% during the past 18 months. Surgeons report that the technology Spain 110 117 7 6% appeals to those who were ready for LASIK as well as expand- Switzerland 73 100 27 37% Aus/NZ 130 133 3 2% ing interest in the population by touting an “increased margin Hong Kong 61 68 7 11% of safety” message analogous to the advent of airbags and ABS Japan 135 381 246 182% braking systems for automobiles. Such comparisons are easily communicated and understood, Conversion Rates to Surgery Data on the movement of allowing large and small volume centers to increase prices, with patients from the consultation to surgery were available for five 7 of 13 centers prices now $CDN 400 – 700 higher per eye. of the seven markets (not reliably tracked in Japan or Hong Additionally, surgeons report that multiple IntraLase users in Kong). Improved conversion rates were seen ranging from 3% the same market has been beneficial to conversion and volume. 2
- 3. In 2006, it is likely that 20,000 of the 90,000 LASIK proce- However, the increases in price, volume and revenue are dures will be performed with IntraLase, a share that is rapidly consistent with other markets, and IntraLase surgeons are not moving towards a national tipping point where the top 30 reporting loss of patients to other providers. With greater expe- centers will eventually use IntraLase to initiate the majority of rience, it is reasonable to expect that adoption by Spanish sur- procedures performed in the market. geons within their practices will more closely mirror that seen in other markets. It simply will take longer to achieve. Adoption Germany – will also be impacted by increased availability of the technol- “Market Validation” GERMANY ogy; more installed base leads to more awareness among both As with Canada, Population: 82 Million surgeons and patients. Germany is often the Number of Laser Centers: 200 first market entry point Number of IntraLase Placements: 13 Switzerland – for new ophthalmic 2006 # of LASIK eyes (est): 90,000 “No Compromise” SWITZERLAND technology. IntraLase’s 2006 # of IntraLase eyes (est): 11,500 Swiss consumers, Population: 7 Million success has resulted in unlike their German Number of Laser Centers: 20 large part because introduction came after FDA approval and counterparts, have not Number of IntraLase Placements: 4 validation by surgeons in the United States, a unique feature of been enticed for dis- 2006 # of LASIK eyes (est): 6,000 the product which is valued by the primarily higher volume sur- count surgery offered 2006 # of IntraLase eyes (est): 4,200 geons who have adopted IntraLase. Demand for LASIK is down abroad. Swiss patients from a peak of 120,000 eyes per year, and IntraLase surgeons want surgery from Swiss surgeons. Although small in size at are striving to rebuild with a new message for consumers. With 6000 procedures per year, the market is now dominated by four the new IEK application for corneal transplant surgery, German centers that each use IntraLase technology, accounting for 7 universities are adding the IntraLase platform, serving as further of every 10 procedures done in the country. Price increases for validation of the technology for the next wave of private prac- IntraLase are the highest seen globally; the success in achieving tice surgeons. IntraLase’s success is noteworthy in the face of the majority position was helped in part by live surgery per- three domestic German manufacturers and one Swiss entity that formed in primetime on Swiss television. have or plan to launch competing femtosecond laser platforms. Australia & Spain – “Culturally New Zealand – AUSTRALIA/NZ Influenced” SPAIN “Turning the Tide” Population: 24 Million Consumer demand Population: 40 Million The first IntraLase Number of Laser Centers: 24 and acceptance for Number of Laser Centers: 220 customer placement Number of IntraLase Placements: 10 LASIK is among the Number of IntraLase Placements: 19 (late 2004) in Australia 2006 # of LASIK eyes (est): 28,000 highest seen in Europe 2006 # of LASIK eyes (est): 180,000 was already a “pre- 2006 # of IntraLase eyes (est): 15,000 with 180,000 LASIK 2006 # of IntraLase eyes (est): 15,000 mium” priced center procedures in 220 and increased their fees to $3,250 per eye, more than double centers predicted for 2006. Surgeon influence on medical deci- the average price in the market at that time. Under heavy bar- sions transcends the impact of any advertising or promotion for rage of negative advertising from the centers doing traditional LASIK. Citizens with private insurance have benefitted from bladed LASIK, this first customer saw a slight increase in vol- pre-negotiated rates by major carriers, which only now are ume for calendar 2005 over the prior year. Since that time, there beginning to include an optional fee for IntraLase. These car- is now system wide acceptance as 10 of the 25 centers now use riers are a prime source of patient referrals, and surgeons are IntraLase nearly exclusively (95% or more of cases) and account hesitant to make any changes to a system that already turns for the majority of LASIK procedures (15,000/28,000 or 54%). high conversion rates into a large volume of LASIK procedures Surgeons report that patients are more engaged, optometrists nationally. This built-in resistance has delayed IntraLase technol- now have a reason to offer patients as to why fees are what ogy from becoming part of the standard surgeon-patient conver- they are, and staff members find it easier to convert interest into sation for fear of losing patients, which helps make sense of the procedures. The Australian and New Zealand markets should lower adoption rate. experience continued steady growth over the next few years. 3
- 4. Hong Kong – offered by IntraLase, procedure volume has nearly tripled for “Hyper Competitive” HONG KONG these centers. 12 of the 40 centers in Japan use IntraLase, use it As in much of Population: 7 Million exclusively, and account for over half of the 80,000 procedures Asia, the competition Number of Laser Centers: 11 that are estimated to be performed in 2006. Executives and in Hong Kong for the Number of IntraLase Placements: 7 surgeons attribute their market expansion to IntraLase and its discretionary consumer 2006 # of LASIK eyes (est): 10,000 ability to standardize technique as well as results. The greater dollar is fierce. The 2006 # of IntraLase eyes (est): 6,000 consistency they are achieving across all surgeon outcomes have LASIK market was enabled them to create a higher volume approach to surgery, estimated to be at 25,000 eyes per year before literally crashing strongly appealing to a younger “wireless” consumer. The recent in 2002 due to negative publicity (similar to what happened success with LASIK is understood in a country where the para- in Taiwan, when poor surgical results became headline news). digm for market-building is often accomplished via lowering Today’s market is just over one-third the size, as 10,000 LASIK unit costs through aggressive price/volume dynamics. procedures are estimated for 2006. IntraLase technology, after purchased by one hospital, was quickly added by 6 more of Summary and Discussion the 11 centers. The market is characterized by dynamic pricing This survey has shed light on two main issues. First, it and strong promotion (especially of IntraLase). Today, 60% of is clear that the impact of IntraLase technology can be seen all cases in Hong Kong are done with IntraLase, and IntraLase in markets around the globe and is not just a US phenom- customers’ procedure volumes are reportedly growing at 15%, enon. Surgeons universally can add the technology and expect approximately twice the market rate during this recovery period. an improvement in their business to justify the investment. Interest in the technology is seen initially among a nation’s lead- Japan – ing surgeons and then spreads to a core of customers. With the “Market Expansion” JAPAN notable exception of Japan, customers have increased fees and The Japanese market Population: 127 Million seen increases in procedure volumes, often in competitive mar- for laser vision correc- Number of Laser Centers: 40 kets such as Hong Kong or Australia, where procedure volumes tion has not yet mean- Number of IntraLase Placements: 12 were flat to declining. As a group, these markets demonstrate ingfully developed, due 2006 # of LASIK eyes (est): 80,000 that revenue increases are indeed happening for surgeons and to delayed regulatory 2006 # of IntraLase eyes (est): 55,000 that the paths to getting there can be different. approvals, lack of train- Second, there is now emerging evidence that IntraLase ing in the use of traditional microkeratomes, and the ability of technology can help grow the size of the market. In four of the non-ophthalmic surgeons to perform refractive procedures (this seven markets, IntraLase is now used in the majority of LASIK dates back to RK and PRK). Japan has very restrictive guidelines procedures, which may ultimately serve as a tipping point for for patient marketing, which has kept all but a few select and market expansion. This is clearly the case in Japan, which has savvy providers from generating the levels of awareness required not seen meaningful demand for refractive surgery until now. to attract prospective LASIK patients. The net result is that Other markets, such as Canada and Germany, seem to trend demand has been a paltry 40,000 eyes per year (by comparison, more like the US, where share of the technology is increasing Japan’s population is 40% of the US yet has only 3% of the US but has not yet reached majority status. LASIK surgical volume). Cultural and environmental influences are indeed strong and Several providers, highly experienced with elective surgery play a role that can either temper or enhance penetration and centers for aesthetic procedures, have changed the game for adoption of a technology that improves an existing offering in LASIK in Japan. They have added IntraLase to existing centers the market. Notable examples are Spain and Switzerland. and simultaneously dropped prices by a third, using a “blue As IntraLase technology is introduced into other major ocean strategy” to appeal to a younger consumer. By simultane- markets (such as Latin America, the UK and China), we look ously using both price and the advanced “blade free” approach forward to researching and reporting on its impact. References: 3. Blue Ocean Strategy: How to Create Uncontested Market Space and Make 1. A Three Year Perspective on The Business Impact of IntraLase Technology, the Competition Irrelevant, W. Chan Kim and Renee Mauborgne, Harvard SM2 Consulting, August 2005 Business School Press, February 2005 2. IntraLase Q2–2006 Financial Report © Copyright 2006, SM2 Consulting. All rights reserved. 4