SlideShare una empresa de Scribd logo
1 de 19
Descargar para leer sin conexión
A TSIA Member Publication
Outcome-Based Pricing
Taking the Plunge
By Thomas E. Lah, Executive Director, TSIA
Including a Case Study from Riccardo Brizzi, COO, SQS
The service offerings in the technology industry have been very weighted toward standing up a
technology in the customer’s environment and then ensuring that technology was available for use. As
TSIA has discussed in the book B4B,
1
the service offerings in the industry are shifting from an “asset”
focus to an “outcome” focus. The traditional implementation, education, and support service offerings
are losing their bloom in the marketplace. As the service portfolio shifts to being more focused on
business outcomes, these traditional service categories become less relevant. What is the specific
business challenge the technology provider can solve for the customer? This is what becomes
relevant. Instead of services that are centered on keeping the technology asset up and running, the
technology provider will have services that are designed to reduce operational complexity, accelerate
the usage of technical capabilities, and ultimately deliver quantifiable business impact.
Figure 1: The Great Divide
SERVICE INSIGHT
TSIA-SI-14-014
May 14, 2014
PROFESSIONAL
SERVICES
FIELD
SERVICES
SUPPORT
SERVICES
EDUCATION
SERVICES
SERVICE REVENUE
GENERATION
MANAGED
SERVICES
2
17065 Camino San Bernardo, Ste. 200 | San Diego, CA 92127 | Tel. 1.858.674.5491 | Fax. 1.858.430.3571
© Technology Services Industry Association | www.tsia.com
This Service Insight will tackle one of the very specific challenges facing technology companies as
they begin to pivot their service portfolio from an asset focus to an outcome focus: How do we price
outcome-based services? This is no simple question. But the first step in the journey is to clearly
define the concept of “business outcome.”
OUTCOME CATEGORIES
In 2013, while we were working on B4B, TSIA reached out to several member companies and asked
the following question: “Have you ever delivered a service offering where you only were paid if the
customer achieved a target business outcome?” There were long and short answers to this question,
but a majority of the responses were remarkably similar:
“Well, we once had a customer that only wanted to pay us if they achieved the ROI
defined in the business case that was used to justify this significant technology
purchase they were going to make. Our finance team and legal team were engaged
with their counterparts on the customer side. We tried to craft some type of gain-
sharing contract, but we could never get both parties to agree to all the parameters. In
the end, we fell back to a standard contract with standard terms.”
There were two variations in the responses. One variation involves some type of outcome-based
contract actually getting signed, only to have the provider lose their shirt attempting to achieve the
outcomes for the customer. The second variation involves an outcome contract being signed, only to
have the customer back out of the terms because they feared how much they might owe the
technology provider because success seemed imminent. What story we did not hear was one that
involved the successful and ongoing execution of outcome-based service contracts with customers.
Why?
TSIA believes one of the challenges creating friction in offering outcome-based services is a clear
definition of what type of business outcome you can actually deliver for your customer. As we have
scanned the industry for outcome-based services, it is clear that there are three distinct types of
outcomes technology companies can deliver to a customer:
• Type 1: Consumption-based outcomes. These are outcomes that are measured per click,
per user, per megabyte.
• Type 2: KPI-based outcomes. These are outcomes that are measured by achieving a target
reading for a defined key performance indicator (KPI). For example, the customer satisfaction
rating for a company improved by three points. The hold time for customers decreased by
three minutes.
3
17065 Camino San Bernardo, Ste. 200 | San Diego, CA 92127 | Tel. 1.858.674.5491 | Fax. 1.858.430.3571
© Technology Services Industry Association | www.tsia.com
• Type 3: Financial-based outcomes. These are outcomes measured in dollars. The customer
saved $500,000. Average spend per website visitor increased $40.
Figure 2: Outcome Types, provides a graphical view of these three categories. There are clear
industry examples of offers in each of these three categories. From Rackspace’s Type 1 consumption-
based hosting model to the Type 3 revenue sharing model that Redflex puts in place with cities that
purchase the Redlfex red-light camera technology.
Figure 2: Outcome Types
With this simple taxonomy in place, we now know there are three distinct types of outcomes a
technology provider can attempt to deliver to a customer. Clearly understanding what class of
outcome is in play is a significant first step in the journey toward outcome-based pricing. The second
step is understanding the difference between revenue streams, offer types, pricing models, and pricing
mechanisms.
REVENUE STREAMS, OFFER TYPES, PRICING MODELS, AND PRICING MECHANISMS
To set up strategies for outcome-based pricing, it is helpful to separate four distinct concepts:
1. Revenue Streams. The distinct ways that technology companies make money.
2. Offer Types. The distinct types of service offers a company may have.
3. Pricing Models. The model a company uses to set the price of a specific service offer.
4. Pricing Mechanism. The way the company charges the customer for a service offering.
4
17065 Camino San Bernardo, Ste. 200 | San Diego, CA 92127 | Tel. 1.858.674.5491 | Fax. 1.858.430.3571
© Technology Services Industry Association | www.tsia.com
Five Revenue Streams
A technology company has five distinct ways it can monetize with a customer:
1. Product. Customer pays for a technology asset. For example, the customer pays for
hardware or pays for a software license.
2. Subscription (Technology). The customer pays to access technology. SaaS and hosted
storage are examples of paying for access to technology that the customer never owns
outright.
3. Annuity Services. The customer signs an annual or multiyear contract for services from the
technology company. Traditional support service contracts fall into this category as well as
managed service contracts designed to assist a customer in their IT operations.
4. Project Services. The customer signs a contract for specific deliverables from the technology
company to be delivered within a project plan that has a beginning, an end, and milestone
deliverables in between. PS implementation projects are the classic example here.
5. Transactions. Last but not least, a technology company may have a revenue stream that is
transactional based. This means every time a certain activity occurs, the customer is charged.
Examples would include charging the customer per invoice issued or user added.
Historically, product companies have weighted their revenue streams in three of the five categories:
Product, Annuity Services, and Project Services. Figure 3 shows the most common revenue mixes
that existed within product companies pre-cloud era.
Figure 3: Common Revenue Mixes for Product Companies
5
17065 Camino San Bernardo, Ste. 200 | San Diego, CA 92127 | Tel. 1.858.674.5491 | Fax. 1.858.430.3571
© Technology Services Industry Association | www.tsia.com
Many Offer Types
Within the five revenue streams, there are many types of product and service offers a technology
company may provide. TSIA has documented a B4B Offer taxonomy that identifies the following key
offer categories:
• Product Services. These are the traditional services technology companies have offered that
are designed to implement and support a technology. These are the services weighted toward
the “asset” side of the B4B spectrum. This service category includes implementation,
customization, technical training, support, and many premium support offers.
• Optimize Services. These are services designed to help customers optimize their use of
technology capabilities. There are three distinct types of optimize services TSIA believes
product companies will provide to customers:
o Operational Services. These are services designed to reduce operational complexity
for customers. They include capacity planning, remote monitoring, risk audits, and
system administration. The main objective of these services is to minimize the cost of
operating a technology.
o Adoption Services. These are services designed to help customers maximize their
usage of technical capabilities. Unlike traditional education services, these services
involve usage analytics, user adoption reports, and intelligent feature provisioning.
The main objective of these services is to maximize technology adoption.
o Information Services. These are services designed to help	
  customers maintain the
integrity of their own customer and business data and accelerate business insights
from their own data. The main objective of these services is to improve the customer’s
ability to leverage their own data or leverage industry data that has been aggregated
by the technology provider.
• Outcome as a Service. These are not the historical “bundles” created by product companies
where service offerings are wrapped around a product and sold to the customer at some
bundled price. These are offerings where a provider bundles the products and services
required to guarantee a target business outcome for the customer. In other words, the
provider is masking any complexity from the customer and simply committing to deliver a
specific outcome for the customer. A simple real-world example of this service category would
be how red-light camera technology is sold to cities throughout the country. Cities do not pay
for the cameras or the installation of the cameras. The vendor is given a percentage of each
ticket (the outcome) issued from the cameras.
Figure 4: The B4B Services Portfolio documents these service categories and offer types within the
categories.
6
17065 Camino San Bernardo, Ste. 200 | San Diego, CA 92127 | Tel. 1.858.674.5491 | Fax. 1.858.430.3571
© Technology Services Industry Association | www.tsia.com
Figure 4: B4B Services Portfolio
Some of these offer types are not commonly found in the marketplace. Yet, technology companies are
already migrating their services into these categories. Software giant Oracle offers Advanced
Customer Services designed to monitor systems and reduce operational complexity. SaaS provider
salesforce.com has a set of Premier Success services that are designed to monitor usage and help
customers accelerate adoption. Siemens offers workflow optimization services for laboratories using
Siemens equipment. LivePerson offers an outcome-based managed service designed to improve
agent productivity in call centers.
The revenue from every offer type described in Figure 4 will fit into one of the five service revenue
streams outlined in the previous section. In other words, these offers will appear as product revenues,
subscription revenues, annuity service revenues, project revenues, or transaction revenues. So
different offers drive different types of revenues in the economic engine of the company. Now, the
question arises: What model should the company use to price these service offers?
7
17065 Camino San Bernardo, Ste. 200 | San Diego, CA 92127 | Tel. 1.858.674.5491 | Fax. 1.858.430.3571
© Technology Services Industry Association | www.tsia.com
Three Pricing Models
Every service offer is priced using one of three fundamental models:
• Cost Plus. In this pricing model, a company first determines the cost to deliver the offer. Then,
the company layers a target margin on top of those costs. This then determines the list price
for the offer.
• Market Based. In this pricing model, the company first determines what the market is
currently bearing for similar offers. The company then determines what margin is acceptable
on the offer to support the company’s financial objectives. Finally, the company determines if it
can deliver the offer within a cost footprint that will achieve the desired margin at the current
market price point.
• Value Based. In this pricing model, the company first calculates the specific business value
the offer should deliver to the customer. Next, the company determines the costs that will be
required to deliver that value. Finally, the company sets a price for the offer that lives
somewhere between the value line and the cost line. Ideally, in value-based pricing, there is
plenty of room between the value line and the cost line that allows a company to set a price
that easily meets or exceeds margin targets.
For more content on these three pricing models, refer to a TSIA paper titled “The Pricing Pentagon.”
TSIA has been studying service pricing models for years. There is no doubt that, historically, the vast
majority of service offers from technology companies have been priced using the cost-plus model.
True value-based pricing has been a rarity. TSIA predicts that emerging Level 3 and Level 4 service
portfolios will require technology companies to frequently apply both market-based and value-based
pricing models. This will not be an easy transition for the industry, as the SQS case study documented
below attests. However, there is one more component of the pricing discussion that needs to be
defined before we can review the SQS experience.
As technology companies migrate away from traditional offers with known pricing models, TSIA
predicts there will be four distinct pricing quadrants that will emerge for technology offers. These four
quadrants will be defined by two questions:
1. Structured service: Is this an offer that is custom for each customer, or is this an offer that is
well defined and repeatable from customer to customer?
2. Unique value proposition: Has our company created and defined a unique value proposition
related to this offer?
How you answer those two questions will determine which pricing model will be sustainable: Cost
based, market based, or value based. Figure 5 documents these pricing quadrants. Figure 6 maps
different offers to recommended pricing models.
8
17065 Camino San Bernardo, Ste. 200 | San Diego, CA 92127 | Tel. 1.858.674.5491 | Fax. 1.858.430.3571
© Technology Services Industry Association | www.tsia.com
Figure 5: Pricing Quadrants
Figure 6: Mapping Offer to Pricing Models
9
17065 Camino San Bernardo, Ste. 200 | San Diego, CA 92127 | Tel. 1.858.674.5491 | Fax. 1.858.430.3571
© Technology Services Industry Association | www.tsia.com
FIVE PRICING MECHANISMS
So far we have defined three critical components related to pricing service offers:
• The type of revenue stream the offer represents.
• The type of offer being priced:
o There are three distinct types of outcome offers.
• The pricing model being used to set the initial price of the offer:
o Is the offer unique or similar from customer to customer?
o Have we defined a unique value proposition for the offer?
The final component to understand is the pricing mechanism. In fact, when most people think about
pricing strategy, they are really thinking about pricing mechanisms. The pricing mechanism is how the
customer is actually charged for an offer. In the world of technology services, there are five common
pricing mechanisms:
• Percentage of “Other.” In this approach, the amount a customer is charged for an offer is a
percentage of what the customer paid for another item. This is the classic approach for how
customers are charged for software support (18% to 21% of the software license price).
• Time and Materials (T&M). Customers are charged for the actual effort of specific resources.
This is typically presented to the customer in hourly or daily rates.
• Fixed Price. Customers are charged a fixed price for a service offer. In this scenario, there
are usually specific milestones or deliverables that must be achieved to receive payment. This
pricing mechanism could be applied to offers that are designed to deliver Type 2 and Type 3
outcomes.
• Outcome Volume. The customer is charged based on the volume of a specified activity. For
example, the customer is charged for every add, move, or change processed for the customer.
This is transaction-related volume. Another example is the customer being charged for
additional storage they are consuming in a hosted storage solution. This is consumption-
based volume. This is the common pricing mechanism for offers designed to deliver a Type 1
outcome. Both transaction volume and consumption volume are classic Type 1 outcomes.
• Percentage of Outcome. The customer is charged a percentage of the value they achieved
from the offer. For example, a customer may be charged 10% of all the total savings
experienced because a service offer was executed. This is often referred to as gain sharing.
This pricing mechanism could be used for offers delivering Type B or Type C outcomes.
10
17065 Camino San Bernardo, Ste. 200 | San Diego, CA 92127 | Tel. 1.858.674.5491 | Fax. 1.858.430.3571
© Technology Services Industry Association | www.tsia.com
Just as the technology industry has relied heavily on cost-plus pricing models, the industry has relied
heavily on three pricing mechanisms:
• Percent of Other
• Time and Materials
• Fixed Price
The shift toward outcomes is forcing companies off of these three pricing mechanisms. Also, TSIA is
seeing the emergence of complex managed service contracts and premium support contracts that
may employ multiple pricing mechanisms within one annuity service contract. Now, how should a
company approach these dramatic changes in pricing? That is the topic of the next section.
PRICING PROCESS
Why did we go through all of this effort to define the concepts of outcome types, revenue streams,
offer types, pricing models, and pricing mechanisms? Because these concepts will help accelerate
your outcome-based pricing strategy.
As companies brainstorm new outcome-based service offerings, TSIA recommends the following
process:
1. Identify the type of revenue the offer will generate. Annuity service revenues? Project service
revenues?
2. Identify the offer type. Optimize offer? Information service? Outcome as a service?
3. If this is an outcome-based offer, identify what type of outcome the company is committing to
deliver. Type 1, Type 2, or Type 3?
4. Determine the pricing model that will be used to establish the target price for the offer. Cost-
plus, market-based, or value-based pricing?
5. Finally, determine what pricing model makes sense for this offer. Fixed price? Volume?
Percentage of outcome?
We can easily apply the five-step process to legacy service offers. Table 1 itemizes three common
offers and how they are structured using this model.
11
17065 Camino San Bernardo, Ste. 200 | San Diego, CA 92127 | Tel. 1.858.674.5491 | Fax. 1.858.430.3571
© Technology Services Industry Association | www.tsia.com
Table 1: Traditional Offers	
  
Revenue
Stream
Offer
Type
Outcome
Type
Pricing
Model
Pricing
Mechanism
Annuity
Service
Standard Support
Service
Not Applicable Market
Based
% of Other
Project
Service
PS Implementation
Project
Not Applicable Cost Plus Fixed Price
Annuity
Service
Managed Service Not Applicable Cost Plus Fixed Price
Now, what if your company is considering a new offer where the customer only pays if they achieve
specific outcomes? Table 2 outlines the parameters of some potential outcome-based offers.
Table 2: Outcome Offers
Revenue
Stream
Offer
Type
Outcome
Type
Pricing
Model
Pricing
Mechanism
Annuity
Service
Premium Support
Offering That
Minimizes System
Downtime Due to
Security Risks
Type 2
Outcome (KPI
Improvement)
Value
Based
% Reduction in
downtime
Transaction Managed Service for
System Admin
Type 1 Outcome
(Consumption)
Cost Plus % of Volume
(Transaction Fee
for Every Add/
Move/Change)
Project
Service
Professional Services
Project That Results in
Specific Cost Savings
for Customer
Type 3 Outcome
(Financial
Impact)
Value
Based
% of Outcome
12
17065 Camino San Bernardo, Ste. 200 | San Diego, CA 92127 | Tel. 1.858.674.5491 | Fax. 1.858.430.3571
© Technology Services Industry Association | www.tsia.com
By using this approach to document the key attributes of a new outcome-based offer, a management
team can align its understanding of the offer. Also, the management team can use the model to test
the assumptions of the offer’s attributes with other key stakeholders. The approach minimizes critical
misunderstandings that could exist regarding exactly what the new outcome offer represents. Finally,
once the attributes are documented, the company can roll up its sleeves to work on the specific
organization capabilities and data streams that will be required to execute the offer.
CHALLENGES
Technology companies are quickly being forced to enhance their organizational capabilities related to
pricing offers. This will not be a quick or painless journey. Specifically, as technology companies
attempt to define new outcome offerings, they are encountering a common set of challenges:
• Specific costs to deliver the outcome. How much will it cost our company to make sure the
customer achieves the target outcome?
• Predicting volume. For volume-based transaction revenue streams, how do we predict the
transaction volume? The volume clearly influences how much we want to charge per
transaction.
• Predicting impact. Can we accurately predict the financial benefits the customer will receive
if they purchase the offer?
• Understanding success science. Do we understand what the customer must do in order to
achieve the targeted outcome? What processes will they need to improve that are not our
direct responsibility?
• Pricing model. What pricing model is sustainable for outcome offers? Cost plus is probably
not the answer, but we have little experience drawing the value line.
None of these are insignificant challenges. In general, management teams will have little or zero
experience with outcome-based pricing when they first embark on this journey. For this reason, TSIA
strongly recommends the following tactics:
1. Introduce a clear framework for pricing offers.
2. Clarify the taxonomy surrounding pricing.
3. Start by documenting a pricing table for new Level 3 and Level 4 offers.
4. Leverage the lessons being learned by peers in the industry.
The next section of this paper documents the story of SQS as they migrated from a traditional time-
and-materials, project-based service offering to an outcome-based offering.
13
17065 Camino San Bernardo, Ste. 200 | San Diego, CA 92127 | Tel. 1.858.674.5491 | Fax. 1.858.430.3571
© Technology Services Industry Association | www.tsia.com
CASE STUDY: SQS
Company Profile
SQS is a leading specialist in software quality and offers a range of services:
• Software testing for projects.
• Improving development quality in IT projects.
• Requirements verification.
• Specialized consultant services.
• Managed services for software systems in operation and maintenance.
SQS has more than 3,500 employees located in 18 countries. The company generates revenues
exceeding $270 million. Riccardo Brizzi, the COO of the company, makes this following observation
concerning SQS: “We take pride in the fact that SQS is a highly rated testing services provider that is
engaged in some of the most challenging and critical business software change initiatives on the
globe.”
However, the testing services marketplace is highly competitive—even for a differentiated brand like
SQS. This is a case study on how SQS took the plunge from traditional service pricing models to an
outcome-based pricing model.
Legacy Service Offer
Historically, independent software testing services were offered in a classic time-and-materials model.
Companies would contract SQS to rigorously test new software. The total cost of the service was
based on the effort required. SQS, like the majority of service providers, had a cost-plus pricing model.
A rate for testing resources was created based on the cost of those resources. Table 3 provides the
parameters of the legacy offer at SQS.
Table 3: SQS Legacy Offer Parameters
Revenue
Stream
Outcome
Type
Offer
Type
Pricing
Model
Pricing
Mechanism
Project Service Not Applicable Testing Service Cost Plus T&M
Catalyst for Change
The challenge faced by SQS is the challenge being faced by many service providers today: the rate
customers were willing to pay for technical resources was under pressure. Testing had become a
14
17065 Camino San Bernardo, Ste. 200 | San Diego, CA 92127 | Tel. 1.858.674.5491 | Fax. 1.858.430.3571
© Technology Services Industry Association | www.tsia.com
globally resourced activity. This globalization led to intense pricing pressure. Customers expected the
cost of testing resources to decrease.
SQS soon found itself in price wars that were leading to thinner and thinner contract margins. The
management team was frustrated. They knew SQS brought much more to the table than just
technically competent testers. SQS had over a decade of experience optimizing testing strategies and
procedures. How could the company better leverage this deep expertise in the marketplace?
Outcome Offers
In October of 2010, the SQS management team decided to initiate a move toward Managed Testing
Services. The company defined the service as follows:
“Managed Testing Services are the provision of test activities by SQS to a Client,
where SQS undertakes the end-to-end responsibility for the delivery and management
of the relevant test services and solutions.”
The SQS management team felt customers would be attracted to the service for the following reasons:
• SQS would take responsibility to mitigate impact of delays/issues in test delivery.
• SQS would be measured on delivery rather than effort.
• The customer contract would mandate accountability by SQS for additional cost reductions
through service optimization over the lifespan of the contract.
The management team envisioned an outcome-based service offering with the following attributes:
• Type 1 Outcome Offer Type. Customers only pay if they consume a specific outcome. In this
case, if bugs are identified
• Annuity Revenue Stream. Customers would establish multi-project, multiyear relationships
with SQS.
• Value-Based Pricing Model. SQS had to determine and articulate the business value of a
bug identified in the testing process.
• Outcome Volume Pricing Mechanism. Customers would only pay for bugs actually identified
by SQS.
Table 4 summarizes the parameters of the new offer.
15
17065 Camino San Bernardo, Ste. 200 | San Diego, CA 92127 | Tel. 1.858.674.5491 | Fax. 1.858.430.3571
© Technology Services Industry Association | www.tsia.com
Table 4	
  
Revenue
Stream
Offer
Type
Outcome
Type
Pricing
Model
Pricing
Mechanism
Annuity
Service
Managed
Testing Service
Type 1
(Consumption)
Value Based Outcome
Volume
Of course, envisioning a new outcome-based offer and executing a new outcome-based offer are two
completely different milestones. The SQS team engaged with several customers before crafting an
approach that met the customer’s business needs and was profitable to SQS.
Key Lessons Learned
Riccardo Brizzi, the COO of the company, was intimately involved, together with the SQS leadership,
in the process of launching this new service. Mr. Brizzi has many insights regarding the challenges of
pivoting to an outcome-based offer. Here are a few of his key insights related to the following topics:
Initial Pricing: Setting the Initial Price/Contract Structure
The biggest challenge with outcome-based pricing is to define a price acceptable to the client and
profitable to SQS. Typically this cannot be done without a deep understanding of the client
environment. While for the client the pricing is outcome based, for SQS we still needed a thorough
understanding of the effort required to get to the point of, in these cases, an almost fully automated
regression testing situation. The steps required to get to this point require a close collaboration with
the client, and the client needs to be educated in the process of how to arrive at the point where both
sides benefit. There is no quick fix. The key lesson learned here was partner with clients who have the
maturity to migrate to this kind of offer—clients who see the benefits of the long-term relationship
(since the up-front costs are not always immediately lower than current costs, you need a long-term
contract to realize the value). Obviously showing the clients wins along the path to this contractual
arrangement is key to keeping them interested and confident in the process. Proof of concepts and
contracts where prices drop year-on-year are useful ways of showing these wins.
Another concept we adopted in the initial pricing models was to differentiate between pricing and
billing. The price was determined on the basis of requirements (output of a previous step/activity) as a
price per requirement. However, our billing was based on the actual test cases executed. This was
important to our clients, as typically the number of requirements can vary considerably leading up to
the implementation freeze. This gave our clients the confidence that only functionality that was actually
implemented was tested, and only that testing was paid for.
16
17065 Camino San Bernardo, Ste. 200 | San Diego, CA 92127 | Tel. 1.858.674.5491 | Fax. 1.858.430.3571
© Technology Services Industry Association | www.tsia.com
Selling Outcomes: Changing the Sales Pitch. Different Buyer?
Selling managed services is all about selling long-term value. And for a client, it is about entrusting a
piece of their business to a trusted partner. The people inside a client organization typically used to
buying services are often either threatened by the managed service process or are not interested, as
they have short-term goals to meet. What is needed in these situations is a C-level relationship with
someone who understands the longer-term value of these contracts and who buys into the process for
setting them up. Clearly, these executives have little time, and so the sales pitch has to be value
based, solve a defined problem, and have interim value milestones to keep any detractors at bay
during the process.
Contract Structure
The contract has to reflect the journey that both the client and the supplier need to go through. This is
about partnership, shared risk, and clear roles and responsibilities. The end state must be clear, as
must be the interim milestones. To automate testing, for example, there are strong prerequisites for a
stable development and operating environment. The client’s applications strategy must be defined,
and the requirements-gathering process time must be boxed. Without these prerequisites, arriving at
an outcome-based or consumption-based operating model is not possible, as too many variables can
impact either the cost of the service, which is bad for the supplier, or the value of the output, which is
bad for the client.
Piloting
An effective way of embarking on the journey is through pilots or proof of concepts. In our case, we
often, at our own cost or a reduced cost, take a subset of the work that needs to be done and run a
pilot or POC. For example, automating a small number of test cases to show that this can be an
effective quick win—even if done on a T&M basis. This gives the client confidence, and potentially
shows the value that can be delivered (and then used to fund the transition to a fully fledged output or
consumption-based model).
Choosing the Right Customers
Client maturity is a key factor in selling managed service deals and eventually moving toward
outcome-based pricing. The role of the client changes significantly from delivering a service to the
organization, to managing SLA-based delivery through a third party. The client no longer needs deeply
technical people, but rather contract managers with an understanding of what is required from both
sides to make the contract work. Without these strong managers, the risk of failure is great, and the
temptation to bring the service back in-house or revert to a typical T&M body-shopping model is strong.
Getting away from the clichés of “not invented here,” “this is how we have always done it,” “too risky to
give this to a partner,” and “we need to maintain ownership to maintain control” all have to be
overcome.
17
17065 Camino San Bernardo, Ste. 200 | San Diego, CA 92127 | Tel. 1.858.674.5491 | Fax. 1.858.430.3571
© Technology Services Industry Association | www.tsia.com
Fortunately, choosing the right customers has a snowball effect. Clients want to hear success stories,
and if someone else has gone through the pain of learning how to do it and has been successful, it
reassures them.
Financial Results
The most amazing aspect of the SQS story is how the company successfully experimented with new
outcome-based offerings without negatively impacting the overall performance of the company. Figure
7 shows the stock price of SQS during the time period the outcome offers were piloted (January 2013
to March 2014).
Figure 7: Stock Price of SQS During Outcome Offers Pilot (January 2014 to March 2014)
Figure 8 documents some of the key financial metrics related to these new managed services.
Figure 8: Managed Services Key Financial Metrics
18
17065 Camino San Bernardo, Ste. 200 | San Diego, CA 92127 | Tel. 1.858.674.5491 | Fax. 1.858.430.3571
© Technology Services Industry Association | www.tsia.com
Finally, it is important to observe that SQS actually reduced the number of clients during this period.
As highlighted above, not all clients were well suited to the new outcome-based pricing models.
However, as documented in Figure 9, the average revenue per client increased dramatically.
Figure 9: Average Revenue per Client
SUMMARY: SUCCESS TACTICS FOR OUTCOME-BASED PRICING
Taking the plunge into outcome-based pricing will not be like entering a nice warm bath. This
experience will feel more like jumping from a cliff into churning ocean waters. To swim safely to a
shore of profitable outcome-based pricing, TSIA recommends members pursue the following success
tactics:
• Document the pricing strategy parameters. The first step in this journey is to align key
internal stakeholders regarding the nature of a new outcome-based offering. Discuss, debate,
and document offer type, revenue stream, pricing model, pricing mechanism, and target
outcome type.
• Identify key data gaps. To commit to outcomes, you will most likely need specific data
streams. They may come from your product; they may come from the customer. What are the
data streams you will need to consistently deliver the outcome?
• Pilot with customers to understand volume and success science. As the SQS case study
demonstrates, you will likely need to learn as you go with new outcome offers. Identify
customers that want to partner on this journey. Structure initial contracts so there are clear
milestones where pricing can be revisited. Also, avoid long-term contracts until it is clear you
can profitably deliver an outcome-based offering.
19
17065 Camino San Bernardo, Ste. 200 | San Diego, CA 92127 | Tel. 1.858.674.5491 | Fax. 1.858.430.3571
© Technology Services Industry Association | www.tsia.com
• Establish two-way SLAs with customers. It is very unlikely you will be able to generate
specific outcomes for the customer without their engagement. During pilots, identify what is
required from the customer. Codify those requirements in the SLAs that the customer must
meet in order for the outcome pricing to be valid.
• Wind down unprofitable outcome-based customers. As SQS learned, not all customers
are well suited for outcome-based offers. Create clear criteria for selecting customers, and
create clear criteria for evaluating which outcome-based contracts should be terminated.
• Can’t be easy to say no. Once again, this is a plunge. Many internal stakeholders will have
many reasons for why this is too risky or too hard to attempt. However, think of the risk
involved if a competitor masters this model before you do. If you were providing testing
services on an hourly basis, would you want to compete against SQS’s outcome-based model?
If key stakeholders raise concerns, they should be responsible for finding ways to mitigate the
risks they have identified.
The migration to outcome-based pricing will take time. For this reason, TSIA recommends
organizations begin the journey today.
1
Wood, J.B., Todd Hewlin, and Thomas Lah. 2013. B4B: How Technology and Big Data Are Reinventing the
Customer-Supplier Relationship. San Diego, CA: Point B, Inc.

Más contenido relacionado

La actualidad más candente

The 5 Must Have Customer Success Processes
The 5 Must Have Customer Success ProcessesThe 5 Must Have Customer Success Processes
The 5 Must Have Customer Success ProcessesTotango
 
SaaS.City 2017 Customer Success Bootcamp
SaaS.City 2017 Customer Success BootcampSaaS.City 2017 Customer Success Bootcamp
SaaS.City 2017 Customer Success BootcampGainsight
 
How to measure your success as a Customer Success Manager
How to measure your success as a Customer Success ManagerHow to measure your success as a Customer Success Manager
How to measure your success as a Customer Success ManagerAmity
 
Hiring: Structuring and Recruiting A Customer Success Team to Scale
Hiring: Structuring and Recruiting A Customer Success Team to ScaleHiring: Structuring and Recruiting A Customer Success Team to Scale
Hiring: Structuring and Recruiting A Customer Success Team to ScaleGainsight
 
inSided + Usabilla: Product Adoption Strategies for CSMs
inSided + Usabilla: Product Adoption Strategies for CSMs inSided + Usabilla: Product Adoption Strategies for CSMs
inSided + Usabilla: Product Adoption Strategies for CSMs Danielle Juson
 
How to account for customer success
How to account for customer successHow to account for customer success
How to account for customer successGainsight
 
How to Build the Ultimate Customer Success Board Presentation
How to Build the Ultimate Customer Success Board PresentationHow to Build the Ultimate Customer Success Board Presentation
How to Build the Ultimate Customer Success Board PresentationGainsight
 
Customer Success 101
Customer Success 101   Customer Success 101
Customer Success 101 Raj
 
Customer Success Strategy Template
Customer Success Strategy TemplateCustomer Success Strategy Template
Customer Success Strategy TemplateOpsPanda
 
The Key to CSM Success: User Adoption
The Key to CSM Success: User AdoptionThe Key to CSM Success: User Adoption
The Key to CSM Success: User AdoptionAmity
 
The Customer Success Playbooks You Need to Drive Adoption
The Customer Success Playbooks You Need to Drive AdoptionThe Customer Success Playbooks You Need to Drive Adoption
The Customer Success Playbooks You Need to Drive AdoptionAmity
 
Customer Success - Why and How of Gainsight's 14 Elements
Customer Success - Why and How of Gainsight's 14 ElementsCustomer Success - Why and How of Gainsight's 14 Elements
Customer Success - Why and How of Gainsight's 14 ElementsGainsight
 
How to Build Customer Success at an Early Stage Startup
How to Build Customer Success at an Early Stage Startup How to Build Customer Success at an Early Stage Startup
How to Build Customer Success at an Early Stage Startup Gainsight
 
The Power of a Proper North Star Metric
The Power of a Proper North Star MetricThe Power of a Proper North Star Metric
The Power of a Proper North Star MetricRocketSource
 
Developing The Ultimate Customer Success Strategy
Developing The Ultimate Customer Success Strategy Developing The Ultimate Customer Success Strategy
Developing The Ultimate Customer Success Strategy Gainsight
 
Building a Business Case for Customer Success
Building a Business Case for Customer SuccessBuilding a Business Case for Customer Success
Building a Business Case for Customer SuccessGainsight
 
The Definitive Guide to Customer Success 2017
The Definitive Guide to Customer Success 2017The Definitive Guide to Customer Success 2017
The Definitive Guide to Customer Success 2017Lincoln Murphy
 
How a Gainsight CSM uses Success Plans
How a Gainsight CSM uses Success PlansHow a Gainsight CSM uses Success Plans
How a Gainsight CSM uses Success PlansGainsight
 
Cross Functional Alignment Around the Customer Processes to Drive Success
Cross Functional Alignment Around the Customer Processes to Drive SuccessCross Functional Alignment Around the Customer Processes to Drive Success
Cross Functional Alignment Around the Customer Processes to Drive SuccessGainsight
 

La actualidad más candente (20)

The 5 Must Have Customer Success Processes
The 5 Must Have Customer Success ProcessesThe 5 Must Have Customer Success Processes
The 5 Must Have Customer Success Processes
 
SaaS.City 2017 Customer Success Bootcamp
SaaS.City 2017 Customer Success BootcampSaaS.City 2017 Customer Success Bootcamp
SaaS.City 2017 Customer Success Bootcamp
 
How to measure your success as a Customer Success Manager
How to measure your success as a Customer Success ManagerHow to measure your success as a Customer Success Manager
How to measure your success as a Customer Success Manager
 
Hiring: Structuring and Recruiting A Customer Success Team to Scale
Hiring: Structuring and Recruiting A Customer Success Team to ScaleHiring: Structuring and Recruiting A Customer Success Team to Scale
Hiring: Structuring and Recruiting A Customer Success Team to Scale
 
inSided + Usabilla: Product Adoption Strategies for CSMs
inSided + Usabilla: Product Adoption Strategies for CSMs inSided + Usabilla: Product Adoption Strategies for CSMs
inSided + Usabilla: Product Adoption Strategies for CSMs
 
How to account for customer success
How to account for customer successHow to account for customer success
How to account for customer success
 
How to Build the Ultimate Customer Success Board Presentation
How to Build the Ultimate Customer Success Board PresentationHow to Build the Ultimate Customer Success Board Presentation
How to Build the Ultimate Customer Success Board Presentation
 
Customer Success 101
Customer Success 101   Customer Success 101
Customer Success 101
 
Customer success manager role
Customer success manager roleCustomer success manager role
Customer success manager role
 
Customer Success Strategy Template
Customer Success Strategy TemplateCustomer Success Strategy Template
Customer Success Strategy Template
 
The Key to CSM Success: User Adoption
The Key to CSM Success: User AdoptionThe Key to CSM Success: User Adoption
The Key to CSM Success: User Adoption
 
The Customer Success Playbooks You Need to Drive Adoption
The Customer Success Playbooks You Need to Drive AdoptionThe Customer Success Playbooks You Need to Drive Adoption
The Customer Success Playbooks You Need to Drive Adoption
 
Customer Success - Why and How of Gainsight's 14 Elements
Customer Success - Why and How of Gainsight's 14 ElementsCustomer Success - Why and How of Gainsight's 14 Elements
Customer Success - Why and How of Gainsight's 14 Elements
 
How to Build Customer Success at an Early Stage Startup
How to Build Customer Success at an Early Stage Startup How to Build Customer Success at an Early Stage Startup
How to Build Customer Success at an Early Stage Startup
 
The Power of a Proper North Star Metric
The Power of a Proper North Star MetricThe Power of a Proper North Star Metric
The Power of a Proper North Star Metric
 
Developing The Ultimate Customer Success Strategy
Developing The Ultimate Customer Success Strategy Developing The Ultimate Customer Success Strategy
Developing The Ultimate Customer Success Strategy
 
Building a Business Case for Customer Success
Building a Business Case for Customer SuccessBuilding a Business Case for Customer Success
Building a Business Case for Customer Success
 
The Definitive Guide to Customer Success 2017
The Definitive Guide to Customer Success 2017The Definitive Guide to Customer Success 2017
The Definitive Guide to Customer Success 2017
 
How a Gainsight CSM uses Success Plans
How a Gainsight CSM uses Success PlansHow a Gainsight CSM uses Success Plans
How a Gainsight CSM uses Success Plans
 
Cross Functional Alignment Around the Customer Processes to Drive Success
Cross Functional Alignment Around the Customer Processes to Drive SuccessCross Functional Alignment Around the Customer Processes to Drive Success
Cross Functional Alignment Around the Customer Processes to Drive Success
 

Destacado

Unleashing the Revenue Generating Power of Your Field Services Workforce
Unleashing the Revenue Generating Power of Your Field Services WorkforceUnleashing the Revenue Generating Power of Your Field Services Workforce
Unleashing the Revenue Generating Power of Your Field Services WorkforceGlobal Partners Inc.
 
4 Key Trends that Fuel Recurring Revenue Adoption
4 Key Trends that Fuel Recurring Revenue Adoption4 Key Trends that Fuel Recurring Revenue Adoption
4 Key Trends that Fuel Recurring Revenue AdoptionAria Systems, Inc.
 
Revenue Strategy: The High Cost of Ignoring Value
Revenue Strategy: The High Cost of Ignoring ValueRevenue Strategy: The High Cost of Ignoring Value
Revenue Strategy: The High Cost of Ignoring ValueTim Peter
 
Mobile Monday Switzerland #38 - TSIA presentation on The Connected Technician
Mobile Monday Switzerland #38 - TSIA presentation on The Connected TechnicianMobile Monday Switzerland #38 - TSIA presentation on The Connected Technician
Mobile Monday Switzerland #38 - TSIA presentation on The Connected TechnicianMobileMonday Switzerland
 
Nicolas Schobinger | Optimizing the Customer Experience: How to Deliver the "...
Nicolas Schobinger | Optimizing the Customer Experience: How to Deliver the "...Nicolas Schobinger | Optimizing the Customer Experience: How to Deliver the "...
Nicolas Schobinger | Optimizing the Customer Experience: How to Deliver the "...Nicolas Schobinger
 
Give The Green Light: Build Your Business Case for Field Service Technology
Give The Green Light: Build Your Business Case for Field Service TechnologyGive The Green Light: Build Your Business Case for Field Service Technology
Give The Green Light: Build Your Business Case for Field Service TechnologyServiceMax
 
[Infographic] Why Managed Services Organization Structure Matters
[Infographic] Why Managed Services Organization Structure Matters[Infographic] Why Managed Services Organization Structure Matters
[Infographic] Why Managed Services Organization Structure MattersTSIA
 
Portals for Field Serivce: Your Secret to Success With Partners and Customers
Portals for Field Serivce: Your Secret to Success With Partners and CustomersPortals for Field Serivce: Your Secret to Success With Partners and Customers
Portals for Field Serivce: Your Secret to Success With Partners and CustomersServiceMax
 
Pricing models for bpo organizations
Pricing models for bpo organizationsPricing models for bpo organizations
Pricing models for bpo organizationsSudhakar Shukla
 
ROI Case Studies: Experience the TSIA Impact
ROI Case Studies: Experience the TSIA ImpactROI Case Studies: Experience the TSIA Impact
ROI Case Studies: Experience the TSIA ImpactTSIA
 
KPI for HR Manager - Sample of KPIs for HR
KPI for HR Manager - Sample of KPIs for HRKPI for HR Manager - Sample of KPIs for HR
KPI for HR Manager - Sample of KPIs for HRYodhia Antariksa
 

Destacado (13)

Unleashing the Revenue Generating Power of Your Field Services Workforce
Unleashing the Revenue Generating Power of Your Field Services WorkforceUnleashing the Revenue Generating Power of Your Field Services Workforce
Unleashing the Revenue Generating Power of Your Field Services Workforce
 
4 Key Trends that Fuel Recurring Revenue Adoption
4 Key Trends that Fuel Recurring Revenue Adoption4 Key Trends that Fuel Recurring Revenue Adoption
4 Key Trends that Fuel Recurring Revenue Adoption
 
Revenue Strategy: The High Cost of Ignoring Value
Revenue Strategy: The High Cost of Ignoring ValueRevenue Strategy: The High Cost of Ignoring Value
Revenue Strategy: The High Cost of Ignoring Value
 
Mobile Monday Switzerland #38 - TSIA presentation on The Connected Technician
Mobile Monday Switzerland #38 - TSIA presentation on The Connected TechnicianMobile Monday Switzerland #38 - TSIA presentation on The Connected Technician
Mobile Monday Switzerland #38 - TSIA presentation on The Connected Technician
 
Nicolas Schobinger | Optimizing the Customer Experience: How to Deliver the "...
Nicolas Schobinger | Optimizing the Customer Experience: How to Deliver the "...Nicolas Schobinger | Optimizing the Customer Experience: How to Deliver the "...
Nicolas Schobinger | Optimizing the Customer Experience: How to Deliver the "...
 
Give The Green Light: Build Your Business Case for Field Service Technology
Give The Green Light: Build Your Business Case for Field Service TechnologyGive The Green Light: Build Your Business Case for Field Service Technology
Give The Green Light: Build Your Business Case for Field Service Technology
 
[Infographic] Why Managed Services Organization Structure Matters
[Infographic] Why Managed Services Organization Structure Matters[Infographic] Why Managed Services Organization Structure Matters
[Infographic] Why Managed Services Organization Structure Matters
 
Portals for Field Serivce: Your Secret to Success With Partners and Customers
Portals for Field Serivce: Your Secret to Success With Partners and CustomersPortals for Field Serivce: Your Secret to Success With Partners and Customers
Portals for Field Serivce: Your Secret to Success With Partners and Customers
 
Pricing models for bpo organizations
Pricing models for bpo organizationsPricing models for bpo organizations
Pricing models for bpo organizations
 
TSIA/TSW Support Services Partner Best Practices Panel
TSIA/TSW Support Services Partner Best Practices PanelTSIA/TSW Support Services Partner Best Practices Panel
TSIA/TSW Support Services Partner Best Practices Panel
 
ROI Case Studies: Experience the TSIA Impact
ROI Case Studies: Experience the TSIA ImpactROI Case Studies: Experience the TSIA Impact
ROI Case Studies: Experience the TSIA Impact
 
KPI for HR Manager - Sample of KPIs for HR
KPI for HR Manager - Sample of KPIs for HRKPI for HR Manager - Sample of KPIs for HR
KPI for HR Manager - Sample of KPIs for HR
 
10 Ways to Stop Service Revenue Leakage
10 Ways to Stop Service Revenue Leakage10 Ways to Stop Service Revenue Leakage
10 Ways to Stop Service Revenue Leakage
 

Similar a Tsia outcome-based-pricing-sqs

Digital Transformation for Aftermarket Sales & Service
Digital Transformation for Aftermarket Sales & ServiceDigital Transformation for Aftermarket Sales & Service
Digital Transformation for Aftermarket Sales & ServiceJohn Mertl
 
Digital transformation for aftermarket sales service
Digital transformation for aftermarket sales serviceDigital transformation for aftermarket sales service
Digital transformation for aftermarket sales serviceJohn Mertl
 
GrowthEnabler In focus financial services - capital markets presentation
GrowthEnabler In focus financial services - capital markets presentationGrowthEnabler In focus financial services - capital markets presentation
GrowthEnabler In focus financial services - capital markets presentationGraphi Tales
 
Modernizing the Insurance Value Chain: Top Three Digital Imperatives
Modernizing the Insurance Value Chain: Top Three Digital ImperativesModernizing the Insurance Value Chain: Top Three Digital Imperatives
Modernizing the Insurance Value Chain: Top Three Digital ImperativesCognizant
 
Identifying and Evaluating Winning IT Services
Identifying and Evaluating Winning IT ServicesIdentifying and Evaluating Winning IT Services
Identifying and Evaluating Winning IT ServicesCognizant
 
Engage 9 Blocks Business Model case study
Engage 9 Blocks Business Model case studyEngage 9 Blocks Business Model case study
Engage 9 Blocks Business Model case studyAbdelrhman Tantawy
 
Getting Digital Right
Getting Digital RightGetting Digital Right
Getting Digital RightCognizant
 
Creating Intelligent Infrastructure for Extreme Automation
Creating Intelligent Infrastructure for Extreme AutomationCreating Intelligent Infrastructure for Extreme Automation
Creating Intelligent Infrastructure for Extreme Automationwiseio
 
What exactly am i paying for bmc
What exactly am i paying for   bmcWhat exactly am i paying for   bmc
What exactly am i paying for bmcKarthik Arumugham
 
The Forrester Wave Subscription Billing Platforms Q4 2015
The Forrester Wave Subscription Billing Platforms Q4 2015The Forrester Wave Subscription Billing Platforms Q4 2015
The Forrester Wave Subscription Billing Platforms Q4 2015Erik Long
 
Module 5 Strategic Issues of Information Technology.pptx
Module 5 Strategic Issues of Information Technology.pptxModule 5 Strategic Issues of Information Technology.pptx
Module 5 Strategic Issues of Information Technology.pptxhello1506hello
 
Digital Transformation Strategies for Small Businesses.pdf
Digital Transformation Strategies for Small Businesses.pdfDigital Transformation Strategies for Small Businesses.pdf
Digital Transformation Strategies for Small Businesses.pdfMr. Business Magazine
 
Running Head COMPETITIVE ANALYSISCOMPETITIVE ANALYSIS 3CO.docx
Running Head COMPETITIVE ANALYSISCOMPETITIVE ANALYSIS 3CO.docxRunning Head COMPETITIVE ANALYSISCOMPETITIVE ANALYSIS 3CO.docx
Running Head COMPETITIVE ANALYSISCOMPETITIVE ANALYSIS 3CO.docxjoellemurphey
 
Human Issues In BPO & Call Centre - SANSU
Human Issues In BPO & Call Centre - SANSUHuman Issues In BPO & Call Centre - SANSU
Human Issues In BPO & Call Centre - SANSUSaranya Sansu
 

Similar a Tsia outcome-based-pricing-sqs (20)

Digital Transformation for Aftermarket Sales & Service
Digital Transformation for Aftermarket Sales & ServiceDigital Transformation for Aftermarket Sales & Service
Digital Transformation for Aftermarket Sales & Service
 
Digital transformation for aftermarket sales service
Digital transformation for aftermarket sales serviceDigital transformation for aftermarket sales service
Digital transformation for aftermarket sales service
 
GrowthEnabler In focus financial services - capital markets presentation
GrowthEnabler In focus financial services - capital markets presentationGrowthEnabler In focus financial services - capital markets presentation
GrowthEnabler In focus financial services - capital markets presentation
 
Account mining
Account miningAccount mining
Account mining
 
Modernizing the Insurance Value Chain: Top Three Digital Imperatives
Modernizing the Insurance Value Chain: Top Three Digital ImperativesModernizing the Insurance Value Chain: Top Three Digital Imperatives
Modernizing the Insurance Value Chain: Top Three Digital Imperatives
 
Identifying and Evaluating Winning IT Services
Identifying and Evaluating Winning IT ServicesIdentifying and Evaluating Winning IT Services
Identifying and Evaluating Winning IT Services
 
Engage 9 Blocks Business Model case study
Engage 9 Blocks Business Model case studyEngage 9 Blocks Business Model case study
Engage 9 Blocks Business Model case study
 
Telecoms + It
Telecoms + ItTelecoms + It
Telecoms + It
 
Getting Digital Right
Getting Digital RightGetting Digital Right
Getting Digital Right
 
Creating Intelligent Infrastructure for Extreme Automation
Creating Intelligent Infrastructure for Extreme AutomationCreating Intelligent Infrastructure for Extreme Automation
Creating Intelligent Infrastructure for Extreme Automation
 
What exactly am i paying for bmc
What exactly am i paying for   bmcWhat exactly am i paying for   bmc
What exactly am i paying for bmc
 
The Forrester Wave Subscription Billing Platforms Q4 2015
The Forrester Wave Subscription Billing Platforms Q4 2015The Forrester Wave Subscription Billing Platforms Q4 2015
The Forrester Wave Subscription Billing Platforms Q4 2015
 
Roi Tco
Roi TcoRoi Tco
Roi Tco
 
Module 5 Strategic Issues of Information Technology.pptx
Module 5 Strategic Issues of Information Technology.pptxModule 5 Strategic Issues of Information Technology.pptx
Module 5 Strategic Issues of Information Technology.pptx
 
Part 3 (Merged).pptx
Part 3 (Merged).pptxPart 3 (Merged).pptx
Part 3 (Merged).pptx
 
Digital Transformation Strategies for Small Businesses.pdf
Digital Transformation Strategies for Small Businesses.pdfDigital Transformation Strategies for Small Businesses.pdf
Digital Transformation Strategies for Small Businesses.pdf
 
Running Head COMPETITIVE ANALYSISCOMPETITIVE ANALYSIS 3CO.docx
Running Head COMPETITIVE ANALYSISCOMPETITIVE ANALYSIS 3CO.docxRunning Head COMPETITIVE ANALYSISCOMPETITIVE ANALYSIS 3CO.docx
Running Head COMPETITIVE ANALYSISCOMPETITIVE ANALYSIS 3CO.docx
 
Human Issues In BPO & Call Centre - SANSU
Human Issues In BPO & Call Centre - SANSUHuman Issues In BPO & Call Centre - SANSU
Human Issues In BPO & Call Centre - SANSU
 
30 Measurable Use Cases for IoT by M Capone
30 Measurable Use Cases for IoT by M Capone30 Measurable Use Cases for IoT by M Capone
30 Measurable Use Cases for IoT by M Capone
 
NSDigitalizationtoSuccess
NSDigitalizationtoSuccessNSDigitalizationtoSuccess
NSDigitalizationtoSuccess
 

Más de BMI Healthcare

How to build effective and cheaper m-payments with Open Source
How to build effective and cheaper m-payments with Open SourceHow to build effective and cheaper m-payments with Open Source
How to build effective and cheaper m-payments with Open SourceBMI Healthcare
 
Keys to m-payment strategy that reduces risks and improves efficiency
Keys to m-payment strategy that reduces risks and improves efficiencyKeys to m-payment strategy that reduces risks and improves efficiency
Keys to m-payment strategy that reduces risks and improves efficiencyBMI Healthcare
 
How to reduce security risks to ensure user confidence in m-payments
How to reduce security risks to ensure user confidence in m-paymentsHow to reduce security risks to ensure user confidence in m-payments
How to reduce security risks to ensure user confidence in m-paymentsBMI Healthcare
 
How to adopt successful m-payment collaboration with Agile
How to adopt successful m-payment collaboration with AgileHow to adopt successful m-payment collaboration with Agile
How to adopt successful m-payment collaboration with AgileBMI Healthcare
 
Keys on improving effectiveness in m-payments with Test Automation
Keys on improving effectiveness in m-payments with Test AutomationKeys on improving effectiveness in m-payments with Test Automation
Keys on improving effectiveness in m-payments with Test AutomationBMI Healthcare
 
2013 fy-preliminary-results
2013 fy-preliminary-results2013 fy-preliminary-results
2013 fy-preliminary-resultsBMI Healthcare
 
Case Study SpecsaversCase specsavers-en
Case Study SpecsaversCase specsavers-enCase Study SpecsaversCase specsavers-en
Case Study SpecsaversCase specsavers-enBMI Healthcare
 

Más de BMI Healthcare (7)

How to build effective and cheaper m-payments with Open Source
How to build effective and cheaper m-payments with Open SourceHow to build effective and cheaper m-payments with Open Source
How to build effective and cheaper m-payments with Open Source
 
Keys to m-payment strategy that reduces risks and improves efficiency
Keys to m-payment strategy that reduces risks and improves efficiencyKeys to m-payment strategy that reduces risks and improves efficiency
Keys to m-payment strategy that reduces risks and improves efficiency
 
How to reduce security risks to ensure user confidence in m-payments
How to reduce security risks to ensure user confidence in m-paymentsHow to reduce security risks to ensure user confidence in m-payments
How to reduce security risks to ensure user confidence in m-payments
 
How to adopt successful m-payment collaboration with Agile
How to adopt successful m-payment collaboration with AgileHow to adopt successful m-payment collaboration with Agile
How to adopt successful m-payment collaboration with Agile
 
Keys on improving effectiveness in m-payments with Test Automation
Keys on improving effectiveness in m-payments with Test AutomationKeys on improving effectiveness in m-payments with Test Automation
Keys on improving effectiveness in m-payments with Test Automation
 
2013 fy-preliminary-results
2013 fy-preliminary-results2013 fy-preliminary-results
2013 fy-preliminary-results
 
Case Study SpecsaversCase specsavers-en
Case Study SpecsaversCase specsavers-enCase Study SpecsaversCase specsavers-en
Case Study SpecsaversCase specsavers-en
 

Tsia outcome-based-pricing-sqs

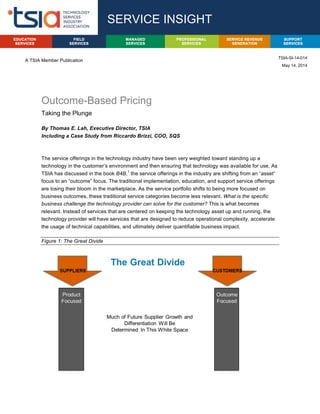
  • 1. A TSIA Member Publication Outcome-Based Pricing Taking the Plunge By Thomas E. Lah, Executive Director, TSIA Including a Case Study from Riccardo Brizzi, COO, SQS The service offerings in the technology industry have been very weighted toward standing up a technology in the customer’s environment and then ensuring that technology was available for use. As TSIA has discussed in the book B4B, 1 the service offerings in the industry are shifting from an “asset” focus to an “outcome” focus. The traditional implementation, education, and support service offerings are losing their bloom in the marketplace. As the service portfolio shifts to being more focused on business outcomes, these traditional service categories become less relevant. What is the specific business challenge the technology provider can solve for the customer? This is what becomes relevant. Instead of services that are centered on keeping the technology asset up and running, the technology provider will have services that are designed to reduce operational complexity, accelerate the usage of technical capabilities, and ultimately deliver quantifiable business impact. Figure 1: The Great Divide SERVICE INSIGHT TSIA-SI-14-014 May 14, 2014 PROFESSIONAL SERVICES FIELD SERVICES SUPPORT SERVICES EDUCATION SERVICES SERVICE REVENUE GENERATION MANAGED SERVICES
  • 2. 2 17065 Camino San Bernardo, Ste. 200 | San Diego, CA 92127 | Tel. 1.858.674.5491 | Fax. 1.858.430.3571 © Technology Services Industry Association | www.tsia.com This Service Insight will tackle one of the very specific challenges facing technology companies as they begin to pivot their service portfolio from an asset focus to an outcome focus: How do we price outcome-based services? This is no simple question. But the first step in the journey is to clearly define the concept of “business outcome.” OUTCOME CATEGORIES In 2013, while we were working on B4B, TSIA reached out to several member companies and asked the following question: “Have you ever delivered a service offering where you only were paid if the customer achieved a target business outcome?” There were long and short answers to this question, but a majority of the responses were remarkably similar: “Well, we once had a customer that only wanted to pay us if they achieved the ROI defined in the business case that was used to justify this significant technology purchase they were going to make. Our finance team and legal team were engaged with their counterparts on the customer side. We tried to craft some type of gain- sharing contract, but we could never get both parties to agree to all the parameters. In the end, we fell back to a standard contract with standard terms.” There were two variations in the responses. One variation involves some type of outcome-based contract actually getting signed, only to have the provider lose their shirt attempting to achieve the outcomes for the customer. The second variation involves an outcome contract being signed, only to have the customer back out of the terms because they feared how much they might owe the technology provider because success seemed imminent. What story we did not hear was one that involved the successful and ongoing execution of outcome-based service contracts with customers. Why? TSIA believes one of the challenges creating friction in offering outcome-based services is a clear definition of what type of business outcome you can actually deliver for your customer. As we have scanned the industry for outcome-based services, it is clear that there are three distinct types of outcomes technology companies can deliver to a customer: • Type 1: Consumption-based outcomes. These are outcomes that are measured per click, per user, per megabyte. • Type 2: KPI-based outcomes. These are outcomes that are measured by achieving a target reading for a defined key performance indicator (KPI). For example, the customer satisfaction rating for a company improved by three points. The hold time for customers decreased by three minutes.
  • 3. 3 17065 Camino San Bernardo, Ste. 200 | San Diego, CA 92127 | Tel. 1.858.674.5491 | Fax. 1.858.430.3571 © Technology Services Industry Association | www.tsia.com • Type 3: Financial-based outcomes. These are outcomes measured in dollars. The customer saved $500,000. Average spend per website visitor increased $40. Figure 2: Outcome Types, provides a graphical view of these three categories. There are clear industry examples of offers in each of these three categories. From Rackspace’s Type 1 consumption- based hosting model to the Type 3 revenue sharing model that Redflex puts in place with cities that purchase the Redlfex red-light camera technology. Figure 2: Outcome Types With this simple taxonomy in place, we now know there are three distinct types of outcomes a technology provider can attempt to deliver to a customer. Clearly understanding what class of outcome is in play is a significant first step in the journey toward outcome-based pricing. The second step is understanding the difference between revenue streams, offer types, pricing models, and pricing mechanisms. REVENUE STREAMS, OFFER TYPES, PRICING MODELS, AND PRICING MECHANISMS To set up strategies for outcome-based pricing, it is helpful to separate four distinct concepts: 1. Revenue Streams. The distinct ways that technology companies make money. 2. Offer Types. The distinct types of service offers a company may have. 3. Pricing Models. The model a company uses to set the price of a specific service offer. 4. Pricing Mechanism. The way the company charges the customer for a service offering.
  • 4. 4 17065 Camino San Bernardo, Ste. 200 | San Diego, CA 92127 | Tel. 1.858.674.5491 | Fax. 1.858.430.3571 © Technology Services Industry Association | www.tsia.com Five Revenue Streams A technology company has five distinct ways it can monetize with a customer: 1. Product. Customer pays for a technology asset. For example, the customer pays for hardware or pays for a software license. 2. Subscription (Technology). The customer pays to access technology. SaaS and hosted storage are examples of paying for access to technology that the customer never owns outright. 3. Annuity Services. The customer signs an annual or multiyear contract for services from the technology company. Traditional support service contracts fall into this category as well as managed service contracts designed to assist a customer in their IT operations. 4. Project Services. The customer signs a contract for specific deliverables from the technology company to be delivered within a project plan that has a beginning, an end, and milestone deliverables in between. PS implementation projects are the classic example here. 5. Transactions. Last but not least, a technology company may have a revenue stream that is transactional based. This means every time a certain activity occurs, the customer is charged. Examples would include charging the customer per invoice issued or user added. Historically, product companies have weighted their revenue streams in three of the five categories: Product, Annuity Services, and Project Services. Figure 3 shows the most common revenue mixes that existed within product companies pre-cloud era. Figure 3: Common Revenue Mixes for Product Companies
  • 5. 5 17065 Camino San Bernardo, Ste. 200 | San Diego, CA 92127 | Tel. 1.858.674.5491 | Fax. 1.858.430.3571 © Technology Services Industry Association | www.tsia.com Many Offer Types Within the five revenue streams, there are many types of product and service offers a technology company may provide. TSIA has documented a B4B Offer taxonomy that identifies the following key offer categories: • Product Services. These are the traditional services technology companies have offered that are designed to implement and support a technology. These are the services weighted toward the “asset” side of the B4B spectrum. This service category includes implementation, customization, technical training, support, and many premium support offers. • Optimize Services. These are services designed to help customers optimize their use of technology capabilities. There are three distinct types of optimize services TSIA believes product companies will provide to customers: o Operational Services. These are services designed to reduce operational complexity for customers. They include capacity planning, remote monitoring, risk audits, and system administration. The main objective of these services is to minimize the cost of operating a technology. o Adoption Services. These are services designed to help customers maximize their usage of technical capabilities. Unlike traditional education services, these services involve usage analytics, user adoption reports, and intelligent feature provisioning. The main objective of these services is to maximize technology adoption. o Information Services. These are services designed to help  customers maintain the integrity of their own customer and business data and accelerate business insights from their own data. The main objective of these services is to improve the customer’s ability to leverage their own data or leverage industry data that has been aggregated by the technology provider. • Outcome as a Service. These are not the historical “bundles” created by product companies where service offerings are wrapped around a product and sold to the customer at some bundled price. These are offerings where a provider bundles the products and services required to guarantee a target business outcome for the customer. In other words, the provider is masking any complexity from the customer and simply committing to deliver a specific outcome for the customer. A simple real-world example of this service category would be how red-light camera technology is sold to cities throughout the country. Cities do not pay for the cameras or the installation of the cameras. The vendor is given a percentage of each ticket (the outcome) issued from the cameras. Figure 4: The B4B Services Portfolio documents these service categories and offer types within the categories.
  • 6. 6 17065 Camino San Bernardo, Ste. 200 | San Diego, CA 92127 | Tel. 1.858.674.5491 | Fax. 1.858.430.3571 © Technology Services Industry Association | www.tsia.com Figure 4: B4B Services Portfolio Some of these offer types are not commonly found in the marketplace. Yet, technology companies are already migrating their services into these categories. Software giant Oracle offers Advanced Customer Services designed to monitor systems and reduce operational complexity. SaaS provider salesforce.com has a set of Premier Success services that are designed to monitor usage and help customers accelerate adoption. Siemens offers workflow optimization services for laboratories using Siemens equipment. LivePerson offers an outcome-based managed service designed to improve agent productivity in call centers. The revenue from every offer type described in Figure 4 will fit into one of the five service revenue streams outlined in the previous section. In other words, these offers will appear as product revenues, subscription revenues, annuity service revenues, project revenues, or transaction revenues. So different offers drive different types of revenues in the economic engine of the company. Now, the question arises: What model should the company use to price these service offers?
  • 7. 7 17065 Camino San Bernardo, Ste. 200 | San Diego, CA 92127 | Tel. 1.858.674.5491 | Fax. 1.858.430.3571 © Technology Services Industry Association | www.tsia.com Three Pricing Models Every service offer is priced using one of three fundamental models: • Cost Plus. In this pricing model, a company first determines the cost to deliver the offer. Then, the company layers a target margin on top of those costs. This then determines the list price for the offer. • Market Based. In this pricing model, the company first determines what the market is currently bearing for similar offers. The company then determines what margin is acceptable on the offer to support the company’s financial objectives. Finally, the company determines if it can deliver the offer within a cost footprint that will achieve the desired margin at the current market price point. • Value Based. In this pricing model, the company first calculates the specific business value the offer should deliver to the customer. Next, the company determines the costs that will be required to deliver that value. Finally, the company sets a price for the offer that lives somewhere between the value line and the cost line. Ideally, in value-based pricing, there is plenty of room between the value line and the cost line that allows a company to set a price that easily meets or exceeds margin targets. For more content on these three pricing models, refer to a TSIA paper titled “The Pricing Pentagon.” TSIA has been studying service pricing models for years. There is no doubt that, historically, the vast majority of service offers from technology companies have been priced using the cost-plus model. True value-based pricing has been a rarity. TSIA predicts that emerging Level 3 and Level 4 service portfolios will require technology companies to frequently apply both market-based and value-based pricing models. This will not be an easy transition for the industry, as the SQS case study documented below attests. However, there is one more component of the pricing discussion that needs to be defined before we can review the SQS experience. As technology companies migrate away from traditional offers with known pricing models, TSIA predicts there will be four distinct pricing quadrants that will emerge for technology offers. These four quadrants will be defined by two questions: 1. Structured service: Is this an offer that is custom for each customer, or is this an offer that is well defined and repeatable from customer to customer? 2. Unique value proposition: Has our company created and defined a unique value proposition related to this offer? How you answer those two questions will determine which pricing model will be sustainable: Cost based, market based, or value based. Figure 5 documents these pricing quadrants. Figure 6 maps different offers to recommended pricing models.
  • 8. 8 17065 Camino San Bernardo, Ste. 200 | San Diego, CA 92127 | Tel. 1.858.674.5491 | Fax. 1.858.430.3571 © Technology Services Industry Association | www.tsia.com Figure 5: Pricing Quadrants Figure 6: Mapping Offer to Pricing Models
  • 9. 9 17065 Camino San Bernardo, Ste. 200 | San Diego, CA 92127 | Tel. 1.858.674.5491 | Fax. 1.858.430.3571 © Technology Services Industry Association | www.tsia.com FIVE PRICING MECHANISMS So far we have defined three critical components related to pricing service offers: • The type of revenue stream the offer represents. • The type of offer being priced: o There are three distinct types of outcome offers. • The pricing model being used to set the initial price of the offer: o Is the offer unique or similar from customer to customer? o Have we defined a unique value proposition for the offer? The final component to understand is the pricing mechanism. In fact, when most people think about pricing strategy, they are really thinking about pricing mechanisms. The pricing mechanism is how the customer is actually charged for an offer. In the world of technology services, there are five common pricing mechanisms: • Percentage of “Other.” In this approach, the amount a customer is charged for an offer is a percentage of what the customer paid for another item. This is the classic approach for how customers are charged for software support (18% to 21% of the software license price). • Time and Materials (T&M). Customers are charged for the actual effort of specific resources. This is typically presented to the customer in hourly or daily rates. • Fixed Price. Customers are charged a fixed price for a service offer. In this scenario, there are usually specific milestones or deliverables that must be achieved to receive payment. This pricing mechanism could be applied to offers that are designed to deliver Type 2 and Type 3 outcomes. • Outcome Volume. The customer is charged based on the volume of a specified activity. For example, the customer is charged for every add, move, or change processed for the customer. This is transaction-related volume. Another example is the customer being charged for additional storage they are consuming in a hosted storage solution. This is consumption- based volume. This is the common pricing mechanism for offers designed to deliver a Type 1 outcome. Both transaction volume and consumption volume are classic Type 1 outcomes. • Percentage of Outcome. The customer is charged a percentage of the value they achieved from the offer. For example, a customer may be charged 10% of all the total savings experienced because a service offer was executed. This is often referred to as gain sharing. This pricing mechanism could be used for offers delivering Type B or Type C outcomes.
  • 10. 10 17065 Camino San Bernardo, Ste. 200 | San Diego, CA 92127 | Tel. 1.858.674.5491 | Fax. 1.858.430.3571 © Technology Services Industry Association | www.tsia.com Just as the technology industry has relied heavily on cost-plus pricing models, the industry has relied heavily on three pricing mechanisms: • Percent of Other • Time and Materials • Fixed Price The shift toward outcomes is forcing companies off of these three pricing mechanisms. Also, TSIA is seeing the emergence of complex managed service contracts and premium support contracts that may employ multiple pricing mechanisms within one annuity service contract. Now, how should a company approach these dramatic changes in pricing? That is the topic of the next section. PRICING PROCESS Why did we go through all of this effort to define the concepts of outcome types, revenue streams, offer types, pricing models, and pricing mechanisms? Because these concepts will help accelerate your outcome-based pricing strategy. As companies brainstorm new outcome-based service offerings, TSIA recommends the following process: 1. Identify the type of revenue the offer will generate. Annuity service revenues? Project service revenues? 2. Identify the offer type. Optimize offer? Information service? Outcome as a service? 3. If this is an outcome-based offer, identify what type of outcome the company is committing to deliver. Type 1, Type 2, or Type 3? 4. Determine the pricing model that will be used to establish the target price for the offer. Cost- plus, market-based, or value-based pricing? 5. Finally, determine what pricing model makes sense for this offer. Fixed price? Volume? Percentage of outcome? We can easily apply the five-step process to legacy service offers. Table 1 itemizes three common offers and how they are structured using this model.
  • 11. 11 17065 Camino San Bernardo, Ste. 200 | San Diego, CA 92127 | Tel. 1.858.674.5491 | Fax. 1.858.430.3571 © Technology Services Industry Association | www.tsia.com Table 1: Traditional Offers   Revenue Stream Offer Type Outcome Type Pricing Model Pricing Mechanism Annuity Service Standard Support Service Not Applicable Market Based % of Other Project Service PS Implementation Project Not Applicable Cost Plus Fixed Price Annuity Service Managed Service Not Applicable Cost Plus Fixed Price Now, what if your company is considering a new offer where the customer only pays if they achieve specific outcomes? Table 2 outlines the parameters of some potential outcome-based offers. Table 2: Outcome Offers Revenue Stream Offer Type Outcome Type Pricing Model Pricing Mechanism Annuity Service Premium Support Offering That Minimizes System Downtime Due to Security Risks Type 2 Outcome (KPI Improvement) Value Based % Reduction in downtime Transaction Managed Service for System Admin Type 1 Outcome (Consumption) Cost Plus % of Volume (Transaction Fee for Every Add/ Move/Change) Project Service Professional Services Project That Results in Specific Cost Savings for Customer Type 3 Outcome (Financial Impact) Value Based % of Outcome
  • 12. 12 17065 Camino San Bernardo, Ste. 200 | San Diego, CA 92127 | Tel. 1.858.674.5491 | Fax. 1.858.430.3571 © Technology Services Industry Association | www.tsia.com By using this approach to document the key attributes of a new outcome-based offer, a management team can align its understanding of the offer. Also, the management team can use the model to test the assumptions of the offer’s attributes with other key stakeholders. The approach minimizes critical misunderstandings that could exist regarding exactly what the new outcome offer represents. Finally, once the attributes are documented, the company can roll up its sleeves to work on the specific organization capabilities and data streams that will be required to execute the offer. CHALLENGES Technology companies are quickly being forced to enhance their organizational capabilities related to pricing offers. This will not be a quick or painless journey. Specifically, as technology companies attempt to define new outcome offerings, they are encountering a common set of challenges: • Specific costs to deliver the outcome. How much will it cost our company to make sure the customer achieves the target outcome? • Predicting volume. For volume-based transaction revenue streams, how do we predict the transaction volume? The volume clearly influences how much we want to charge per transaction. • Predicting impact. Can we accurately predict the financial benefits the customer will receive if they purchase the offer? • Understanding success science. Do we understand what the customer must do in order to achieve the targeted outcome? What processes will they need to improve that are not our direct responsibility? • Pricing model. What pricing model is sustainable for outcome offers? Cost plus is probably not the answer, but we have little experience drawing the value line. None of these are insignificant challenges. In general, management teams will have little or zero experience with outcome-based pricing when they first embark on this journey. For this reason, TSIA strongly recommends the following tactics: 1. Introduce a clear framework for pricing offers. 2. Clarify the taxonomy surrounding pricing. 3. Start by documenting a pricing table for new Level 3 and Level 4 offers. 4. Leverage the lessons being learned by peers in the industry. The next section of this paper documents the story of SQS as they migrated from a traditional time- and-materials, project-based service offering to an outcome-based offering.
  • 13. 13 17065 Camino San Bernardo, Ste. 200 | San Diego, CA 92127 | Tel. 1.858.674.5491 | Fax. 1.858.430.3571 © Technology Services Industry Association | www.tsia.com CASE STUDY: SQS Company Profile SQS is a leading specialist in software quality and offers a range of services: • Software testing for projects. • Improving development quality in IT projects. • Requirements verification. • Specialized consultant services. • Managed services for software systems in operation and maintenance. SQS has more than 3,500 employees located in 18 countries. The company generates revenues exceeding $270 million. Riccardo Brizzi, the COO of the company, makes this following observation concerning SQS: “We take pride in the fact that SQS is a highly rated testing services provider that is engaged in some of the most challenging and critical business software change initiatives on the globe.” However, the testing services marketplace is highly competitive—even for a differentiated brand like SQS. This is a case study on how SQS took the plunge from traditional service pricing models to an outcome-based pricing model. Legacy Service Offer Historically, independent software testing services were offered in a classic time-and-materials model. Companies would contract SQS to rigorously test new software. The total cost of the service was based on the effort required. SQS, like the majority of service providers, had a cost-plus pricing model. A rate for testing resources was created based on the cost of those resources. Table 3 provides the parameters of the legacy offer at SQS. Table 3: SQS Legacy Offer Parameters Revenue Stream Outcome Type Offer Type Pricing Model Pricing Mechanism Project Service Not Applicable Testing Service Cost Plus T&M Catalyst for Change The challenge faced by SQS is the challenge being faced by many service providers today: the rate customers were willing to pay for technical resources was under pressure. Testing had become a
  • 14. 14 17065 Camino San Bernardo, Ste. 200 | San Diego, CA 92127 | Tel. 1.858.674.5491 | Fax. 1.858.430.3571 © Technology Services Industry Association | www.tsia.com globally resourced activity. This globalization led to intense pricing pressure. Customers expected the cost of testing resources to decrease. SQS soon found itself in price wars that were leading to thinner and thinner contract margins. The management team was frustrated. They knew SQS brought much more to the table than just technically competent testers. SQS had over a decade of experience optimizing testing strategies and procedures. How could the company better leverage this deep expertise in the marketplace? Outcome Offers In October of 2010, the SQS management team decided to initiate a move toward Managed Testing Services. The company defined the service as follows: “Managed Testing Services are the provision of test activities by SQS to a Client, where SQS undertakes the end-to-end responsibility for the delivery and management of the relevant test services and solutions.” The SQS management team felt customers would be attracted to the service for the following reasons: • SQS would take responsibility to mitigate impact of delays/issues in test delivery. • SQS would be measured on delivery rather than effort. • The customer contract would mandate accountability by SQS for additional cost reductions through service optimization over the lifespan of the contract. The management team envisioned an outcome-based service offering with the following attributes: • Type 1 Outcome Offer Type. Customers only pay if they consume a specific outcome. In this case, if bugs are identified • Annuity Revenue Stream. Customers would establish multi-project, multiyear relationships with SQS. • Value-Based Pricing Model. SQS had to determine and articulate the business value of a bug identified in the testing process. • Outcome Volume Pricing Mechanism. Customers would only pay for bugs actually identified by SQS. Table 4 summarizes the parameters of the new offer.
  • 15. 15 17065 Camino San Bernardo, Ste. 200 | San Diego, CA 92127 | Tel. 1.858.674.5491 | Fax. 1.858.430.3571 © Technology Services Industry Association | www.tsia.com Table 4   Revenue Stream Offer Type Outcome Type Pricing Model Pricing Mechanism Annuity Service Managed Testing Service Type 1 (Consumption) Value Based Outcome Volume Of course, envisioning a new outcome-based offer and executing a new outcome-based offer are two completely different milestones. The SQS team engaged with several customers before crafting an approach that met the customer’s business needs and was profitable to SQS. Key Lessons Learned Riccardo Brizzi, the COO of the company, was intimately involved, together with the SQS leadership, in the process of launching this new service. Mr. Brizzi has many insights regarding the challenges of pivoting to an outcome-based offer. Here are a few of his key insights related to the following topics: Initial Pricing: Setting the Initial Price/Contract Structure The biggest challenge with outcome-based pricing is to define a price acceptable to the client and profitable to SQS. Typically this cannot be done without a deep understanding of the client environment. While for the client the pricing is outcome based, for SQS we still needed a thorough understanding of the effort required to get to the point of, in these cases, an almost fully automated regression testing situation. The steps required to get to this point require a close collaboration with the client, and the client needs to be educated in the process of how to arrive at the point where both sides benefit. There is no quick fix. The key lesson learned here was partner with clients who have the maturity to migrate to this kind of offer—clients who see the benefits of the long-term relationship (since the up-front costs are not always immediately lower than current costs, you need a long-term contract to realize the value). Obviously showing the clients wins along the path to this contractual arrangement is key to keeping them interested and confident in the process. Proof of concepts and contracts where prices drop year-on-year are useful ways of showing these wins. Another concept we adopted in the initial pricing models was to differentiate between pricing and billing. The price was determined on the basis of requirements (output of a previous step/activity) as a price per requirement. However, our billing was based on the actual test cases executed. This was important to our clients, as typically the number of requirements can vary considerably leading up to the implementation freeze. This gave our clients the confidence that only functionality that was actually implemented was tested, and only that testing was paid for.
  • 16. 16 17065 Camino San Bernardo, Ste. 200 | San Diego, CA 92127 | Tel. 1.858.674.5491 | Fax. 1.858.430.3571 © Technology Services Industry Association | www.tsia.com Selling Outcomes: Changing the Sales Pitch. Different Buyer? Selling managed services is all about selling long-term value. And for a client, it is about entrusting a piece of their business to a trusted partner. The people inside a client organization typically used to buying services are often either threatened by the managed service process or are not interested, as they have short-term goals to meet. What is needed in these situations is a C-level relationship with someone who understands the longer-term value of these contracts and who buys into the process for setting them up. Clearly, these executives have little time, and so the sales pitch has to be value based, solve a defined problem, and have interim value milestones to keep any detractors at bay during the process. Contract Structure The contract has to reflect the journey that both the client and the supplier need to go through. This is about partnership, shared risk, and clear roles and responsibilities. The end state must be clear, as must be the interim milestones. To automate testing, for example, there are strong prerequisites for a stable development and operating environment. The client’s applications strategy must be defined, and the requirements-gathering process time must be boxed. Without these prerequisites, arriving at an outcome-based or consumption-based operating model is not possible, as too many variables can impact either the cost of the service, which is bad for the supplier, or the value of the output, which is bad for the client. Piloting An effective way of embarking on the journey is through pilots or proof of concepts. In our case, we often, at our own cost or a reduced cost, take a subset of the work that needs to be done and run a pilot or POC. For example, automating a small number of test cases to show that this can be an effective quick win—even if done on a T&M basis. This gives the client confidence, and potentially shows the value that can be delivered (and then used to fund the transition to a fully fledged output or consumption-based model). Choosing the Right Customers Client maturity is a key factor in selling managed service deals and eventually moving toward outcome-based pricing. The role of the client changes significantly from delivering a service to the organization, to managing SLA-based delivery through a third party. The client no longer needs deeply technical people, but rather contract managers with an understanding of what is required from both sides to make the contract work. Without these strong managers, the risk of failure is great, and the temptation to bring the service back in-house or revert to a typical T&M body-shopping model is strong. Getting away from the clichés of “not invented here,” “this is how we have always done it,” “too risky to give this to a partner,” and “we need to maintain ownership to maintain control” all have to be overcome.
  • 17. 17 17065 Camino San Bernardo, Ste. 200 | San Diego, CA 92127 | Tel. 1.858.674.5491 | Fax. 1.858.430.3571 © Technology Services Industry Association | www.tsia.com Fortunately, choosing the right customers has a snowball effect. Clients want to hear success stories, and if someone else has gone through the pain of learning how to do it and has been successful, it reassures them. Financial Results The most amazing aspect of the SQS story is how the company successfully experimented with new outcome-based offerings without negatively impacting the overall performance of the company. Figure 7 shows the stock price of SQS during the time period the outcome offers were piloted (January 2013 to March 2014). Figure 7: Stock Price of SQS During Outcome Offers Pilot (January 2014 to March 2014) Figure 8 documents some of the key financial metrics related to these new managed services. Figure 8: Managed Services Key Financial Metrics
  • 18. 18 17065 Camino San Bernardo, Ste. 200 | San Diego, CA 92127 | Tel. 1.858.674.5491 | Fax. 1.858.430.3571 © Technology Services Industry Association | www.tsia.com Finally, it is important to observe that SQS actually reduced the number of clients during this period. As highlighted above, not all clients were well suited to the new outcome-based pricing models. However, as documented in Figure 9, the average revenue per client increased dramatically. Figure 9: Average Revenue per Client SUMMARY: SUCCESS TACTICS FOR OUTCOME-BASED PRICING Taking the plunge into outcome-based pricing will not be like entering a nice warm bath. This experience will feel more like jumping from a cliff into churning ocean waters. To swim safely to a shore of profitable outcome-based pricing, TSIA recommends members pursue the following success tactics: • Document the pricing strategy parameters. The first step in this journey is to align key internal stakeholders regarding the nature of a new outcome-based offering. Discuss, debate, and document offer type, revenue stream, pricing model, pricing mechanism, and target outcome type. • Identify key data gaps. To commit to outcomes, you will most likely need specific data streams. They may come from your product; they may come from the customer. What are the data streams you will need to consistently deliver the outcome? • Pilot with customers to understand volume and success science. As the SQS case study demonstrates, you will likely need to learn as you go with new outcome offers. Identify customers that want to partner on this journey. Structure initial contracts so there are clear milestones where pricing can be revisited. Also, avoid long-term contracts until it is clear you can profitably deliver an outcome-based offering.
  • 19. 19 17065 Camino San Bernardo, Ste. 200 | San Diego, CA 92127 | Tel. 1.858.674.5491 | Fax. 1.858.430.3571 © Technology Services Industry Association | www.tsia.com • Establish two-way SLAs with customers. It is very unlikely you will be able to generate specific outcomes for the customer without their engagement. During pilots, identify what is required from the customer. Codify those requirements in the SLAs that the customer must meet in order for the outcome pricing to be valid. • Wind down unprofitable outcome-based customers. As SQS learned, not all customers are well suited for outcome-based offers. Create clear criteria for selecting customers, and create clear criteria for evaluating which outcome-based contracts should be terminated. • Can’t be easy to say no. Once again, this is a plunge. Many internal stakeholders will have many reasons for why this is too risky or too hard to attempt. However, think of the risk involved if a competitor masters this model before you do. If you were providing testing services on an hourly basis, would you want to compete against SQS’s outcome-based model? If key stakeholders raise concerns, they should be responsible for finding ways to mitigate the risks they have identified. The migration to outcome-based pricing will take time. For this reason, TSIA recommends organizations begin the journey today. 1 Wood, J.B., Todd Hewlin, and Thomas Lah. 2013. B4B: How Technology and Big Data Are Reinventing the Customer-Supplier Relationship. San Diego, CA: Point B, Inc.