Samir rafla lecture of Electrophysiology- part one-Catheter ablation of cardiac arrhythmias
•
2 recomendaciones•588 vistas

1) Radiofrequency energy induces thermal lesions in cardiac tissue through resistive heating. Tissue temperatures above 50°C are required for irreversible injury. Lesion size increases with power, temperature, electrode size, and contact pressure. 2) Three-dimensional mapping systems and intracardiac echocardiography help locate arrhythmia origins and guide ablation, such as for crista terminalis tachycardias. 3) Intracardiac echocardiography assists with visualizing anatomy, ensuring electrode contact, monitoring lesion formation, and identifying complications of ablation procedures.

Recomendados
Recomendados
Más contenido relacionado
La actualidad más candente
La actualidad más candente (20)
Destacado
Destacado (20)
Similar a Samir rafla lecture of Electrophysiology- part one-Catheter ablation of cardiac arrhythmias
Similar a Samir rafla lecture of Electrophysiology- part one-Catheter ablation of cardiac arrhythmias (20)
Más de Alexandria University, Egypt
Más de Alexandria University, Egypt (20)
Último
Último (20)
Samir rafla lecture of Electrophysiology- part one-Catheter ablation of cardiac arrhythmias
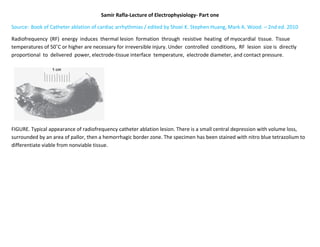
- 1. Samir Rafla-Lecture of Electrophysiology- Part one Source: Book of Catheter ablation of cardiac arrhythmias / edited by Shoei K. Stephen Huang, Mark A. Wood. – 2nd ed. 2010 Radiofrequency (RF) energy induces thermal lesion formation through resistive heating of myocardial tissue. Tissue temperatures of 50˚C or higher are necessary for irreversible injury. Under controlled conditions, RF lesion size is directly proportional to delivered power, electrode-tissue interface temperature, electrode diameter, and contact pressure. FIGURE. Typical appearance of radiofrequency catheter ablation lesion. There is a small central depression with volume loss, surrounded by an area of pallor, then a hemorrhagic border zone. The specimen has been stained with nitro blue tetrazolium to differentiate viable from nonviable tissue.
- 2. Cardiac Anatomy for Catheter Mapping and Ablation of Arrhythmias
- 3. FIGURE 6-3. A,A 12-lead echocardiogram (ECG) from a patient with Wolff-Parkinson-White syndrome due to an inferior paraseptal accessory pathway. B,Leads III and V6 from the surface ECG are simultaneously displayed with bipolar intracardiac recording from the high right atrium (HRA), and bipolar and unipolar recordings from the probing electrode (PE) at the site of ablation of the accessory pathway. In the filtered bipolar recording from the distal pair of electrodes of the ablation catheter (PE 2-1), a fast deflection preceding the onset of the delta wave was registered that most likely represents the so-called accessory pathway potential (APP). This potential was also present at the near-DC (0.1 to 500 Hz) unfiltered unipolar recording from the
- 4. distal ablating electrode (PE 1) and the filtered (30 to 500 Hz) distal unipolar recording (PE 1F). C,Left anterior oblique (LAO) fluorographic projection showing the ablation catheter at the site of block of the accessory pathway during the application of the radiofrequency current. A coronary sinus venogram has also been obtained, which retrogradely fills a diverticular formation in the middle cardiac vein. D,Venous phase of a left coronary artery angiography depicting the coronary sinus diverticulum and an inferior left ventricular venous branch ending at the neck of the diverticulum. This was the site of ablation of the accessory pathway. E,Anatomic slice in an LAO projection showing the entry into the coronary sinus and the middle cardiac vein as well as the ending of an inferior left ventricular venous affluent (red arrow). FIGURE 6-15. Ablation of an inferior paraseptal accessory pathway within the mid-cardiac vein (MCV). A, The accessory pathway is blocked 1016 msec after the onset of the application of radiofrequency current (RF). B,Right anterior oblique (RAO) and left
- 5. anterior oblique (LAO) fluorographic images displaying the position of the ablation catheter (RF). The injection of contrast in the RAO projection enables one to determine that the ablation catheter is outside the outlines of the right atrium as defined by the angiographic contrast. This is indeed true because the catheter is inside the mid-cardiac vein. C,RAO and LAO slice of the heart. The MCV drains in the proximal coronary sinus (CS) running an inferior course before bending anteriorly along the epicardial surface of the muscular ventricular septum (MVS). Ao, aorta; LA, left atrium; RA, right atrium; RVA, right ventricular apex; RVOT, right ventricular outflow tract. Fundamentals of Intracardiac Mapping Activation Sequence Mapping Endocardial Mapping Techniques FIGURE 7-8.Late potential mapping in the right ventricle. In a patient with arrhythmogenic right ventricular (RV) dysplasia, many of the electrograms were abnormal, especially at the RV inflow, the RV apex, and the RV outflow tract. The figure shows late potentials during sinus rhythm in the region of the RV apex on the ablation (ABL) catheter (arrows). HRA, high right atrium. Pace Mapping Entrainment Mapping
- 6. FIGURE 7-14. Progressive fusion with demonstration of (manifest) entrainment. The figure shows activation around the tricuspid annulus during attempted entrainment of what appeared to be typical, counterclockwise atrial flutter in a patient with a normal heart. Advanced Catheter Three-Dimensional Mapping Systems (Carto Advanced Mapping System)
- 8. FIGURE 8-4. Carto activation map of focal ventricular tachycardia is shown. The earliest activation site (shown in red) is surrounded by the later activation. 10 Role of Intracardiac Echocardiography in Clinical Electrophysiology 11 Ablation of Focal Atrial Tachycardias The mechanism of focal atrial tachycardia (AT) can be automatic, triggered, or reentry. The P-wave morphology on a 12-lead electrocardiogram gives a general idea of the site of origin of the focal AT. Mapping techniques include determining the earliest atrial activation during tachycardia and pace mapping of the P-wave morphology. Ablation targets comprise abnormal atrial tissue from which the tachycardia originates, as identified by the site of earliest atrial activation and abnormal local atrial electrograms. Three-dimensional mapping systems are often useful, and intracardiac echocardiography can be helpful, especially for crista terminalis tachycardias. Difficulty arises when the tachycardia is not inducible or is not sustained.
- 9. Troubleshooting difficult cases includes the unusual location of the tachycardia focus arising from the coronary sinus, superior or inferior vena cava, ligament of Marshall, appendages, or aortic cusps. Mapping of the left atrium and pulmonary veins is often needed when a leftsided tachycardia is suspected. 10 Role of Intracardiac Echocardiography in Clinical Electrophysiology CartoSound three-dimensional reconstruction of the images obtained by intracardiac echocardiography (ICE) and integration with electroanatomic mapping system helps to identify atrial endocardial structures and to characterize the role of anatomy in arrhythmia mechanism (e.g., crista terminalis, pulmonary veins). For guidance of radiofrequency (RF) ablation, ICE is used to identify the anatomic location of the catheter tip and to ensure tissue contact (distal tip electrode or linear ablation catheter). For monitoring RF lesions, ICE is used for real-time assessment of lesion formation and size (mural swelling and increased tissue echodensity). For AF ablation, ICE assists with transseptal puncture, defines pulmonary vein (PV) anatomy, allows accurate positioning of the lasso catheter at the PV ostium, monitors lesion formation, monitors for complications (e.g., tamponade, thrombus, atrioesophageal fistula), and identifies and possibly predict PV stenosis. Other uses of ICE include atrial flutter ablation (imaging cavotricuspid isthmus anatomy), ventricular tachycardia (imaging scar border, identifying coronary cusps and left ventricular outflow tract), guidance of transseptal puncture in difficult cases, assessment of left atrial and appendage mechanical function and thrombus, and guidance of atrial septal defect device closure.
- 10. FIGURE 10-14. A,Two-dimensional view of the left side of the heart with the intracardiac echocardiography catheter positioned in the right atrium (RA). The imaging frequency was 7.5 MHz. Visible are the interatrial septum (IAS), left atrium (LA), proximal coronary sinus in cross section (CS), mitral valve (MiV), left ventricle (LV), and left atrial appendage (LAA).