2. ii
Abstract
This thesis is an investigation of the urban agriculture movements in Vancouver, British
Columbia, and Detroit, Michigan. I use both quantitative and qualitative methods and an urban
political ecology theoretical framework to unpack how urban agriculture fits within the
foodscapes of these two cities. My quantitative method draws on recent critique of food desert
studies, avoiding an epidemiological method that seeks to statistically measure health
outcomes in favor of an ecological approach with social inequalities as the primary focus of
inquiry. Through the use of cluster analysis, multidimensional scaling, and local indicators of
spatial association, I conclude that foodscape composition and the location of urban agriculture
is influenced by the housing and land markets, income inequality, and racial segregation.
Drawing on interviews conducted in both cities, in my qualitative section I seek to understand
how urban agriculture is seen as a sustainable solution to the very different problems faced by
these two cities. I argue that urban agriculture has an ambivalent relationship to neoliberalism:
it emerged largely as a Polanyian counter-movement to urbanized inequalities, but has more
recently been enrolled as a device by the local state through which sustainability planning is
seen to enhance economic competitiveness. Finally, I present vignettes of individual farms and
gardens that show the political potential of urban agriculture to be closely linked to theories of
political change and socionatural metabolic rifts.
3. iii
Preface
This thesis is an original, unpublished, independent work by the author, Samuel Walker.
The fieldwork and interviews for this thesis took place in Detroit, Michigan from July 3 to July
14, 2012, and in Vancouver, British Columbia from January 9 to February 21, 2013. Approval for
the interviews was granted through the University of British Columbia Behavioral Research
Ethics Board, Ethics Certificate Number H12-01096, titled “Detroit and Vancouver Urban
Agriculture.” The research was funded by the University of British Columbia through the
Graduate Support Initiative Award and the Department of Geography. Figure 18 in this thesis is
reprinted with written permission from the City of Vancouver.
4. iv
Table of Contents
Abstract............................................................................................................................................ii
Preface............................................................................................................................................iii
Table of Contents ...........................................................................................................................iv
List of Tables.................................................................................................................................viii
List of Figures..................................................................................................................................ix
List of Abbreviations ......................................................................................................................xi
Acknowledgements......................................................................................................................xiv
Introduction.................................................................................................................................... 1
Vancouver and Detroit................................................................................................................ 1
Research goals ............................................................................................................................ 5
Chapter summaries..................................................................................................................... 8
Chapter 1: Quantifying the Urban Foodscape............................................................................. 11
Proximity = access: the food desert approach ......................................................................... 12
My method................................................................................................................................ 17
Data sources.......................................................................................................................... 19
Building the food source dataset.......................................................................................... 24
The final food source dataset ............................................................................................... 35
Conclusion................................................................................................................................. 35
Chapter 2: The Urban Foodscapes of Vancouver and Detroit.................................................... 38
Cluster analysis ......................................................................................................................... 38
Vancouver............................................................................................................................. 40
5. v
Detroit................................................................................................................................... 50
Both cities ............................................................................................................................. 58
Multidimensional scaling.......................................................................................................... 62
Local indicators of spatial association using foodscape data................................................... 69
Vancouver............................................................................................................................. 71
Detroit................................................................................................................................... 74
Discussion and conclusion ........................................................................................................ 76
Chapter 3: Interlude..................................................................................................................... 80
Chapter 4: Urban Agriculture and the Local Sustainability Fix................................................... 85
Theorizing urban agriculture..................................................................................................... 87
(Urban, critical) political ecology .......................................................................................... 87
Circulation and metabolism.................................................................................................. 89
The urban sustainability fix................................................................................................... 92
The radical/neoliberal Janus face ......................................................................................... 95
Vancouver: harvesting ecotopia............................................................................................... 96
A brief history of agriculture in the Lower Mainland ........................................................... 97
Growing food in the City of Glass ....................................................................................... 101
The Vancouver City government and urban agriculture .................................................... 107
The Greenest City? Vancouverism’s sustainability fix ........................................................ 111
Detroit: from (urban) prairie to ‘Innovation Productive’ ....................................................... 117
A brief history of agriculture in southeast Michigan .......................................................... 117
The Motor City’s agricultural production line .................................................................... 121
6. vi
The Detroit City government and urban agriculture.......................................................... 128
Detroit Green City: austerity’s sustainability fix................................................................. 139
Discussion and conclusion ...................................................................................................... 148
Chapter 5: Metabolic Rifts, Theories of Change, and Urban Agriculture................................. 151
Vancouver vignettes ............................................................................................................... 154
Sole Food Street Farms....................................................................................................... 154
Shifting Growth................................................................................................................... 160
Alterrus Systems Inc.’s My Local Garden............................................................................ 164
The Purple Thistle Centre youth urban agriculture............................................................ 167
Detroit vignettes..................................................................................................................... 171
Midtown Detroit, Inc. and the North Cass Community Garden......................................... 171
Hantz Farms/Woodlands .................................................................................................... 178
Lafayette Greens................................................................................................................. 179
D-Town Farm....................................................................................................................... 183
Discussion and conclusion ...................................................................................................... 185
Conclusion .................................................................................................................................. 187
Thesis synopsis........................................................................................................................ 187
Limitations of the research..................................................................................................... 191
Future research....................................................................................................................... 192
Growing ideology: reflections................................................................................................. 194
Bibliography................................................................................................................................ 197
Image Attribution....................................................................................................................... 232
7. vii
Appendix A: Category Table ...................................................................................................... 233
Appendix B: Local Indicators of Spatial Association Using Foodscape Data – Vancouver...... 235
Appendix C: Local Indicators of Spatial Association Using Foodscape Data – Detroit............ 243
Appendix D: Food Source Average Demographics – Vancouver.............................................. 249
Appendix E: Food Source Average Demographics – Detroit .................................................... 253
8. viii
List of Tables
Table 1. Selected demographics for Vancouver and Detroit.......................................................... 2
Table 2. Variables and corresponding census source................................................................... 22
Table 3. Urban agriculture definitions.......................................................................................... 28
Table 4. Alternative food source definitions ................................................................................ 29
Table 5. Final food source dataset with frequencies by type....................................................... 36
Table 6. Cluster means of demographic cluster analysis, Vancouver .......................................... 42
Table 7. Cluster means of demographic cluster analysis, Detroit ................................................ 52
Table 8. Cluster means of demographic cluster analysis, Vancouver and Detroit....................... 59
Table 9. Cluster means (z-scores) of food source type presence by population cluster analysis,
Vancouver and Detroit.................................................................................................................. 61
Table 10. Correlation matrix between MDS dimensions and food source prevalence variables
used to interpret dimensions ....................................................................................................... 65
Table 11. Vancouver food policy chronology. ............................................................................ 110
Table 12. Detroit food policy chronology ................................................................................... 129
Table 13. Urban agriculture vignettes in Vancouver and Detroit............................................... 153
Table A1. Categories used in foodscape dataset........................................................................ 233
9. ix
List of Figures
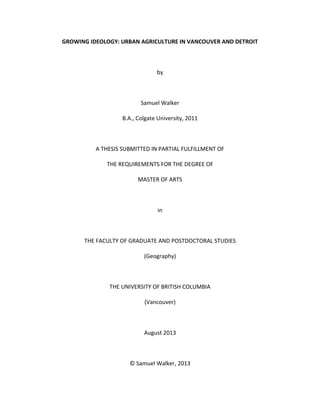
Figure 1. Populations of Vancouver and Detroit and their metropolitan (statistical) areas, 1810-
2011 ................................................................................................................................................ 3
Figure 2. Three different methods for matching food sources (circles) with census tract
centroids (stars) ............................................................................................................................ 20
Figure 3. A typical Detroit party store .......................................................................................... 33
Figure 4. A typical Vancouver produce market ............................................................................ 34
Figure 5. Cluster analysis of demographics, Vancouver ............................................................... 41
Figure 6. Cluster analysis of food source type presence by population, Vancouver ................... 46
Figure 7. Cluster analysis of urban agriculture source presence by population, Vancouver....... 49
Figure 8. Cluster analysis of demographics, Detroit..................................................................... 51
Figure 9. Cluster analysis of food source type presence by population, Detroit ......................... 54
Figure 10. Cluster analysis of urban agriculture source presence by population, Detroit........... 57
Figure 11. Cluster analysis of demographics, Vancouver and Detroit.......................................... 60
Figure 12. Cluster analysis of food source type presence by population, Vancouver and Detroit
....................................................................................................................................................... 62
Figure 13. Multidimensional scaling map of Vancouver and Detroit foodscapes by census tracts
....................................................................................................................................................... 64
Figure 14. Multidimensional scaling map of Detroit foodscape by census tracts........................ 67
Figure 15. Multidimensional scaling map of Vancouver foodscape by census tracts.................. 70
Figure 16. Food demand, local supply and gap, Lower Mainland and Metro Vancouver alone,
2006 ............................................................................................................................................ 100
Figure 17. Acres of farmland (improved or unimproved) and number of farms in British
Columbia, Canada, and Michigan, United States.. ..................................................................... 100
Figure 18. Chart from the City of Vancouver website showing the number of community
gardens in Portland, Seattle, and Vancouver ............................................................................. 116
Figure 19. Food demand, local agricultural supply and gap, Oakland, Macomb, Monroe,
Washtenaw, and Wayne counties and Wayne county alone, 2007........................................... 121
11. xi
List of Abbreviations
A&P ................................................................................The Great Atlantic & Pacific Tea Company
AAFNs................................................................................................Alternative agrifood networks
ACS ..................................................................................................... American Community Survey
AFM...................................................................................................... Alternative food movement
ALEC ....................................................................................American Legislative Exchange Council
ALR ...........................................................................................................Agricultural Land Reserve
BC ............................................................................................................................British Columbia
BMI......................................................................................................................... Body Mass Index
CAD........................................................................................................................... Canadian dollar
CAFO.................................................................................Concentrated animal feeding operations
CBD..............................................................................................................Central business district
CEO................................................................................................................Chief Executive Officer
CFS............................................................................................................Community Food Security
COPE.............................................................................................. Coalition of Progressive Electors
CSA .............................................................................................Community-supported agriculture
DAN ......................................................................................................Detroit Agriculture Network
DBCFSN ...............................................................Detroit Black Community Food Security Network
DCPC............................................................................................ Detroit City Planning Commission
DFC .......................................................................................................................Detroit Future City
DFPC.......................................................................................................Detroit Food Policy Council
DTES ......................................................................................... Downtown Eastside (of Vancouver)
12. xii
EFM ...................................................................................................Emergency Financial Manager
EMEAC........................................................................East Michigan Environmental Action Council
EYA .....................................................................................................Environmental Youth Alliance
GAAMPs ............................................Generally Accepted Agricultural and Management Practices
GDP .............................................................................................................Gross domestic product
GIS ................................................................................................ Geographic Information Systems
GRP..........................................................................................................Garden Resource Program
HFFI .............................................................................................. Healthy Food Financing Initiative
LGBTQ ..........................................................................Lesbian, Gay, Bisexual, Transgender, Queer
LISA........................................................................................ Local indicators of spatial association
MD................................................................................................................... Midtown Detroit Inc.
MDARD............................................ Michigan Department of Agriculture and Rural Development
MDS...........................................................................................................Multidimensional scaling
MI........................................................................................................................................Michigan
NASS.....................................................................................National Agricultural Statistics Service
NCCG ............................................................................................... North Cass Community Garden
NPA............................................................................................................Non-Partisan Association
PAHs............................................................................................ Polycyclic aromatic hydrocarbons
POIs ........................................................................................................................Points of interest
RTFA ...................................................................................................................... Right to Farm Act
SMC & ZAEC ........ Serecon Management Consulting & Zbeetnoff Agro-Environmental Consulting
SNAP............................................................................Supplemental Nutrition Assistance Program
13. xiii
SOLE ......................................... Save Our Living Environment or Sustainable Organic Local Ethical
SPIN................................................................................................Small plot intensive (gardening)
SRO...............................................................................................................Single room occupancy
SSI.............................................................................................................. Social Security Insurance
UA..........................................................................................................................Urban agriculture
UBC.................................................................................................... University of British Columbia
US .................................................................................................................................United States
USD.................................................................................................................... United States dollar
USDA ................................................................................United States Department of Agriculture
YEA ............................................................................................................Young Educators Alliance
14. xiv
Acknowledgements
This research could not have happened without the help and advice of numerous
people. First, I would like to thank my interviewees for their willingness to share. Without their
insight, this thesis would not have been possible. I am also grateful for the warm reception I
received in Detroit at the Reimagining Detroit 2012 conference and elsewhere from Tawana
Petty, Shea Howell, Kim Sherobbi, Rich Feldman, Yusef Shakur, Christina Peltier, and Hostel
Detroit. I would also like to recognize the fact that the land inhabited by myself, the institution
supporting my studies, and the sites of my fieldwork are the ancestral and traditional (and in
some cases, unceded) territories of the Anishinaabe peoples of Detroit (Ojibwe/Chippewa,
Ottawa/Odawa, Potawatomi, Sauk, and Meskwaki/Fox Nations) and Toronto (Mississauga of
the New Credit Nation) and the Coast Salish peoples of the Lower Mainland of British Columbia
(Musqueam, Skxwú7mesh-ulh Úxwumixw/Squamish/Skohomish, Stó:lo, and Tsleil-
Waututh/Burrard Nations). Thanks also to the students, faculty, and staff at UBC Geography,
and to those participating in MURG for their helpful comments and good times. Several parts of
this thesis were presented at the Decolonizing Cascadia? Mini-Conference in Vancouver, the
Association for American Geographers annual meeting in Los Angeles (thanks to Ryan Galt, Liz
Carlisle, and Nathan McClintock), and the UBC Geography Spring Symposium; thanks are due to
participants for their valuable input. Chapters 1 and 2 started as a GEOG 450 group project in
the spring of 2012; thanks to my colleagues Kathryn Dandyk, Claudia Hehn, Nimmer Khokhar,
Jonathan Walker, Kyle Wilson, and Gary Yarbrough for helping me get an early start on my
thesis. Without the support and exciting teaching of Jessica Graybill, Jake Brenner, Adam
Burnett, and Bill Meyer I would have never thought of continuing to study geography. My
15. xv
supervisors at UBC made me feel welcome and provided immeasurable support. Brian
Klinkenberg was always ready to answer tricky questions, and Elvin Wyly’s endless enthusiasm
and untiring conviction have inspired me greatly. I am also lucky to have such a supportive and
loving family; thanks Mom, Dad, and Joe. My transition to life in Vancouver was made possible
largely due to the generosity, friendship, and excellent cooking skills of Julia, Nick, Alex, Andrea,
and Graham. Finally, I thank Annabelle for the cartographic critique, Excel help, constant love
and support, and the occasional wry comment to keep me grounded.
16. 1
Introduction
Vancouver and Detroit
Vancouver, British Columbia (BC), and Detroit, Michigan (MI) are 1,962 miles away from
each other in traditional Cartesian space; in the more dynamic economic and social space of the
world’s cities, they are perhaps even farther apart. Although both North American cities
colonized by Europeans, they exist on very different socio-economic timelines.1
Detroit is
renowned as one of the world’s former industrial giants, the Motor City, where the American
Dream of automobile-centric urban sprawl was born. Most accounts of this famous city start by
rolling off a list of impressive – and depressing – statistics (e.g. Binelli, 2012: 9), some of which
are duly repeated here (see also Table 1 below).
Detroit is the only city in the United States to have surpassed and then fallen below one
million people in population: approximately 1.9 million in 1950 to just over 700,000 in 2010
(see Figure 1 below). The city’s demographic transition encapsulates post-war white flight
through suburbanization and the Great Migration of African Americans2
from the rural South to
the urban North: in 1920, four percent of Detroit’s 993,678 people were black (Gavrilovich &
McGraw, 2000); by 2010, the city’s population of 713,777 was 84% black, making it the city with
the highest percentage of African Americans in the United States (2010 American Census).
While the majority of Rust Belt deindustrialization occurred from the 1960s to 1980s, Detroit
continues to be hit hard by a changing economy. Between 2000 and 2008, one out of every four
private-sector jobs lost in the United States occurred in Michigan (Little, 2009); 150,000 of
1
Note that although this thesis has been influenced by comparative urbanism, this approach and its literature is
largely implicit in the analysis. For a recent review of the field, see McFarlane & Robinson (2012).
2
The terms black and African American will be used interchangeably in this thesis.
17. 2
these were automobile industry jobs in Detroit (Platzer & Harrison, 2009). Detroit has seen all
of the major American urban transitions of the 20th
and 21st
centuries play out in microcosm:
Table 1. Selected demographics for Vancouver and Detroit. Note that currency data is presented in CAD or USD
depending on country and has not been adjusted from the years they were created. Sources: 2006 and 2011
Canadian censuses, 2010 American Census, 2011 American Community Survey, Davidson (2012), and Canada
Mortgage and Housing Corporation (2012).
Variable Vancouver Detroit
Evidence of human settlement ~8,000 BCE ~11,000 BCE
European contact 1791 1670
Founded - 1701
Incorporated 1886 1806
Population (2011, 2012) 603,502 701,475
Land area (square miles, 2011, 2012) 44.39 142.87
Population density (people per square mile, 2011, 2012) 13,590 5,142
Residential vacancy rate (2006, 2011) 7.5% 28.9%
Residential rental vacancy rate (2011, 2011) 1.9% 12.5%
Residential parcel vacancy rate (2010) - 39.1%
Percentage land vacant* (2010) - 15.4%
Median household income (2006, 2011) $47,299 $27,603
Median rent (2006, 2011) $940 $779
Median home value (2006, 2011) $604,983 $69,125
Unemployment rate (2006, 2011) 6.2% 27.5%
Percent automobile commuters (2006, 2011) 83.3% 79.9%
Percent with high school education or more (2006, 2011) 82.4% 76.3%
Percent Native American/Aboriginal identity (2006, 2011) 2.1% 0.2%
Percent foreign-born (2006, 2011) 48.0% 5.3%
Percent non-white (2006, 2011) 49.6% 87.7%
Percent owner-occupied housing (2006, 2011) 51.4% 50.5%
Percent receiving public assistance (2011) - 9.4%
Percent receiving SNAP* benefits (food stamps) (2011) - 35.9%
Percent receiving Social Security Insurance (SSI) (2011) - 13.1%
Percent of incomes composed of gov’t transfer payments (2006) 10.4% -
*Note that the Supplemental Nutrition Assistance Program (SNAP) referred to in the table is the current
name for the federally-funded, state-distributed food purchasing financial assistance program
historically known as the Food Stamp Program.
industrialization, unionization, the rise of the middle class, racial segregation, suburbanization,
postindustrial economic decline, race riots, the crack cocaine wars and neoliberal retrenchment
of the 1980s and 1990s, the foreclosure crisis of the late 2000s, and perhaps even a glimpse of
18. 3
America’s urban future with the city filing for Chapter Nine bankruptcy on July 18, 2013,
becoming the largest American city ever to do so.3
Figure 1. Populations of Vancouver and Detroit and their metropolitan (statistical) areas, 1810-2011. Source:
Canadian and American censuses.
Vancouver stands in stark contrast to the shrinking Eastern city of Detroit as a rapidly
growing Western city (see Figure 1). While Detroit is often pointed to as an example of a city
with very low population density (though see Clement, 2013: 66-67), Vancouver’s dense
3
Several events stand out in this chronology: Henry Ford’s innovations of the assembly line and the five dollar a
day wage, the 1974 Milliken v. Bradley Supreme Court decision against the forced desegregation of schools
through bussing, the 1943 and 1967 race riots, some of the largest and most devastating in the country, and the
deadly Stop the Robberies, Enjoy Safe Streets (STRESS) paramilitary police team that was responsible for 500
warrantless-raids and 20 killings over its 30 month existence until the election of Coleman Young, the city’s first
black mayor, in 1974 (see Georgakas & Surkin, 1998: 168). For a historical overview of many of these events and
others, see Sugrue (2005), Conot (1974), or the work of Clarence M. Burton (e.g. 1930). For a more popular take on
Detroit’s history and current situation, refer to Chafets (1990) or Binelli (2012).
0
500,000
1,000,000
1,500,000
2,000,000
2,500,000
3,000,000
3,500,000
4,000,000
4,500,000
5,000,000
1810
1820
1830
1840
1850
1860
1870
1880
1890
1900
1910
1920
1930
1940
1950
1960
1970
1980
1990
2000
2010
Population
Year
Metro Detroit
Detroit
Metro Vancouver
Vancouver
19. 4
downtown residential development makes it a star example of planners’ recent obsession with
density (see Quastel et al., 2012). Although it is a relatively small city (Canada’s eighth largest),
Vancouver has actively pursued world city status, especially since the late 1990s. Combining a
booming tourism industry and a globalized real estate market with the natural attractions of its
Pacific Northwest environment has made Vancouver a global consumption city (Siemiatycki,
2013). Regularly high rankings on inter-urban league tables measuring sustainability and
livability are an asset highly valued by the City government, which has actively marketed
Vancouver as a place ideal for a cosmopolitan upper class. This trend largely reflects the
decrease of traditional (i.e. resource-based) economic activity in the Lower Mainland and the
rise of consumption-based – and to some degree, creativity- or knowledge-based – industries.
While often pointed to as a paragon of 21st
century urban planning and development (e.g.
Punter, 2003; Harcourt & Cameron, 2007), Siemiatycki nicely summarizes why the much-
praised model of Vancouverism ultimately rests on significant and often unjust changes in the
urban economic order:
Vancouver is simultaneously the most livable and unaffordable city in the world;
Vancouver is a leading creative city in which creative firms and workers alike struggle
under conditions of precariousness; Vancouver is mythologized as a healthy,
sustainable, lifestyle city while these very qualities often must be sacrificed by working
Vancouver residents. (2013: ii)
What then, do these two cities have in common? In this thesis, I will explore a
phenomenon both cities share: urban agriculture.4
With farmer-turned-mayor Gregor
4
A note on terminology: through the thesis, I will refer to the general phenomenon of growing food in cities as
urban agriculture. My definition of urban is loose, but for purposes of analysis my study areas are restricted to the
municipal boundaries of the cities of Vancouver and Detroit, except where noted. Urban gardening will refer to
smaller scale urban agriculture and urban farming to larger scale operations. See Table 3 for more information.
Additionally, this thesis deals exclusively with urban agriculture in the Global North; for an overview of the urban
20. 5
Robertson and City Council supporting sustainability efforts and a regional history of
environmentalism, Vancouver has recently received national media attention for its urban
agriculture efforts (e.g. Elton, 2012; CBC News, 2013). For quite opposite reasons, abandoned
and vacant land in Detroit has been farmed by residents for decades, with some simply trying to
subsist and others hoping to improve the health and economic wellbeing of their
neighborhoods. With high levels of diet-related diseases such as diabetes and heart disease,
urban agriculture has often been touted as a solution to Detroit’s food inaccess problems and
related health issues (e.g. Romm, 2010). Motown has often stood as a bellwether for the rest of
the United States (Herron, 2007; Millington, 2010, 2013), and in recent years the nation has
kept a close eye on the city, with some commentators reveling in the seemingly post-
apocalyptic landscape (e.g. Boileau, 1997; Vergara, 1999) and others looking to the city as an
example of postindustrial ingenuity (see Solnit, 2007; Binelli, 2012: 62). The cases of Vancouver
and Detroit urban agriculture make for romantic news stories about the promise of urban
sustainability, but their juxtaposition begs further questions. How is urban agriculture seen as a
sustainable solution to the very different problems faced by these two cities? What does this
tell us about how individual actors and municipal governments view the idea of sustainability?
What is the relationship between differently neoliberalizing urban political economies and
urban agriculture?
Research goals
In answering these questions, my project has several goals, both scholarly and political.
My contribution to geographic knowledge centers around determining how urban agriculture
agriculture movement in the Global South, see Smit et al. (1996) and Bakker et al. (2000). In tables in this thesis,
urban agriculture will sometimes be abbreviated UA.
21. 6
fits in the urban landscapes of these two cities: what conditions lead to its emergence, what
spatial patterns it displays, and in what kinds of neighborhoods it appears. To investigate this
phenomenon I employ both quantitative methods employing geographic information systems
(GIS) and statistical analysis and a qualitative approach drawing on interviews with urban
agriculture movement participants. More broadly, I also seek to understand how it emerges in
different urban political economies, hence my decision to analyze the very different cities of
Vancouver and Detroit.
The political influence behind my subject of research comes from the food justice
movement. Food justice is defined by Robert Gottlieb and Anupama Joshi as “ensuring that the
benefits and risks of where, what, and how food is grown and produced, transported and
distributed, accessed, and eaten are shared fairly” (2010: 6). Food justice activism has been
heavily influenced by the environmental justice movement, which seeks to simultaneously
make visible and work to change unequal exposure to environmental harms such as industrial
pollution, the risk of which is generally greater to marginalized people in racialized and low-
income communities (see Gottlieb & Fisher, 1996). Food justice is also considered to be part of
the alternative food movement (AFM), which has arisen in the Global North as a reaction
against the industrialized food system and its negative health, economic, environmental, and
social impacts. Recent scholarly work (Guthman, 2004, 2011; Slocum, 2007; Gottlieb & Joshi,
2010) has critiqued how the mainstream AFM would benefit from better incorporating the
antiracist and social justice goals of food justice. I join other scholars (e.g. Alkon & Agyeman,
2011; McClintock, 2011) in studying urban agriculture as a self-reflexive, critical AFM participant
seeking to strengthen the transformative political potential of the movement.
22. 7
Most urban agriculture projects are inspired by to some degree by the alternative food
and food justice movements. Many also stress the importance of food security, which is defined
by the United Nations as “when all people, at all times, have physical, social and economic
access to sufficient safe and nutritious food that meets their dietary needs and food
preferences for an active and healthy life” (Food and Agriculture Organization, 2013). By
growing their own food, urban gardeners and farmers hope to improve their own and their
communities’ access to fresh, organic produce. Some organizations also work under a
community food security (CFS) paradigm, which emerged in the United States largely in
response to the shortcomings of the emergency or charity food sector (see Morales, 2011). By
only providing temporary relief and not addressing the root cause of poverty and lack of self-
determination in food insecure communities, the CFS perspective sees emergency food sources
like food banks and soup kitchens as unable to provide long-term food security. CFS organizers
use urban agriculture as one tool in a multifaceted approach designed to allow communities to
generate their own means of creating food security.
Food system scholars have also examined the relationship between the AFM and
neoliberalism, although this literature has been much less influential on the mainstream AFM
and its media portrayals. In this thesis, I draw on this literature to explore the role between
urban agriculture and neoliberalization. This involves tracing how the economic restructuring of
the late 1970s to today – especially policies reducing state services and encouraging inter-urban
entrepreneurial competition – has created the landscapes in which urban agriculture has (most
recently) emerged. By treating neoliberalization as a process instead of a static series of events,
I hope to first, see how this process works differently in the contexts of Vancouver and Detroit,
23. 8
and second, assess which kinds of urban agriculture more actively resist the injustices of
neoliberal urbanism.
Chapter summaries
Researchers and educators have also played an important part in mainstreaming the
AFM through concerns over food security. Highly influential in scholarly responses to problems
of food inaccess is the food desert method. This method draws on epidemiology and GIS
technology to determine which areas of cities lack access to fresh food. In Chapter 1, I briefly
review the food desert literature with an eye towards both methodological and sociological
critiques. With these short-comings in mind, I present my own method for measuring food
access that seeks to avoid the epidemiological method of food access studies in favor of an
ecological approach with social inequalities as the primary focus of inquiry. To do so, I build a
dataset with a wide range of food sources beyond full-service supermarkets. Instead of using
the food desert concept, I work with the idea of a foodscape. The foodscape can simply be
defined as “the spatial distribution of food across urban spaces” (Johnston et al., 2009). While
quite a general concept, it presents a more holistic view of the food retail environment than the
food desert, which starkly separates urban space into areas of access and inaccess. The
foodscape concept more accurately describes my method because I seek to measure all food
access, from restaurants to corner stores and including AFM sources like urban agriculture.
In Chapter 2, through the use of cluster analysis, multidimensional scaling, and a
method combining multidimensional scaling with local indicators of spatial association, I
present my findings regarding the distribution of food sources within the cities of Vancouver
and Detroit. Three primary themes emerge from the results: first, the foodscape is significantly
24. 9
influenced by the housing and land market of each city. In Vancouver, high-value waterfront
and downtown real estate supports relatively dense food retail, while less dense residential
areas – especially those on the West side – have relatively few food sources. As has been
discussed widely, Detroit’s postindustrial landscape has large areas of vacant land where the
primary source of food is corner stores, although the emergency and alternative food systems
present efforts to improve access. Income inequality also plays a role in the contours of the
foodscape, with wealthier areas in Vancouver having relatively fewer food sources due to their
quasi-suburban neighborhoods of single family housing. Finally, the effects of racial segregation
and inequality can be detected in the data, illustrating both the historical legacy and continuing
presence of racism in the food systems of each city.
Chapter 3 serves as a brief transition between the quantitative methods employed in
the first half of the thesis to the qualitative exploration of the economic context and political
contestation of urban agriculture of the second half. In Chapter 4 I present the history of local
and urban agriculture in each city and examine recent efforts by the local state to selectively
support urban agriculture as part of a sustainability fix. Drawing on an urban political ecology
framework, I use the concept of metabolism to unpack urban agriculture’s relationship to
neoliberalization. The comparison of such different cities illustrates how urban agriculture gets
picked up in different regulatory and economic sites. Under conditions of austerity in Detroit,
large scale urban agriculture becomes the solution to devalued postindustrial land, facilitating
the densification and targeted investment of gentrifying neighborhoods while city services are
withdrawn from those deemed destined for agricultural use. On the other hand, the City of
25. 10
Vancouver’s use of sustainability as a tool in inter-urban competition has facilitated the
expansion of certain forms of urban agriculture.
Finally, in Chapter 5, I draw on interviews conducted with farmers, gardeners, and other
urban agriculture supporters and practitioners to explore the connections between metabolic
rifts, theories of change, and the political projects wrapped up in urban agriculture. My results
point to a diversity of rationales for pursuing urban agriculture and suggest that while
neoliberalization has created the political-economic context whereby urban agriculture
flourishes as a Polanyian (1944) counter-movement, only urban agricultural projects targeting
all three metabolic rifts as presented by McClintock (2011) effectively resist the market logic
that supports urban inequality. By actively resisting the ecological (contamination and
environmental degradation of industrial agriculture), the social (commodification of land and
labor), and the individual (dual alienation from products of labor and the land) metabolic rifts,
radical grassroots urban agriculture holds the potential to make food justice part of a broader
agenda for social justice.
26. 11
Chapter 1: Quantifying the Urban Foodscape
Where do you go to buy your groceries? Or pick up your free meal? Or harvest your
weekly vegetables from the soil? Most urban dwellers are proud owners of an intimate mental
map (Gould & White, 2004) of where they go to get food, whether it is the best restaurant to go
for a weekend brunch, the safest places to go dumpster-diving, or the hidden gem of a deli that
is the cheapest place in the city to get organic Italian Parmesan (see, for example, Rowntree,
1997, Forsyth et al., 2010; Hashimoto, 2012). Where they go to find the fuel required to get
through the day can say quite a bit about their material wealth, social capital, and personal
beliefs or politics. As the epidemiology and public health literature tells us, it can also be a
significant factor affecting their physical and mental health (see Walker et al., 2010). Therefore,
a central challenge confronting social scientists interested in studying urban foodscapes and
food access is leveraging these diverse mental maps to gain a better understanding of the
factors influencing where people are able to find sustenance. This challenge can be even
greater when the focus of inquiry shifts from an individual level to a neighborhood and from a
neighborhood to a city or region. The foodscape concept is helpful here because it focuses on
empirically describing the range, type, and mix of food sources available across space in the
urban environment (Mikkelsen, 2011; Sulaiman & Haron, 2013), a concept that is in many ways
a useful generalization of these individual mental maps.
Thus, a problematic for this study is how to describe the foodscapes of two drastically
different cities at a level where generalizations can be supported by empirical data. While
qualitative research – and especially ethnography – of individual, community, or neighborhood
foodscapes can reveal the contours of social and spatial difference influencing food access (see
27. 12
Cummins et al., 2007: 1826), such a nuanced and ‘close-up’ approach is less helpful when
thinking at the level of the city or for asking how foodscapes interact with different paths of
urbanization and the resulting sedimentation of inequality. Therefore, my goal for this chapter
is to present a method that facilitates making empirical and quantitative generalizations about
neighborhood-level foodscapes. This objective will be accomplished through expanding the
notion of what counts as a food source in food access studies by including a diverse range of
sources including food retail, alternative food organizations, and urban agriculture. By
expanding the methodology to include urban agriculture, a quantitative and empirical base will
be established for the discussion in later chapters regarding how growing food in the city fits
into the metabolism of nature and circulation of capital within both Vancouver and Detroit.
Proximity = access: the food desert approach
Perhaps the most recognizable effort to quantitatively measure food access at the level
of neighborhoods and cities has come from research into food deserts. In fact, this term has
become common parlance within the AFM and the mainstream media (Guthman, 2011: 67,
154). Considering that this body of research has been influential in my response to the above
problematic, in this section I will provide an overview of the history and theoretical
assumptions of the food desert approach.
The food desert approach started as an epidemiological investigation into the
relationship between dietary disease (e.g. diabetes mellitus type two and coronary heart
disease), food access (usually understood as distance to a full-service supermarket) and
28. 13
neighborhood – or ‘foodshed’5
– demographics. Central to this approach was a concern with
obesity; the first major use of the food desert concept came about during investigation into
‘obesogenic environments’ and health inequalities in the United Kingdom during the 1990s
(Department of Health, 1996; Whelan et al., 2002). Concern over rising rates of obesity and
diet-related illnesses in the Global North have been central in spurring this research, which has
led to one of the central insights of public health and epidemiology coming to the forefront of
academic research and public concern: that people who are socially marginalized and
oppressed along many lines of difference (most notably the familiar triad of race, class, and
gender) are much more likely to suffer ill health (see Schulz et al., 2002 for a discussion of racial
health disparities in Detroit). While this insight has been mainstreamed by the environmental
justice movement’s work linking everyday exposure to toxic chemicals to disease, more recent
food justice activism has highlighted the connections between social marginalization and diet-
related disease (Gottlieb & Joshi, 2010; Alkon & Agyeman, 2011). In this regard, recent interest
in food deserts has reflected a challenge to the individualized analysis of health in terms of
personal choices and moral obligations; it is now understood that health outcomes are deeply
shaped by social, institutional, and geographical context. This shift in health discourse is due in
large part to the influence of academic and activist approaches in the environmental and food
justice movements, which since the 1980s have presented strong evidence of the ways in which
bodily harm is unevenly distributed within society. The more radical political stance taken by
5
Foodshed is a term applying the idea of a watershed, or catchment area, to local food production: the area
covered by food production supplying a certain place. For example, Kremer & DeLiberty (2011) delineated the local
foodshed of Philadelphia by mapping all of the farms that supplied local produce to the city.
29. 14
these justice-oriented perspectives stands in contrast to the liberal, often technocratic position
prevalent in public health and epidemiology.
Therefore, several issues are worth emphasizing in this regard. Most fundamentally,
food desert research represents a particular way of investigating the relationship between
health and social inequality that has both positive and negative aspects from a food justice
perspective. To overcome the challenge of scale presented at the beginning of this chapter, the
food desert approach draws heavily on three research traditions (see Shannon, 2013). First is
the Chicago School of Sociology’s social ecology framework that has heavily informed modern
epidemiology. This approach sought to apply models from the natural scientific field of ecology
to human communities and privileged the effect of the urban environment on individuals to the
detriment of human agency. The second tradition comes from obesogenic environment studies,
which make many significant assumptions, including the energy-balance model of weight
change (i.e. calories in minus calories out equals weight change), a relatively straightforward
understanding of access as spatial proximity, and a conception of obesity (as opposed to
adiposity or related ailments like diabetes) as a pathological disease more than a reference to
body size (see Guthman, 2011: 25). The third tradition is the methodological approach of GIS,
the proliferation of which has facilitated the relatively simple creation of quantitative models of
food access. The combination of these three streams has created a body of work that has the
ultimate goal of quantitatively measuring the relationship between demographics, health, and
food access (see, for example, Gallagher 2006, 2007).
There are many variations in the exact methods employed in food desert studies, but
the overall method for GIS-based assessments follows the same general model. Access is
30. 15
operationalized as the distance between the center point (centroid) of a census aggregation
unit, usually a census tract, and the closest food source, usually a full-service supermarket. The
type of distance measure used varies from straight line Euclidian distance, right angle
Manhattan distance, or ‘networked’ distance measured along road and/or footpath networks
(for more discussion, see McEntee & Agyeman, 2010: 169; see also Figure 2 below). After this
measurement has been made the resulting distances are compared to the demographic
variables from each census tract to see if factors like race, median income, or automobile
commuting have statistically significant relationships to food access, often through correlation
or linear regression models (Walker et al., 2010). Variations on this approach are also common.
Perhaps most significant is the method employed by the Mari Gallagher Research and
Consulting Group, who carried out one of the first widely-publicized food desert studies in the
United States in Chicago (2006). Their approach measures what they call the ‘Food Balance
Score’ (2006: 22), where the Euclidian distance to the closest grocery store is divided by the
distance to the closest ‘fringe food’ (e.g. fast food or convenience) store at the census block
level. These distances are then averaged at the census tract level to develop an overall measure
of ‘food balance’.
While the ‘Food Balance Score’ method does overcome several of the methodological
difficulties inherent in public health studies of urban food access, it still ultimately relies on a
conception of access understood strictly as spatial proximity. By adopting such an approach,
researchers have documented statistically significant relationships between social
marginalization, poor food access, and health outcomes measured as cardiovascular disease
31. 16
prevalence or mean body mass index (BMI) (see Holsten, 2009 for a review).6
However, the use
of distance from centroids to food sources as a meaningful continuous variable against which
socio-economic data can be compared statistically is still a fundamentally troubling practice. It
is important to acknowledge the contributions of the food desert method, but to also recognize
the limits of such an approach.
Taking to heart the technical critiques of the food desert method (see, for example,
Cummins & Macintyre, 2002) and the theoretical critiques of its methodology and politics
leveled effectively by Julie Guthman (2011) and Jerry Shannon (2013), the fundamental issue of
access as spatial proximity is central. This assumption becomes especially troubling in efforts to
incorporate urban agriculture and other alternative food sources into food desert studies.
While attempts have been made to see if urban agriculture exists in food deserts quantitatively
(Mann, 2009), and through more qualitative and ethnographic work showing how the food
desert concept is mobilized in food justice organizing (see Guthman, 2011: 153-155), the
challenge of placing urban agriculture in the existing quantitative food desert model highlights
the problem with assuming that proximity equals access. Some urban agriculture models –
community gardens, for example – provide food directly to residents living nearby. On the
other hand, models such as community-supported agriculture (CSA) or market gardens often
grow in areas spatially distant from their customers, due mostly to their greater demand for
land and water access.7
Additionally, a central concern in critical food studies literature is the
social role played by urban agriculture: in building community cohesion or inclusion (see Guitart
6
Body Mass Index (BMI) is a measure of body mass calculated by dividing weight in kilograms by height in meters
squared. BMI is the main epidemiological measure of fatness in populations, but has significant limitations, most
obviously that it is a measure of total body mass, not body fat (or adiposity). For a history of the concept, see
Guthman (2011: 27-30), and for scientific and sociological critiques of its use, see Gard & Wright (2005).
7
See page 19 for a more detailed discussion of different models of urban agriculture.
32. 17
et al, 2012); creating alternative moral economies (e.g. Rosol & Schweizer, 2012); or effecting
neighborhood change (e.g. Reynolds, 2010). While food access plays a central part in these
processes, the simple presence of urban agriculture in particular neighborhoods may also be
very important.
With this in mind, my study starts with the technique of food desert analysis but
modifies two of its central assumptions. First, I reject the assumption of access in matching
food sources to census tracts in favor of a focus on presence. Second, I do not treat the
distance linking centroids and sources as a meaningful continuous variable but instead only as a
method for matching tracts and sources. The resulting method focuses on how food sources
are distributed in relationship to the built environment and provides the means to answer the
research question, ‘What kinds of neighborhoods have what kinds of food sources?’ By taking
this approach, in this thesis I seek to integrate the empirical generalizations made possible by
ecological approaches to understanding urban inequality with the political motivations of the
critical political ecology and food justice movements. While inequality in the distribution of
food sources between neighborhoods may not map directly onto larger measures of socio-
economic and health outcome inequality, investigating both together can better describe and
provide grounds to combat the spatial injustices created by urbanization.
My method
My work in this chapter aligns with recent studies (An & Sturm, 2012; Lee, 2012) in using
new methods and data in an attempt to gain a broader understanding of the spatial variation in
urban foodscapes. I also aim to join other geographers critically using quantitative methods as
part of a “strategic positivism” (see Wyly, 2009, 2011) that does not try to resurrect objective
33. 18
spatial social science, but rather brings statistical techniques to bear on pressing issues of social
injustice. Specifically, the method I use facilitates the incorporation of urban agriculture into
the overall picture of spatialized inequality in Vancouver and Detroit. In contrast to food desert
analysis, my approach does not attempt to calculate the degree of access to food sources as a
continuous variable; instead, it simply matches food sources to their ‘neighbourhood’, i.e.
census tract. While this process still uses distances to assign sources to census tracts, it does
not then use that distance as a meaningful continuous variable in statistical analysis. This
method still allows socio-economic data from the census to be analyzed with food source data,
but seeks to better understand what determines the presence of food sources in a
neighborhood instead of what determines access.8
By avoiding the simplistic understanding of
access as proximity, this method avoids drawing on narratives in which discourses of obesity
and dietary disease are constructed as either entirely environmentally determined or as the
result of immorality. My approach opens up discussions for alternative understandings of issues
of food access and how they should be addressed.
Still, I use several techniques from food desert studies designed to more accurately
reflect access. First, census tract centroids are population-weighted by 2010 (Detroit) and 2011
(Vancouver) census total population by blocks. This step shifts the ‘center of gravity’ of each
8
Although my method does have its advantages, it must be noted that this shift from a continuous to a binary
relationship between food sources and census tracts exacerbates the modifiable areal unit problem (MAUP) in my
analysis. This statistical problem arises when the districts (areal units) used to aggregate data points are arbitrary
(modifiable), in this case the census tracts and food source points. A continuous variable is better able to account
for this issue by establishing a degree of connection between points and tracts instead of a binary condition (in or
out). The central issue here concerns what kinds of points are being used in the analysis, however. In a simple food
desert analysis focusing solely on supermarkets, it is logical to measure the distance from tract centroids to the
nearest supermarket. Because my method uses multiple different categories of food source points and seeks to
measure the total number (or population-adjusted level) of different kinds of food sources present in each
neighborhood, a single continuous measure cannot be assigned to each tract. Capturing the level of food source
presence requires using a binary relationship.
34. 19
census tract to more accurately reflect areas where people live, an important consideration for
census tracts containing large public parks or industrial areas.9
Additionally, instead of using
straight line Euclidean distances, networked distances along roads were used (see Figure 2
below). This technique accounts for the disruptions in urban mobility caused by large highways
and dead-end streets, an issue especially apparent in certain areas of Detroit (see Ryan, 2008).
Taken together, these techniques allow the investigation of the relationship between a wide
variety of food source types and socio-economic variables. Before presenting the results of this
analysis, however, an extensive explanation of the data is warranted, as data quality and
availability play a vital role in foodscape measurement (see Walker et al., 2010).
Data sources
The data for this study fall into three general categories. Demographic data and census
blocks and tracts geodata are from national censuses: the 2006 Canadian quinquennial census10
and the 2011 American Community Survey (ACS) (2006-2011 averages). The road layers used in
the network analysis were acquired from CanMap Streetfiles (DMTI Spatial Inc., 2010) and the
State of Michigan (2011). Food source locations were taken primarily from a file of point of
interest (POI) locations released by SimpleGeo Places, a now-defunct startup mobile software
company. In addition to the SimpleGeo data, several smaller databases – as well as manual
data-gathering – aided in building the sample of food sources. It is worth noting here that while
the demographic data are based on large-sample census estimates with established degrees of
reliability, the sample of food sources was not created systematically and, if anything,
9
This procedure is done as follows: first, the center point (centroid) of each census tract is determined. Then,
census population counts at smaller levels of aggregation are obtained, in this case from census blocks. Finally, the
position of the tract centroid is altered based on the ‘weight’ of population distribution by blocks using the Mean
Center tool in ArcGIS.
10
At the time of analysis, detailed data tables for the 2011 Canadian quinquennial census were not released.
35. 20
Euclidian distance to closest grocery store
Networked distance to closest grocery store
Networked distance to many sources
Figure 2. Three different methods for matching food sources (circles) with census tract centroids (stars). Note that
the first two more prevalent methods measure distances to the single closest grocery store, while the third – my
method – measures distances to many different kinds of food sources.
represents a convenience sample. However, in the era of ‘big data’,11
such sources are quickly
becoming the de facto standard: companies without the kind of digital presence picked up by
11
‘Big data’ is the term used to describe the increasing amount of data being generated since the advent of the
internet and increased computer memory storage capabilities. In the case of this study, the so-called ‘social data
revolution’ (see Hubbard, 2011) plays a major role in this trend, with information being generated at extremely
high rates through the activities of internet users on social media, Web 2.0 (or 3.0), and crowd-sourcing websites.
It should also be noted that because the data from this study come from a much larger dataset, they are not ‘big
data’ on their own, but their creation would not have been possible without large-scale data mining.
36. 21
firms like SimpleGeo that generate revenue through data collection are rapidly becoming
extinct. In this light, my study comes at what is likely a unique point in the history of social
science research where it is still possible to combine data from disappearing large-sample, long-
form, governmental censuses with the new paradigm of big data. That said, the time spent
building both samples and the internal reliability of the databases used does mean that the
data should be generally reliable at the neighborhood level.
The scope of the study was restricted to the municipal boundaries of the City of
Vancouver and the City of Detroit primarily in an effort to maintain focus and create a dataset
of a manageable size. An effort has been made to place these city-level findings in their regional
contexts in Chapter 4. Also note that the cities of Hamtramck and Highland Park, both
contained within the boundaries of the City of Detroit, were included in the data to reduce the
boundary problem.12
Table 2 below shows the census variables used for each city. These
variables were chosen based on the common findings of other food desert studies as outlined
in Walker et al. (2010). SimpleGeo was an Application Programming Interface (API)-based13
geolocation service that has since been acquired by Urban Airship (2011). Upon being acquired
12
The boundary problem is one of the four major issues with spatial analysis and occurs when calculated values or
statistics in a given areal unit (in this case the Detroit census tracts abutting the Hamtramck or Highland Park
tracts) change due to the exclusion of values in bordering areal units (in this case the Hamtramck or Highland Park
tracts). Because points are matched to their census tracts based on distance, excluding the Hamtramck or Highland
Park tracts, roads, or food sources would have affected the results in Detroit tracts. Of course, this problem is
largely unavoidable in food desert-style analysis because it requires constantly expanding boundaries; however,
while it still exists to some degree in tracts located around the border of the city, it was at least reduced through
the inclusion of Hamtramck and Highland Park data. This issue was not resolved for the Vancouver – Burnaby
border. See also Sadler et al. (2011) for a discussion of this problem in rural food desert studies.
13
An Application Programming Interface (API) is a method of allowing software components to interact with each
other, e.g. a script could be written to use an API to query a website’s online database. A user who has an API key
can query the database through methods established in the API documentation using a programming language like
Java. Companies like SimpleGeo and Urban Airship focus on giving these tools to software developers who wish to
incorporate location-aware features into their mobile applications.
37. 22
Table 2. Variables and corresponding census source.
Variable Source
Vancouver, 2006 Census
POP Total population (100% sample data
MEDINC Total (before-tax) income in 2005 of population 15 years and over - 20% sample data / Median income $
UNEP Unemployment rate
AUTO_COMM Total employed labour force 15 years and over with usual place of work or no fixed workplace address by
mode of transportation - 20% sample data. Included both categories: Car, truck, van, as driver and Car, truck,
van, as passenger
HSORMORE_P Total population 15 to 24 years by highest certificate, diploma or degree - 20% sample data, minused and
divided category: No certificate, diploma or degree
ABORIG_P Percent total population by Aboriginal identity population - 20% sample data
INDIAN_P Percent total population by Registered Indian status - 20% sample data
IMMIG_P Percent total immigrant or non-permanent resident population - 20% sample data (as in foreign-born
whether citizen or not)
NONWHITE_P Percent total visible minority - 20% sample data
FAM_TP Composition of family income in 2005 for all economic families % - 20% sample data / Government transfer
payments %
INDIV_TP Composition of income in 2005 for persons 15 years and over not in economic families % - 20% sample data /
Government transfer payments %
COMB_TP Estimated composition of income for economic families and individuals not in economic families. This was
Calculated as ((((percent economic families TP)*(number economic families * average census family
size))+((percent non-economic family individual TP)*(number non-economic family)))/(Number non-
economic family+(number economic family * average census family size))), i.e. composition weighted by
relative share of economic family members and noneconomic family individuals.
RENT Tenant-occupied private non-farm, non-reserve dwellings / Average gross rent $
VALUE Owner-occupied private non-farm, non-reserve dwellings / Average value of dwelling $
Detroit, 2011 American Community Survey
POP B01003 Total population
MEDINC B19013 Median family income in the past 12 months (in 2011 inflation-adjusted dollars)
UNEP B23025 Employment status for the population 16 years and over
AUTO_COMM B08101 Means of transportation to work by age
HSORMORE_P B15001 Sex by age by educational attainment for the population 18 years and over
NONWHITE_P B02001 Race
ABORIG_P B02001 Race
IMMIG_P B05002 Place of birth by nativity and citizenship status
PUB_ASSIST B19057 Public assistance income in the past 12 months for households
FOOD_ST B22003 Receipt of food stamps/SNAP in the past 12 months by poverty status in the past 12 months for
households
SSI B19056 Supplemental security income (SSI) in the past 12 months for households
ASSIST_ALL B09010 Receipt of supplemental security income (SSI), cash public assistance income, or food stamps/SNAP
in the past 12 months by household type for children under 18 years in households
RENT B25064 Median gross rent (dollars)
VALUE B25077 Median value (dollars)
by Urban Airship on April 20, 2011, SimpleGeo announced it was releasing its entire database of
approximately 20 million points of interest (POIs) (called SimpleGeo Places) located in many
38. 23
countries around the world under a Creative Commons Zero, or ‘No Copyright’ license
(SimpleGeo, 2011a). This database of business and landmark locations was created with a
combination of user-generated or user-volunteered geographic information and automated
gathering of information by ‘internet bots’, which are programs that search, download, and
fact-check geographic information from websites like Yelp14
or Yellow Pages15
(SimpleGeo,
2011b).
Because this file was released in June 2011, it represents a snapshot (or cross-sectional)
sample of food sources existing in the SimpleGeo database at that time. While there is certainly
some temporal inaccuracy caused by lags between businesses closing and opening and then
establishing an online presence significant enough to be captured by SimpleGeo, the data are
assumed to be a relatively accurate sample as of summer 2011. This database was downloaded
in GeoJSON format from SimpleGeo’s Amazon-hosted .zip file (SimpleGeo 2011c) through a link
on Robin Wilson’s webpage (2012), and the points within the City of Detroit and the City of
Vancouver were extracted into two separate files using findstr in Windows command line. The
resulting GeoJSONs were cleaned to remove special characters, written as comma-separated
values using a Python script based on Dalton (2011), and then converted to ESRI Shapefile
format using the OGR2OGR function of the Geospatial Data Abstraction Library 1.9.0 (GDAL;
Open Source Geospatial Foundation, 2011), and finally imported into ArcGIS 10 (ESRI, 2011).
Because the SimpleGeo database focuses on businesses, it provides a breadth of
information on food retailers that is missed when food desert analyses only use data on major
chain grocery stores. Additionally, because the data are classified into categories and sub-
14
www.yelp.com
15
www.yellowpages.com
39. 24
categories, it is possible to organize these food sources by type, e.g. grocery store, fast food
restaurant, or even donut store. This database is also an extremely valuable resource for
students as it is available for free, while most other POI databases (e.g. from InfoUSA or DMTI
Spatial) charge a significant fee for their use. Combining the existing SimpleGeo categories with
my own decision-rules made to facilitate analysis (as described below), my food source dataset
was classified into 33 specific food source types and then into nine general food source
categories. In the next section, I will now explore how this database was built and how choices
were made regarding the classification of food source type.
Building the food source dataset
After successfully getting the SimpleGeo data ready for use in ArcMap, the SimpleGeo
categories were then reclassified to match my own, more specific classification system. The
SimpleGeo data points were categorized at three levels of detail: Category, Type, and
Subcategory. In Appendix A: Category Table I indicate how the SimpleGeo classification system
maps onto mine, with some notable exceptions that will be discussed further below. Note that
for some broader SimpleGeo categories, like Restaurant, keywords in the name of the source
were used to identify more specific categories like Fast Food/Pizza or Bakery/Deli.
While the SimpleGeo data were precise enough to identify most of the kinds of food
sources important to my study, there were two areas in which they were lacking specificity.
Due to the fact that SimpleGeo gathered information primarily on businesses, the first major
issue is that less-publicized entities like urban agriculture sites and some nonprofit emergency
food organizations (like soup kitchens) were not included in this database; to properly expand
the kinds of food sources used in describing the urban foodscape these kinds of alternative sites
40. 25
are key to my study. To remedy this issue, several methods were employed to gather the
locations of these POIs in Vancouver and Detroit. Further, as noted above, due to the
SimpleGeo data being released in June 2011, only food sources known to be open at that date
were included in the sample.
Two significant databases were found to fill in the gap on emergency food locations in
both cities. For Detroit, the website www.foodpantries.org (Food Pantries, 2013) was used to
build a database of 119 food pantries or banks and nine soup kitchens. This database is
manually maintained by a webmaster and was built through user- and organization-submitted
data. Vancouver Coastal Health maintains a listing of free and low-cost meal programs on their
website (2011), which was categorized into 52 community meal programs, ten food pantries, 30
free meal programs, one low-cost grocery store, and fifteen low-cost meal programs. It is
important to note here that the fifteen food distribution depots of the Greater Vancouver Food
Bank Society are not available publicly for “confidentiality and security reasons” and so the food
bank data in my Vancouver sample is underrepresented (Greater Vancouver Food Bank Society,
2012). A second note is that the categorization of emergency food sources differs slightly
between the two cities and that this difference is due to gathering information from two
different databases. While this does mean the 33 specific categories are not directly
comparable, the general category of emergency food remains accurate.
Urban agriculture and alternative food organization points were gathered through the
use of existing datasets and manual data entry based on internet searching, first-hand
observation, and second-hand information gathered in conversation. Several pre-existing
databases contributed to my sample. First, the City of Vancouver maintains a geodata file of the
41. 26
location of public community gardens (2012a). Second, the Vancouver urban agriculture
program Lawns to Loaves published the location of all the plots of wheat being grown on
private property throughout the city as part of their program (2011), which was included in the
sample as its own category. Such pre-existing databases did not exist for urban agriculture in
Detroit. While the Garden Resource Program (GRP, funded in part by the University of Michigan
and the United States Department of Agriculture, USDA) provides help to 1,400 community,
market, and backyard gardens in Detroit (The Greening of Detroit, 2012), their database is
private due to the understandable fact that most individuals – gardeners or farmers – do not
want to share their private information, often due to fear of theft (A. Atkinson, personal
communication, February 15, 2012). For this reason, my database only used publicly available
information in an effort to allow urban agriculture to be studied without violating the privacy of
any individual or institution. Data on public school gardens were available for both cities and
were added to the dataset (Detroit Public Schools, 2011; Public Health Association of BC, 2012).
The final pre-existing data drawn on were lists of farmers’ market locations for Vancouver
(Vancouver Farmers Markets, 2011) and Detroit (Michigan Farmers Market Association, 2011).
In addition to pre-existing databases, additional urban agriculture and alternative food
sources were added to the sample manually. Locations were gathered directly from news
stories, Facebook pages, forum discussions, online videos, and first-hand observation during
fieldwork in Detroit during July 2012 and Vancouver from July 2012 to January 2013. Data
gathering worked with a snowball sample-type strategy: reading one news article profiling
urban farms would lead to searches for individual farms and to other news articles in which
they were mentioned; Facebook searches would reveal farms or organizations that had
42. 27
numerous connections to other sources that had a Facebook presence, etc. Through this
method 118 urban agriculture and 36 alternative food sources were added to the Detroit
database and 167 urban agriculture and thirteen alternative food sources were added to the
Vancouver database.
The classification of different models of urban agriculture presents a significant obstacle
for researchers (Mougeot, 2000). Typologies have been developed that differentiate urban
growing operations, for example, by location, primary activities, market engagement, and scale
(Schutzbank, 2012: 10). For this study, general classifications were developed that could easily
be applied with a minimum amount of information. The main focus of the classification was
primary activity: for what reasons does this urban agriculture source exist? Because of the
primarily online nature of gathering the urban agriculture sample, it was important that these
sources could be classified based on the limited amount of information available publicly. Other
researchers like Schutzbank (2012), who undertook a detailed economic census of urban farms
in Vancouver, were able to develop precise classifications due to their access to detailed
information on operation size and productivity. Given the wider approach and classification by
primary activity in this study, I therefore developed several classes for each city: for Vancouver,
community garden, community orchard, CSA, dairy farm, educational garden, Lawns to Loaves,
market garden, and school garden; for Detroit: CSA, educational garden, kitchen garden,
market garden, and school garden. Table 3 summarizes the primary activities associated with
each type.
While most urban agriculture sources were assigned one type, several operations fit
into both categories (e.g. run a CSA and sell produce on the market) and so were assigned to
43. 28
Table 3. Urban agriculture definitions.
Urban agriculture type Primary activity
Community garden
Only in Vancouver, an allotment garden whose
operation is facilitated by the city government.
Community orchard
An orchard managed cooperatively among
members of the local community.
Community-supported agriculture (CSA)
A for-profit farming model that sells shares at
the beginning of each season to distributes
weekly boxes of produce to shareholders.
Dairy Farm Only in Vancouver, the Avalon Dairy Farm.
Educational garden
A garden with a wide variety of ownership and
distribution models, but whose primary purpose
is not the production of large amounts of food,
but rather education and community-building.
Kitchen garden
Only in Detroit, a garden supplying a restaurant
kitchen.
Lawns to Loaves
Only in Vancouver, a program where
participants grow wheat in their yards to
eventually be milled into flour.
Market garden A for-profit farm growing to sell on the market.
School garden
A garden established at a school, usually for
educational purposes.
two classifications. It is vital to note here that private or backyard growing of food is not
accounted for, despite the fact that this form of agriculture is often the most significant source
of urban food production (Taylor & Lovell, 2012). However, it is not feasible for this study to
account for such small-scale growing that has no internet presence. Recent developments in
remote sensing and online space-sharing networks (e.g. City Farmer Sharing Backyards16
) do
suggest that such data may become available for future studies. A similar method was used to
classify alternative food sources. The classes used are explained in Table 4. Like emergency food
sources, classification here differs by city due to differences in how programs and organizations
self-described; the categories here were created to reflect these differences.
The second major issue with the SimpleGeo data regards the inclusion of supermarket
16
www.sharingbackyards.com
44. 29
Table 4. Alternative food source definitions.
Alternative food source Primary activity
Community Food Program
Only in Detroit, these organizations represent
emergency food provision that takes a
community food security approach by
integrating local produce, donations, and sliding
scale prices.
Community Kitchen17
Only in Vancouver, these locations provide
meals based on a gift economy and volunteer
labor model, with diners paying what they are
able for their food.
Co-op (cooperative)
Consumer-owned, membership-based grocery
stores that adhere to common alternative food
movement ethics.
Farmers' Market
Markets organized for local farmers and artisans
to sell their products, generally seasonally.
Homesteading Supplies
Only in Vancouver, this store (Homesteader’s
Emporium) offers training, equipment, and food
products for home food production.
locations and the accuracy of classifications for grocery stores. Here my study runs into a
central problem with data in food access studies: even if location data are available, very rarely
do they specify what kinds of food are available. As a central method for assessing the validity
of the SimpleGeo data, initial fact-checking focused on verifying the locations and existence of
supermarkets in the database. Comparisons with chain website store locators for the most
prevalent chain stores in Vancouver (see footnote 21) revealed that the coverage of
supermarkets appeared weak in the SimpleGeo database. This was surprising considering the
fact that similar brief searches for corner grocery stores or produce markets revealed strong
coverage. While this investigation into supermarket accuracy was in no ways systematic, as
such an undertaking would require significant investments in time and money to allow for
17
Several of these alternative food sources are under-represented due to the difficulty of gathering information on
them via the internet. A glaring example in Vancouver, for example, is the lack of representation for Sikh temple
community kitchens. However, an effort was made to incorporate alternative sources for which information was
readily available.
45. 30
ground-truthing (such as those employed by Dunn et al., 2012), it did suggest that further
manual editing and additions were required to ensure accurate data on supermarket locations.
This task was accomplished by a different method for each city. For Detroit, I learned
during my research and fieldwork that the common conception that Detroit does not have any
supermarkets is in fact false. The key piece of information sometimes included in media
discussion of food access in Detroit, but often overlooked, is that there are no chain grocery
stores in the city (Griffioen, 2011). The Detroit-based chain Farmer Jack had more than 100
stores open in southeastern Michigan at its peak during the 1980s until the supermarket
‘merger mania’ of the late 1980s and early 1990s (see Wrigley, 2002). The chain was acquired
by The Great Atlantic & Pacific Tea Company (A&P) in 1989, and A&P eventually decided to
abandon all stores in southeastern Michigan in 2007. The last Farmer Jack store – and last chain
grocery store still open in Detroit – shut its doors in July, 2007 (Youssef & Hurst, 2007).18
What I
discovered through my own attempts to find fresh food in the Motor City is that there are in
fact quite a significant number of independent or franchise supermarkets operating in Detroit,
most of which are supplied by Grand Rapids, Michigan-based Spartan Stores Incorporated, the
nation’s tenth largest grocery distributor (2013a) and supplier of forty independent grocers in
Detroit. Due to Spartan’s focus on full-service supermarket distribution, these forty stores
generally resemble a typical Midwestern discount supermarket, with fresh produce, processed
18
In a surprising turn of events, a chain grocery store is scheduled to open in Midtown Detroit in the summer of
2013, and it is by no means an average Midwestern supermarket chain that is moving in. In fact, taking advantage
of $4.2 million in incentives (Duggan & Skid, 2011), the store that is opening is part of the world’s largest natural
and organic grocery chain: a Whole Foods Market (Aguilar, 2011). While the neighborhood context surrounding
this new business will be discussed further in Chapter 5, for now it can be ignored as it is not part of the 2011 food
source sample.
46. 31
and canned food, a deli, a freezer section, and a bakery.19
Spartan maintains a database of store
locations on their website (2013b), which I used to add these 40 supermarkets to my database.
An additional 22 supermarkets were identified through keywords in the source name of
supermarket and supermercado. An effort was made to check the size of these additional
sources by viewing them in Google Maps Street View to assess their size, presence of shopping
carts, and advertisements. Sources that appeared to be full-service supermarkets (large
building, parking lot, shopping carts, advertisements for produce and meat, etc.) were classified
as such.20
Data on supermarkets in Vancouver was collected manually through first visiting the
store locator pages of all major chain supermarkets in Vancouver21
(determined based on Tyghe
& Kobodi, 2012) and then adding any additional locations that came up in a Google Maps
search for ‘supermarket’. To ensure internal accuracy I checked for duplicates between the
manually-collected and SimpleGeo data, eventually resulting in 62 supermarkets in Detroit and
51 in Vancouver.
19
It is important to recognize that even full-service supermarkets in Detroit have been criticized for selling produce
and meat of sub-standard quality (see Devries & Linn, 2011).
20
Building on the use of big data in the SimpleGeo dataset, the method of verifying supermarket locations through
Google Street View comes with several advantages and disadvantages. An obvious advantage is the scope of
coverage: both cities had basically full coverage imagery, allowing remote exploration of the urban foodscape.
While fieldwork is irreplaceable for getting a feel for neighborhoods, being able to see an image of basically any
food source from the computer is truly remarkable. Detroit even has numerous locations that are part of Google’s
trial Business Photos program, where stores can pay a fee to have a virtual tour of the interior of their retail
locations added to Google Street View. With this option, potential customers can virtually walk right into retail
space from their computer. While this technology does provide a glimpse of faraway food retail, the image it
provides is of course limited. In addition to being susceptible to censorship and political sanitization (Power et al.,
2012), a more practical limitation of the technology is its static nature. Images for both cities were mostly taken in
2009, a full two years before the data from the SimpleGeo sample, making identification of sources that have
moved, closed, or opened problematic. Overall, however, this kind of technology offers another glimpse of how big
data is changing social science research.
21
Loblaw Companies Limited: Canadian Superstore, SuperValu, T & T Supermarket, and No Frills; Jim Pattison
Group: Buy-Low, Save-On-Foods and Urban Fare; Independent: Choices, Costco, Marketplace IGA, Nesters,
Safeway, Walmart, and Whole Foods.
47. 32
Efforts were also made to improve the accuracy of grocery store classifications to
distinguish between stores that carry fresh food and those that do not. The accuracy of the
data in this regard is important to the study’s overall goal of measuring a wider variety of food
source types. The exact classifications differed slightly for both cities to reflect differences in
the retail environment. In Detroit, the classes were convenience store, grocery store, party
store, and supermarket; in Vancouver, convenience store, grocery store, produce market, and
supermarket. The ‘party store’ is a fixture of the Detroit urban environment (see Chafets, 1990:
30-44). These small corner stores sell liquor, processed food, lottery tickets, and sometimes hot
food in the form of hot dogs (‘Coneys’ for Coney Island-style hot dog), fried chicken,
hamburgers, etc. While party stores make up a visible part of the urban foodscape in Detroit, in
my database they only accounted for 62 sources. I distinguished them from other stores
through two criteria: first, they had to be classified in the SimpleGeo dataset as ‘Food &
Beverages – Retail Goods – Liquor and Beverages’, i.e. establishments serving primarily as
liquor stores, instead of ‘Food & Beverages – Retail Goods – Groceries & Convenience Stores’,
i.e. establishments serving primarily as food stores. Secondly, sources from the Liquor and
Beverages category were only classified as party stores if they explicitly referenced being a
market, party store, grocery, or food source in their name, like Basil’s Party Store shown in
Figure 3. Looking for these keywords in the source name helped to exclude stores that only sell
liquor. Additionally, stores classified as ‘Food & Beverages – Retail Goods – Groceries &
Convenience Stores’ and also containing the keyword party were included.
48. 33
Figure 3. A typical Detroit party store. Photo Hawk (2010).
Sources from the ‘Food & Beverages – Retail Goods – Groceries & Convenience Stores’
or ‘Autos & Motor Vehicles – Retail Goods – Fuel & Gas Station’ SimpleGeo categories were
classified as convenience stores if they were part of chains associated with gas stations. This
form of classification was done by searching for several keywords in the source name. In
Detroit: BP, Convenience, Fill Up, Food Store (Valero), Fuel, Gas, Mini Mart, Minimart, News,
News Stand, Newstand, Petro, Petroleum, and Service Station; in Vancouver: 7-Eleven, 7-11,
Convenience, Esso, Food Store, Food Stop, Mac’s, Minimart, Mini Mart, Seven-Eleven, Shell,
Stop N’ Go, Town Pantry, and Quick Pick. Several convenience store sources were also added
from the ‘Shopping - Retail Goods – Tobacco’ SimpleGeo category that also matched these
keywords or contained the keyword News.
49. 34
Produce markets fill a specific retail niche in Vancouver, offering primarily fresh produce
in a small retail space along major arterial roads like Broadway (see Figure 4). These locations
Figure 4. A typical Vancouver produce market. Photo Hamilton (2005).
were also identified by keywords in the source name: fresh, fruit, Kin’s (for Kin’s Farm Market, a
chain of produce markets), market, produce, farm, farms, vegetable, and vegetables. While
some small corner store groceries in Detroit also sell fresh produce, they were harder to
identify by name and therefore produce store was not included as a category in the Detroit
data. It is also interesting to note that the SimpleGeo category used to classify produce stores in
Vancouver, ‘Food & Beverages – Retail Goods – Fruits & Vegetables’, did not have any entries in
Detroit.
50. 35
The final category in the food retail classification was grocery store, which was
comprised of the sources included in the SimpleGeo ‘Groceries & Convenience Stores’ category
that were not added to other classes based on keywords. These stores generally sell a mix of
fresh and processed food in a smaller, corner store format. However, due to the wide scope of
the ‘Groceries & Convenience Stores’ category and the necessarily narrow scope of the
keywords used to categorize convenience, party, and produce stores, an indeterminate amount
of these sources likely sell only processed food. This category was assigned to 242 sources in
Detroit and 162 in Vancouver, making it the most prevalent food retail source in both cities.
The final food source dataset
After successfully combining the SimpleGeo data with manually gathered data and
classifying food sources according to their type, the dataset of food source locations was nearly
complete.22
The final step involved grouping the 33 classifications into nine simpler categories
to ease interpretation. These categories were designed to capture important divisions in the
availability of fresh food, the scale, and the organizational goals of these food sources. The
count of sources for both cities is displayed in Table 5. This dataset represents a necessarily
limited, but ultimately useful sample of food sources in Vancouver and Detroit as of June 2011.
Conclusion
In this chapter I have presented my method for taking another approach to food desert
studies. My contribution makes several decisions that differ from most food access studies in
order to avoid some of the common problems – technical and socio-political – with the
epidemiological approach. First, the focus of my method is less on access and more on
22
The dataset of food sources used in this study is available for replication. Please contact the author directly.