

Recomendados
Recomendados
Más contenido relacionado
La actualidad más candente
La actualidad más candente (20)
Similar a Chart patterns final handout
Similar a Chart patterns final handout (20)
Más de wijitha gayan
Más de wijitha gayan (20)
Último
Último (20)
Chart patterns final handout
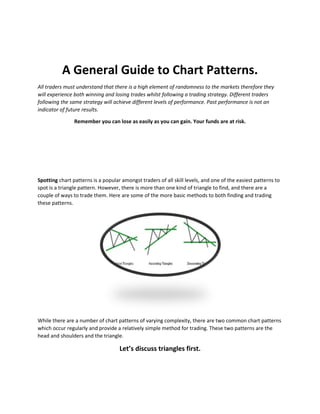
- 1. A General Guide to Chart Patterns. All traders must understand that there is a high element of randomness to the markets therefore they will experience both winning and losing trades whilst following a trading strategy. Different traders following the same strategy will achieve different levels of performance. Past performance is not an indicator of future results. Remember you can lose as easily as you can gain. Your funds are at risk. Spotting chart patterns is a popular amongst traders of all skill levels, and one of the easiest patterns to spot is a triangle pattern. However, there is more than one kind of triangle to find, and there are a couple of ways to trade them. Here are some of the more basic methods to both finding and trading these patterns. While there are a number of chart patterns of varying complexity, there are two common chart patterns which occur regularly and provide a relatively simple method for trading. These two patterns are the head and shoulders and the triangle. Let’s discuss triangles first.
- 2. What is an ascending triangle? The ascending triangles form when the price follows a rising trendline. However, the trend consolidates, failing to make new highs. Ascending triangles are considered to be continuation patterns. Therefore, a break of the resistance prompts a rally. The pattern is negated if the price breaks below the upward sloping trendline. The example below of the EUR/USD (Euro/U.S. Dollar) illustrates an ascending triangle pattern on a 30- minute chart. After a prolonged uptrend marked by an ascending trendline between A and B, the EUR/USD temporarily consolidated, unable to form a new high or fall below the support. The pair reverted to test resistance on three distinct occurrences between B and C, but it was incapable of breaking it. The ascending triangle pattern formed once a horizontal resistance and ascending support lines acted as buffers for the price action. Finally, EUR/USD breached resistance at E, signaling a potential bullish breakout. How can you trade ascending triangles? Typically, you want to buy after the pattern breaks resistance, as it did at E. It is good practice to set a stop-loss just below the last significant low, which in this example is at D. Look at the chart below, a continuation of the EUR/USD. Once the ascending triangle formation is formed, we wait for a confirmation candle to signal a breakout. Since the following candle (at F) continued to advance higher, we enter the position at 1.4160, while placing our stop-loss slightly below the previous significant low at 1.4110 (a 50-pip difference from the buy price).
- 3. The EUR/USD rallies upward in line with our desired direction. The pair advances roughly 100 pips before consolidating once more at G, providing us with a 2:1 reward-to-risk ratio. What is a descending triangle? Not surprisingly, the descending triangle is the opposite of the ascending triangle. It forms when the price follows a downward trendline and then consolidates, failing to make new lows or break a downward trendline. Descending triangles are considered continuation patterns. Therefore, a break in the support prompts the price to fall. The pattern is negated if the price breaks the downward sloping trendline.
- 4. The example above of the NZD/USD (New Zealand Dollar/U.S. Dollar) illustrates a descending triangle pattern on a five-minute chart. After a downtrend which followed a descending trendline between A and B, the pair temporarily consolidated between B and C, unable to make a new low. The pair reverted to test resistance on two distinct occurrences, but it was incapable of breaking out to the upside at D. The pattern formed a horizontal support while descending resistance lines acted as buffers for the price action. Finally, the NZD/USD breached the resistance at E, signaling a potential bearish breakdown. How can we trade descending triangles? Typically, you want to buy after the pattern breaks resistance, as it did at E. It is good practice to set a stop-loss just below the last significant high, which in this example is at D. Look at the chart below, which is a continuation of the NZD/USD chart above. Once the descending triangle formation is completed, we wait for a candle to breakout from the pattern, as it did at E. We sell short NZD/USD at 0.6375, while placing our stop-loss slightly above the previous significant high at 0.6405 (a 30-pip difference from the sell price). NZD/USD tumbles in our desired direction. The pair descends roughly 90 pips before consolidating once more at F, providing a 3:1 reward-to-risk ratio. Considering this is a five-minute chart, the profits and risks are generally smaller than if the pattern appeared on a larger timeframe. What is a symmetrical triangle? The pattern is identified by two discrete trendlines. The first trendline connects a series of lower peaks, while the second trendline connects a series of higher troughs.
- 5. Symmetrical triangles generally form during consolidation and the volatility tends to decline as the pattern progresses. Symmetrical triangles tend to be neutral and can signal either a bullish or a bearish situation. Therefore, a breakout from the pattern in either direction signals a new trend. The example above of the NZD/USD illustrates a symmetrical triangle formation on a 15-minute chart. After a rapid uptrend, the pair consolidated between A and B, unable to find a distinct trend. During the consolidating state, the pair continued to form a series of lower peaks and higher troughs. Volatility dropped off considerably, if compared to the beginning of the formation. Ultimately, the pattern ended when both of the trendlines came together at C. How can we trade symmetrical triangles? Since bias upon the conclusion of the pattern pointed higher, we look for an opportunity to buy the pair. Given the candle following the conclusion of the trend rallied at D, we bought NZD/USD at 0.6240. We place our stop-loss slightly below the most recent significant low at 0.6215 (a 25-pip difference from the buy price). The pair continued to consolidate prior to rallying approximately 80 pips at E. Considering this is a 15-minute chart, the profits and risks are generally smaller than if the pattern appeared on a larger timeframe.
- 6. Let’s move onto The Head & Shoulders Pattern (and of course its inverse) This is not only my favorite reversal pattern, but it is also my favorite pattern, period. That includes its inverse, which has similar mannerisms. For those who have followed me for a while now, you may recall that my favorite pattern to trade used to be the wedge. However, the last year of trading has produced a new winner in my book. The head and shoulders is the least common of the three formations we will discuss today. While there may be similar price structures that occur more frequently, a valid and therefore tradable head and shoulders reversal doesn’t come around very often. The head and shoulders chart pattern is a highly reliable reversal configuration which provides trading signals that are often used by foreign exchange traders. The head and shoulders pattern features three price spikes: one head exceeds past the two shoulders which have approximately the same height, and the two lows are connected by a "neckline". Transaction volumes are generally very high on the first shoulder, then they gradually decrease during the formation of the head and the second shoulder. The low volumes of the right shoulder indicate a probable reversal of prices. The higher the head is, the more reliable the pattern will be. The probability of a reversal will be greater when the currency price crosses the neckline support level. This chart pattern also exists in a downtrend (an inverted head and shoulders), but it is considered more reliable in an uptrend.
- 7. Why Should You Trade It? Put simply, it works. But more than that, it can be quite easy to spot and extremely profitable when you know what to look for and how to trade it. The pattern can offer a precise entry given the fact that the neckline is generally based on several highs or lows. This fact alone takes a lot of the guesswork out of determining when the pattern has confirmed. Another huge benefit, like the other two technical formations below, is that we have a measured objective from which to identify a possible target. What Do You Need to Know? This is something that you may not know. In order to be considered valid, the two shoulders of the pattern must overlap at some point. Situations where the shoulders don’t overlap are most common when the pattern unfolds at a steep angle. While a break of the trend line (if one exists) may trigger a change in trend, it does not fit the criteria to be called, or traded as, a head and shoulders pattern.
- 8. Notice how no part of the first shoulder in the illustration above overlaps the second shoulder. This disqualifies the price structure from being traded as a head and shoulders pattern. Another common mistake among Forex traders is to use a measured objective as a “one-stop shop.” In other words, they simply measure out the distance in pips and then set a pending order to book profits at that level. While that may occasionally work out in your favor, a much better approach is to determine whether or not that objective lines up with a pre-existing key level. If it does, perfect, however a more common scenario is one where the market will come in contact with a key level prior to reaching the objective. If this is the case, you’re far better off taking profit at the key level rather than hoping for an extended move to the objective. Remember that technical analysis is not a perfect science and there are no
- 9. guarantees, so there’s no sense to risk losing an unrealized gain of 500 pips in order to make an extra 50 pips in profit. Last but not least, the head and shoulders is best traded on the 4-hour chart or higher. However, I have found that the best price structures tend to form on the daily time frame. A formation on the 1-hour chart or lower should always be ignored, regardless of how well-defined the structure may be. Let me explain while referring to chart above: • Sellers come in at the highs (left shoulder) and what happens is that the downside is probed (which results in a beginning neckline). • What happens next is that buyers soon return to the market and push prices to new highs (the head). • However, the new high (head) is not sustained as price falls back down due to sellers pushing price down to create a continuing neckline. • Buyers enter again pushing the price up to a high, but this high does not exceed the previous high (the head). This high is the right shoulder. • Sellers get in and push the price down and this time the neckline is intersected • Buyers may get in here and push price up to test the neckline that was intersected which would now act as a resistance. • Sellers get in push the price down.
- 10. There are two options on how you can trade the head and shoulder pattern: Option 1 Wait for a candlestick to break to break the neckline to the downside. Then place a sell stop order just a few pips (3-5 pips at least) under the low of the candlestick. Place you stop loss 3-5 pips above the high of the right shoulder. Option 2 Once price breaks the neckline, just wait for price to rally back up to touch the neckline which it intersected. This intersected neckline would now act as a resistance line. Once it touches the neckline, place a sell stop order 3-5 pips under the low of the candlestick that touches the neckline. Place you stop loss anywhere from 10-50 pips (depending on which timeframe you are trading in) just above where your sell stop order is placed. Try to use reversal candlestick patterns as your short entry confirmation on this option 2 entry style. Many chart patterns There are literally hundreds of different chart patterns available to traders. With so many patterns to choose from, it’s little wonder why so many traders become confused as to which chart patterns are best to trade. Among the hundreds of patterns available, there are a few that you need to know in order to increase your odds of success as a trader. We have discussed these above, but you should be aware of all the patterns. The 3 Main Groups of Chart Patterns Reversal Chart Patterns Reversal patterns are those chart formations that signal that the ongoing trend is about to change course. If a reversal chart pattern forms during an uptrend, it hints that the trend will reverse and that the price will head down soon.
- 11. Conversely, if a reversal chart pattern is seen during a downtrend, it suggests that the price will move up later on. These include: • Double Top • Double Bottom • Head and Shoulders • Inverse Head and Shoulders • Rising Wedge • Falling Wedge Continuation Chart Patterns Continuation chart patterns are those chart formations that signal that the ongoing trend will resume. Usually, these are also known as consolidation patterns because they show how buyers or sellers take a quick break before moving further in the same direction as the prior trend. We’ve covered several continuation chart patterns, namely the wedges, rectangles, and pennants. Note that wedges can be considered either reversal or continuation patterns depending on the trend on which they form.
- 12. Bilateral Chart Patterns Bilateral chart patterns are a bit trickier because these signal that the price can move either way. This is where triangle formations fall in. Remember when we discussed that the price could break either to the topside or downside with triangles? To play these chart patterns, you should consider both scenarios (upside or downside breakout) and place one order on top of the formation and another at the bottom of the formation. If one order gets triggered, you can cancel the other one. Either way, you’d be part of the action. Double the possibilities, double the fun! The only problem is that you could catch a false break if you set your entry orders too close to the top or bottom of the formation.
- 13. Entry Exit & Target Levels When a breakout eventually occurs, it is likely to provoke a price move equal to the size of the pattern. Therefore, you should carefully identify a potential breakout in the upper and the lower level of the symmetrical triangle in order to take the right position in the market. The sketch below illustrates the symmetrical triangle formation and possible breakout scenarios: As you see from the example above, the potential target is based on the size of the formation. With this type of measured move analysis, you will know what to expect from the breakout, whether it breaks upwards, or downwards. When calculating the second target, you would analyze the price leg immediately following the pennant. You could set the target to 1:1 of the previous leg or .618 of that leg. When the trend seems strong and has a steep slope a 1:1 measured move would be an appropriate second target, and in all other cases the .618 of the leg could be used.
- 14. PLEASE BE AWARE, THESE ABOVE INFORMATION IS A GUIDE AND GENERAL KNOWLEDGE AND NOT TRADING ADVICE. YOU NEED TO CONDUCT GREATER RESEARCH AND PRACTICE. REMEMBER YOU CAN LOSE AS MUCH AS YOU CAN PROFIT. ALWAYS USE GOOD MONEY MANAGEMENT AND RISK
- 15. MANAGEMENT ANALYSIS. IF YOU ARE NOT SURE, SIT ON THE SIDELINES AND SEEK PROFESSIONAL HELP AND PRACTICE WITH A DEMO ACCOUNT. ALL TRADERS MUST UNDERSTAND THAT THERE IS A HIGH ELEMENT OF RANDOMNESS TO THE MARKETS THEREFORE THEY WILL EXPERIENCE BOTH WINNING AND LOSING TRADES WHILST FOLLOWING A TRADING STRATEGY. DIFFERENT TRADERS FOLLOWING THE SAME STRATEGY WILL ACHIEVE DIFFERENT LEVELS OF PERFORMANCE. PAST PERFORMANCE IS NOT AN INDICATOR OF FUTURE RESULTS.