SlideShare una empresa de Scribd logo
1 de 3
Descargar para leer sin conexión
Arabian Cement Company
Egypt
Equities | Technical Call
Sunday, 23 October 2016
The riptide
Arabian Cement Company (ARCC.EGX)has recently been one of the underperformers
in the short and medium terms. It is moving in a clear down trend, declining from 19.00
in February 2015 all the way down to 4.25. This downtrend is s ll intact and stepping in
would be very risky; however, hereunder we will shed some light on how the bears are
weakening after dominating for 20 months.
Weekly Chart
Last week’s transac ons ended with a ‘doji’ pa ern, where ARCC was able to close
barely at the open prices a er it had declined to reach 4.25. This points to an
equilibrium between bulls and bears.
Prices have been hovering between the lower and mid bands of the ’Bollinger Bands’,
and reaching the lower band usually leads to a rebound.
Both ‘Price Oscillator’ and ’RSI’ (the second and third panels) have been recording
higher readings over the last eight months, compared to prices which con nued to form
lower lows. Also, ‘RSI’ and ‘Stochas cs Oscillator’ (the third and fourth panels) have
reached an oversold zone.
Daily Chart
Prices have reached the parallel line to the downtrend; not only that, they even skid
underneath. Then they managed to proofread their path and re-enter the falling channel.
On a smaller scale, ARCC broke above the downtrend line that was formed earlier this
month, coinciding with the RSI rebounding from an oversold area (the second panel),
positively diverging with the prices.
‘MACD’ (third panel) just generated a ‘buy’ signal. However, this does not change the
fact that the downtrend is s ll intact, unless it breaks above the zero line, which it could
not do last September. On the other hand, ‘MACD’ successfully spo ed the upward
correction from 6.20 to 7.20 last July.
Conclusion
ARCC is totally controlled by bears, and stepping in is associated with high risk. Despite
that, we believe those bears’ power is becoming slender, and in a few weeks we may
witness a trend reversal. Hence, we recommend gradual accumula on, knowing that
slipping below 4.00 calls for a ‘stop loss’, and our target lies between 5.70 -6.00.
Shahd Raa'fat, CMT
Senior Technical Analyst
MubasherTrade
Shahd.Raafat@MubasherFS.com
This report is issued by Mubasher Financial Services BSC (c) is an Investment
Business Firm Category 1, licensed and regulated by the Central Bank of Bahrain.
Report is subject to disclosure and disclaimer mentioned here.
INSTITUTIONAL SALES
MENA
Inst.Sales@MubasherFS.com
+971 43211167 (UAE)
Egypt
Institutions-Egy@Mubasher.net
+202 22623310
RETAIL SALES
Bahrain
Global@MubasherTrade.com
Call Center:
+973 173 00 849
Egypt
Egypt@MubasherTrade.com
Call Center:
16699 / +202 2262 3230
RESEARCH
Research Team
Research@MubasherTrade.com
Copyright ©2016, Mubasher Financial Services BSC (MFS), ALL RIGHTS RESERVED. No
part or excerpt of this document may be redistributed, reproduced, stored in a
retrieval system, or transmitted, on any form or by any means, electronic, mechanical,
photocopying, recording, or otherwise, without the prior written permission of MFS.
MubasherTrade is a trademark of Mubasher Financial Services BSC. Mubasher
Financial Services BSC (c) is an Investment Business Firm Category 1, licensed and
regulated by the Central Bank of Bahrain.

Más contenido relacionado

Similar a ARCC

5 January Daily technical trader
5 January Daily technical trader 5 January Daily technical trader
5 January Daily technical trader QNB Group
 
17 November Daily Technical Trader
17 November Daily Technical Trader17 November Daily Technical Trader
17 November Daily Technical TraderQNB Group
 
30 June Daily technical trader
30 June Daily technical trader 30 June Daily technical trader
30 June Daily technical trader QNB Group
 
5 February Daily technical trader
5 February Daily technical trader 5 February Daily technical trader
5 February Daily technical trader QNB Group
 
29 June Daily technical trader
29 June Daily technical trader 29 June Daily technical trader
29 June Daily technical trader QNB Group
 
17 June Daily technical trader
17 June Daily technical trader 17 June Daily technical trader
17 June Daily technical trader QNB Group
 
QNBFS Daily Technical Trader - Qatar May 23, 2016
QNBFS Daily Technical Trader - Qatar May 23, 2016QNBFS Daily Technical Trader - Qatar May 23, 2016
QNBFS Daily Technical Trader - Qatar May 23, 2016QNB Group
 
11 September Daily Technical Trader
11 September Daily Technical Trader11 September Daily Technical Trader
11 September Daily Technical TraderQNB Group
 
27 April Daily technical trader
27 April Daily technical trader27 April Daily technical trader
27 April Daily technical traderQNB Group
 
2 July Daily technical trader
2 July Daily technical trader 2 July Daily technical trader
2 July Daily technical trader QNB Group
 
29 January Daily technical trader
29 January Daily technical trader29 January Daily technical trader
29 January Daily technical traderQNB Group
 
26 September Daily Technical Trader
26 September Daily Technical Trader26 September Daily Technical Trader
26 September Daily Technical TraderQNB Group
 
19 October Daily technical trader
19 October Daily technical trader 19 October Daily technical trader
19 October Daily technical trader QNB Group
 
29 June Daily technical trader
29 June Daily technical trader 29 June Daily technical trader
29 June Daily technical trader QNB Group
 
31 August Daily technical trader
31 August Daily technical trader 31 August Daily technical trader
31 August Daily technical trader QNB Group
 
21 September Daily technical trader
21 September Daily technical trader21 September Daily technical trader
21 September Daily technical traderQNB Group
 
10 September Daily technical trader
10 September Daily technical trader10 September Daily technical trader
10 September Daily technical traderQNB Group
 
11 January Daily technical trader
11 January Daily technical trader 11 January Daily technical trader
11 January Daily technical trader QNB Group
 
22 August Daily Technical Trader
22 August Daily Technical Trader22 August Daily Technical Trader
22 August Daily Technical TraderQNB Group
 
25 November Daily technical trader
25 November Daily technical trader 25 November Daily technical trader
25 November Daily technical trader QNB Group
 

Similar a ARCC (20)

5 January Daily technical trader
5 January Daily technical trader 5 January Daily technical trader
5 January Daily technical trader
 
17 November Daily Technical Trader
17 November Daily Technical Trader17 November Daily Technical Trader
17 November Daily Technical Trader
 
30 June Daily technical trader
30 June Daily technical trader 30 June Daily technical trader
30 June Daily technical trader
 
5 February Daily technical trader
5 February Daily technical trader 5 February Daily technical trader
5 February Daily technical trader
 
29 June Daily technical trader
29 June Daily technical trader 29 June Daily technical trader
29 June Daily technical trader
 
17 June Daily technical trader
17 June Daily technical trader 17 June Daily technical trader
17 June Daily technical trader
 
QNBFS Daily Technical Trader - Qatar May 23, 2016
QNBFS Daily Technical Trader - Qatar May 23, 2016QNBFS Daily Technical Trader - Qatar May 23, 2016
QNBFS Daily Technical Trader - Qatar May 23, 2016
 
11 September Daily Technical Trader
11 September Daily Technical Trader11 September Daily Technical Trader
11 September Daily Technical Trader
 
27 April Daily technical trader
27 April Daily technical trader27 April Daily technical trader
27 April Daily technical trader
 
2 July Daily technical trader
2 July Daily technical trader 2 July Daily technical trader
2 July Daily technical trader
 
29 January Daily technical trader
29 January Daily technical trader29 January Daily technical trader
29 January Daily technical trader
 
26 September Daily Technical Trader
26 September Daily Technical Trader26 September Daily Technical Trader
26 September Daily Technical Trader
 
19 October Daily technical trader
19 October Daily technical trader 19 October Daily technical trader
19 October Daily technical trader
 
29 June Daily technical trader
29 June Daily technical trader 29 June Daily technical trader
29 June Daily technical trader
 
31 August Daily technical trader
31 August Daily technical trader 31 August Daily technical trader
31 August Daily technical trader
 
21 September Daily technical trader
21 September Daily technical trader21 September Daily technical trader
21 September Daily technical trader
 
10 September Daily technical trader
10 September Daily technical trader10 September Daily technical trader
10 September Daily technical trader
 
11 January Daily technical trader
11 January Daily technical trader 11 January Daily technical trader
11 January Daily technical trader
 
22 August Daily Technical Trader
22 August Daily Technical Trader22 August Daily Technical Trader
22 August Daily Technical Trader
 
25 November Daily technical trader
25 November Daily technical trader 25 November Daily technical trader
25 November Daily technical trader
 

ARCC

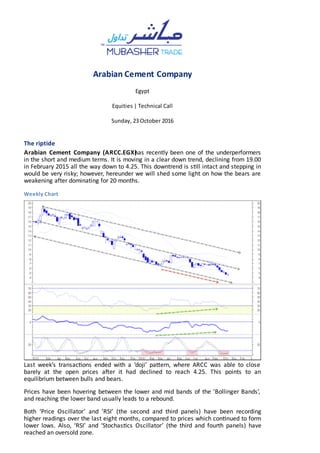
  • 1. Arabian Cement Company Egypt Equities | Technical Call Sunday, 23 October 2016 The riptide Arabian Cement Company (ARCC.EGX)has recently been one of the underperformers in the short and medium terms. It is moving in a clear down trend, declining from 19.00 in February 2015 all the way down to 4.25. This downtrend is s ll intact and stepping in would be very risky; however, hereunder we will shed some light on how the bears are weakening after dominating for 20 months. Weekly Chart Last week’s transac ons ended with a ‘doji’ pa ern, where ARCC was able to close barely at the open prices a er it had declined to reach 4.25. This points to an equilibrium between bulls and bears. Prices have been hovering between the lower and mid bands of the ’Bollinger Bands’, and reaching the lower band usually leads to a rebound. Both ‘Price Oscillator’ and ’RSI’ (the second and third panels) have been recording higher readings over the last eight months, compared to prices which con nued to form lower lows. Also, ‘RSI’ and ‘Stochas cs Oscillator’ (the third and fourth panels) have reached an oversold zone.
  • 2. Daily Chart Prices have reached the parallel line to the downtrend; not only that, they even skid underneath. Then they managed to proofread their path and re-enter the falling channel. On a smaller scale, ARCC broke above the downtrend line that was formed earlier this month, coinciding with the RSI rebounding from an oversold area (the second panel), positively diverging with the prices. ‘MACD’ (third panel) just generated a ‘buy’ signal. However, this does not change the fact that the downtrend is s ll intact, unless it breaks above the zero line, which it could not do last September. On the other hand, ‘MACD’ successfully spo ed the upward correction from 6.20 to 7.20 last July. Conclusion ARCC is totally controlled by bears, and stepping in is associated with high risk. Despite that, we believe those bears’ power is becoming slender, and in a few weeks we may witness a trend reversal. Hence, we recommend gradual accumula on, knowing that slipping below 4.00 calls for a ‘stop loss’, and our target lies between 5.70 -6.00. Shahd Raa'fat, CMT Senior Technical Analyst MubasherTrade Shahd.Raafat@MubasherFS.com This report is issued by Mubasher Financial Services BSC (c) is an Investment Business Firm Category 1, licensed and regulated by the Central Bank of Bahrain. Report is subject to disclosure and disclaimer mentioned here.
  • 3. INSTITUTIONAL SALES MENA Inst.Sales@MubasherFS.com +971 43211167 (UAE) Egypt Institutions-Egy@Mubasher.net +202 22623310 RETAIL SALES Bahrain Global@MubasherTrade.com Call Center: +973 173 00 849 Egypt Egypt@MubasherTrade.com Call Center: 16699 / +202 2262 3230 RESEARCH Research Team Research@MubasherTrade.com Copyright ©2016, Mubasher Financial Services BSC (MFS), ALL RIGHTS RESERVED. No part or excerpt of this document may be redistributed, reproduced, stored in a retrieval system, or transmitted, on any form or by any means, electronic, mechanical, photocopying, recording, or otherwise, without the prior written permission of MFS. MubasherTrade is a trademark of Mubasher Financial Services BSC. Mubasher Financial Services BSC (c) is an Investment Business Firm Category 1, licensed and regulated by the Central Bank of Bahrain.