1. EXCESS
ADEQUATE
ADEQUATE
EXCESS
42 May/June 2015
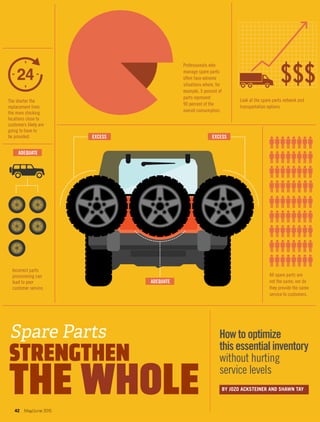
Howtooptimize
thisessentialinventory
without hurting
service levels
BY JOZO ACKSTEINER AND SHAWN TAY
The shorter the
replacement time,
the more stocking
locations close to
customers likely are
going to have to
be provided.
Look at the spare parts network and
transportation options.
Professionals who
manage spare parts
often face extreme
situations where, for
example, 5 percent of
parts represent
90 percent of the
overall consumption.
All spare parts are
not the same; nor do
they provide the same
service to customers.
Incorrect parts
provisioning can
lead to poor
customer service.
Spare Parts
STRENGTHEN
THE WHOLE
2. apics.org/magazine 43
I
t’s crucial for spare parts supply chains to have the necessary
inventory at the right time and right place to meet customer
service performance expectations. Inventory reduction
initiatives therefore typically are considered off-limits in
the after-sale-support supply chain. However, the following
strategies make it possible to identify opportunities for optimization,
significantly reduce inventory, and maintain service levels.
Spare parts services impose lofty requirements on supply chain
professionals. The need for service typically arises when a customer
is facing an emergency—often one in which a product does not work
and there is an urgent need for replacement parts. Providing them
quickly can be costly, particularly if there are hundreds or thousands
of items with low turnover.
Inventory is a deciding factor for both service quality and cost.
Having stock in place guarantees that a needed part is available in a
timely manner. But the cost of holding spare parts inventory can be
huge—sometimes significantly higher than the original item value—
and it may not generate any revenue for the business.
The authors have analyzed numerous spare parts supply chains and
discovered that inventory levels often are misallocated. Sometimes,
there is insufficient or incorrectly positioned inventory for critical or
high-demand parts, which causes customer dissatisfaction. Other times,
fear of poor service levels results in bloated inventories. Meanwhile,
inventory is seen as too revered to question. Some supply chain
managers even claim that, despite company-wide inventory reduction
targets, spare parts inventory should be increased.
Such situations demand change and improvement. Analytics can
help establish more logical inventory levels and ensure that spare parts
supply chains are appropriately arranged.
FOUR MYTHS
There are four myths in spare parts supply chains that must be
busted in order to apply proper analytics and reach inventory-
improvement goals.
Myth 1: All spare parts are equal. All spare parts are not the same;
nor do they provide the same service to customers. This fallacy is a
major driver of inefficient spare parts supply chains and misallocation
of parts inventory. Furthermore, incorrect parts provisioning can lead
to poor customer service.
Different parts have different effects on overall service perfor-
mance. There are three major factors that distinguish the importance
of a spare part to the customer: criticality of the part, contractual
obligation for providing the part, and demand for the part. Managers
must take these factors into consideration as they plan for parts
provisioning. First, criticality describes the importance of the part to
keeping a product running. For example, an industrial printer can
run with a dented panel, but not with a worn out drive motor com-
ponent. Criticality influences the urgency of needing the part and,
therefore, stocking quantity and proximity to the customer.
Next, contractual obligation deals with the service commitment
to the customer. The contract determines the service that is required
for a product. The metrics that have the greatest impact on spare part
stocking requirements are as follows:
• Reaction and replacement time in which the organization com-
mits to providing a part: The shorter the replacement time, the
more stocking locations close to customers likely are going to
have to be provided.
• Committed service level: This often is measured through the
percentage of parts that are delivered on time. The higher the
committed service level, the more inventory needs to be provided
to avoid stockouts.
Lastly, demand for the number of parts consumed and the pattern
of consumption must be well-thought-out. The impact of part demand
on overall spare parts supply chain performance often is underesti-
mated. The number of parts needed to service a product can easily go
into the hundreds or thousands. However, part demand distribution
might be uneven.
Professionals who manage spare parts often face extreme situations
where, for example, 5 percent of parts represent 90 percent of the over-
all consumption. This means that a very tiny number of parts are driv-
ing the bulk of service and supply chain performance. After all, if 5
percent of the parts contribute to 90 percent of supply chain functions,
then a whopping 95 percent affect only 10 percent of performance.
Myth 2: Inventory-related costs are unimportant. Frequently,
inventory-related spare parts costs are unclear. This often results in
these costs being underestimated. Over the potentially long holding
time of a spare part, these expenses really add up. For instance, if
inventory-related costs are 10 percent of the parts price each year, and
the profit margin on service parts is 10 percent, then holding a compo-
nent for one year will consume that part’s entire profit.
For low-running parts, holding time can be several years before the
item is actually used. But no matter how low the volume, there must be
at least one unit available to ensure serviceability. Therefore, the days
of inventory of such low-running parts, calculated by average stock
divided by demand, are extremely high. The inventory-related costs
skyrocket, easily exceeding the value of the part.
Myth 3: Every product sale is a good sale. Another common issue
is considering the selling of a product independently of the after-sales
The cost of holding spare parts inventory
can be huge—sometimes significantly higher
than the original item value.
3. service commitment. This can result in a significant loss, particularly
if the error is combined with the underestimation of inventory costs,
as described in the previous section.
Myth 4: Inventory reduction always results in poorer service
levels. The last myth is the belief that reducing inventory will always
result in higher stockouts and lower service levels. This concept proves
to be true when taking into account only one individual part. However,
on an aggregated level—when considering overall inventory and service
level performance—there may be different results. Stock distribution
can be so ineffective that reducing inventory improves service.
Low-volume parts tend to be over-stocked, while high-volume
parts have insufficient inventory. In such cases, inventory rebalancing
achieved by eliminating low-volume parts and allocating more of the
budget to high-volume parts is worthwhile. It is possible to significantly
raise service levels on those high-volume parts and, thus, increase
overall service while trading off a minimal impact on low-volume parts.
SPARE PARTS INVENTORY CONTROL
To address these challenges, it’s first necessary to acknowledge that a
100 percent customer service level is not achievable. As most businesses
near 100 percent, the costs begin to rise exponentially as inventory
levels climb. The right approach is to decide what service level is right
for the company and how to achieve it most effectively. Use Pareto anal-
ysis on parts demand to better understand the portfolio. (See Figure
1.) Which parts make up the bulk of the demand and hence have the
highest impact on service? These items are the key to success.
In addition, it’s important to know where the insignificance barrier
lies. This is the point where demand of parts is so small that, for the
considered timeframe, it’s impossible to predict if demand will be
zero or just close to zero. Note that it is unfeasible to prioritize such
parts based on their forecast volume. Parts with volume falling below
this barrier should be deprioritized for inventory holding unless they
are critical to the operations of a product or if there is a contractual
obligation to provide the item.
Next, identify the root causes behind service-level misses by con-
ducting a thorough analysis of past failures. Were requests left unful-
filled because the parts were unavailable? If so, this points to a flawed
inventory policy. Or perhaps parts were available, but there were other
issues, such as poor logistics network performance? Such a scenario
reveals a supply chain obstacle beyond spare parts inventory. Figure
2 illustrates a company whose service-level misses mostly result from
stockouts—largely high-demand parts. This would be an easy fix, as
stocking more high runners does not require much inventory.
If it is determined that service-level failures are being driven by insuf-
ficient spare parts inventory, it’s time to improve inventory distribution.
As mentioned previously, not all parts are equal. Thus, it is advisable
to segment inventory into two dimensions: service commitment and
volume. Focus attention on providing the appropriate inventory for the
highest-volume parts and items requiring the greatest service commit-
ment. Target inventory reduction efforts at the parts with low demand
and low service commitment—or find stocking alternatives.
However, parts segmentation alone cannot optimize inventory.
While it is helpful to set a general
stocking strategy, each part needs to
be evaluated individually. Ask ques-
tions such as if the part is important
for a new product introduction or if
there are contractual obligations to
stock a specific part.
Next, consider alternatives to
stocking. One option is to use
expedited shipments. Look at the
spare parts network and trans-
portation options. Would the cost
of express shipment from cen-
tral locations outweigh the cost
of holding inventory? A second
possibility for critical parts is to
stock them on-site at the customer
facility. Three-dimensional printing
may be applicable, as well. Several
industries are running pilots to test
this alternative to parts stocking.
Another option is to leverage
low-running parts across several
regions. If regional demand for the
items is low, then cross-regional
44 May/June 2015
100%
90%
80%
70%
60%
50%
40%
30%
20%
10%
0%
PERCENTOFCONSUMPTION
HIGH RUNNERS 2 PERCENT OF PARTS, 80 PERCENT OF VOLUME
MEDIUM RUNNERS 3 PERCENT OF PARTS, 10 PERCENT OF VOLUME
LOW RUNNERS 90 PERCENT OF PARTS, 10 PERCENT OF VOLUME
0% 10% 20% 30% 40% 50% 60% 70% 80% 90% 100%
INSIGNIFICANCE BARRIER
Figure 1: Pareto analysis of serviced parts
SPARE PARTS STRENGTHEN THE WHOLE
4. apics.org/magazine 45
demand might be a good lever. Of course, such parts may require
expedited shipments to meet service commitments.
Finally, collaboration between sales and operations is crucial to
ensuring effective inventory allocation. Total product profitability
does not stop at revenue minus cost of goods; rather, the expenses
associated with providing support throughout an item’s service life
cycle must be considered when determining whether and how a
product is brought to market.
Jozo Acksteiner is a strategy and analytics manager for Hewlett-Packard’s
Strategic Planning and Modeling group in Singapore. He also is an
associate professor in the department of Industrial and Systems
Engineering at the National University of Singapore and the founder of
geolyx.com, a geographical analytics solutions provider. Acksteiner may
be contacted at jozo.acksteiner@hp.com.
Shawn Tay is a strategy and analytics manager for Hewlett-Packard’s
Strategic Planning and Modeling group in Singapore. He has almost 20
years of industry experience, and previously worked for Deloitte Consulting’s
supply chain practice, Wal-Mart, Safeway, and the Tibbett and Britten group
(now a part of DHL-Exel). Tay may be contacted at shawn.tay@hp.com.
To comment on this article, send a message to feedback@apics.org.
Figure 2: Sample hit-or-miss analysis and detailed breakdown of stockouts
HIT RATE POTENTIAL IF ALL STOCKOUTS ARE AVOIDED
Miss
Hit
100
Total Stockout Logistics Information
Technology/Other
7
2 1
90
10
97
HIGH RUNNERS 76 PERCENT
MEDIUM RUNNERS 8 PERCENT
LOW RUNNERS 16 PERCENT
Register at apics.org/extralive.
APICS Extra Live: Optimize Spare Parts Inventory and Service Levels
Attend this APICS Extra Live to gain deeper insight into the May/June article
“Spare Parts Strengthen the Whole.” The authors will reveal how it is possible
to significantly reduce inventory while preserving service-level expectations
in spare parts supply chains.
Participants will discover
̥ a proven strategy for analyzing and improving spare parts supply chains
̥ effective techniques for meeting customer requirements
̥ essential inventory lessons and concepts in after-sale support.
Presented by:
Jozo Acksteiner
Strategy and Analytics Manager
Hewlett-Packard
Shawn Tay
Strategy and Analytics Manager
Hewlett-Packard
Date: June 4, 2015
Time: 9:00 a.m. Central