
Recomendados
Más contenido relacionado
La actualidad más candente
La actualidad más candente (20)
Destacado
Destacado (18)
Similar a Portfolio
Similar a Portfolio (20)
Portfolio
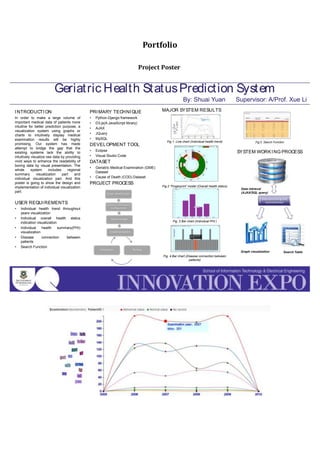
- 1. Portfolio Project Poster INTRODUCTION In order to make a large volume of important medical data of patients more intuitive for better prediction purpose, a visualization system using graphs or charts to intuitively display medical examination results will be highly promising. Our system has made attempt to bridge the gap that the existing systems lack the ability to intuitively visualize raw data by providing vivid ways to enhance the readability of boring data by visual presentation. The whole system includes regional summary visualization part and individual visualization part. And this poster is going to show the design and implementation of individual visualization part. USER REQUIREMENTS • Individual health trend throughout years visualization • Individual overall health status indication visualization • Individual health summary(PHI) visualization • Disease connection between patients • Search Function Geriatric Health StatusPrediction System By: Shuai Yuan Supervisor: A/Prof. Xue Li PRIMARY TECHNIQUE • Python-Django framework • D3.js(A JavaScript library) • AJAX • JQuery • MySQL DEVELOPMENT TOOL • Eclipse • Visual Studio Code DATASET • Geriatric Medical Examination (GME) Dataset • Cause of Death (COD) Dataset PROJECT PROCESS MAJOR SYSTEM RESULTS Fig 1. Line chart (Individual health trend) Fig.2 “Fingerprint” model (Overall health status) Fig. 3 Bar chart (Individual PHI ) Fig. 4 Bar chart (Disease connection between patients) Fig.5 Search Function SYSTEM WORKING PROCESS Implementation TestingEvaluation Scope Identification System Environment Configuration System Design Data retrieval (AJAX/SQL query) Graph visualization Search Table Data processing and reconstruction