SlideShare una empresa de Scribd logo
1 de 10
Descargar para leer sin conexión
2010/6/8


          Trade Fairs in Asia:

 Results of the 6th annual survey


                Prepared by Business Strategies Group Ltd.

                              4th June 2010


           Report background
• Prepared by BSG since 2004
• Published jointly with UFI
• Draws on BSG’s exhibition database
  developing since 2001
• Covers 15 key markets in Asia
• Focuses on B2B exhibitions >2,000 sqm
• Excludes B2C events


4th June 2010                      v1.0                      2


                                                                       1
2010/6/8


Highlights of 2009 Trade Fair
   Industry in Asia Report
• Nearly 1800 exhibitions identified

• 14.9 mil m2 sold in 2009 – up 3.8%

• 5% of that space was sold in India

• Revenues US$3.41 billion – flat y-on-y

• 5% of revenues generated in India
4th June 2010                            v1.0                                        3


   Top 5 markets ranked by net size
                            Estimated annual size in m2

     9,000,000
     8,000,000
     7,000,000
     6,000,000
     5,000,000                                            Estimated annual size in
     4,000,000                                            m2
     3,000,000
     2,000,000
     1,000,000
             0
                 China   Japan   Hong   Korea   India
                                 Kong


4th June 2010                            v1.0                                        4


                                                                                               2
2010/6/8


     Top 5 y-on-y change in
            net size
                       Estimated size 2008 vs. 2009 in % change

   50%
   45%
   40%
   35%
   30%
                                                                 Estimated size 2008 vs.
   25%
                                                                 2009 in % change
   20%
   15%
   10%
    5%
    0%


                                                           an
                        a


                                                 a
            au


                                  sia
                      in


                                              re


                                                         iw
         ac


                   Ch


                                            Ko
                               ay


                                                       Ta
      M


                             al
                            M


4th June 2010                                         v1.0                                 5


  Change in net size: ’09 vs. ‘05

                     Top 5 exhibition space sold % change

     140%
     120%
     100%
      80%                                                        Estimated size 2005 vs.
      60%                                                        2009 in % change
      40%
      20%
       0%
                                       nd
                        na


                                                            ng
               m


                                                  n
                                               ta
             na


                        i


                                     la


                                                         Ko
                     Ch


                                              kis
                                  ai
           et


                                                        ng
                                Th


                                            Pa
         Vi


                                                     Ho


4th June 2010                                         v1.0                                 6


                                                                                                     3
2010/6/8


 Growth in Asia 2005-2009
                                   16,000,000

                                   14,000,000
     Estimated annual size in m2


                                   12,000,000

                                   10,000,000

                                    8,000,000

                                    6,000,000

                                    4,000,000

                                    2,000,000

                                           0
                                                2005   2006          2007   2008   2009


4th June 2010                                                 v1.0                        7


Change in U.S. 2000-2009


4th June 2010                                                 v1.0                        8


                                                                                                    4
2010/6/8


4th June 2010                              v1.0                                   9


 Markets ranked by revenues
                         Top 5 markets by revenues 2009

    1,200,000,000
    1,000,000,000
      800,000,000
                                                          Estimated annualised
      600,000,000
                                                          revenues (US$)
      400,000,000
      200,000,000
                0
                    na


                                     ng
                            n


                                               a

                                                    lia
                          pa


                                            re
                   i


                                  Ko


                                                    ra
                Ch


                                          Ko
                         Ja


                                                 st
                                 ng


                                               Au
                              Ho


4th June 2010                              v1.0                                  10


                                                                                            5
2010/6/8


  Markets ranked by capacity
                              Top 5 markets by capacity

     4,500,000
     4,000,000
     3,500,000
     3,000,000
     2,500,000                                                         2010 Total gross indoor
     2,000,000                                                         size in m2
     1,500,000
     1,000,000
       500,000
             0


                                                           nd
                  na


                                       a
                             n


                                                a
                           pa


                                    di


                                             re
                   i


                                                         la
                                  In
                Ch


                                           Ko
                         Ja


                                                      ai
                                                    Th


4th June 2010                                 v1.0                                               11


                       Capacity in China
  7,000,000

  6,000,000

  5,000,000

  4,000,000                                                                                  Rest
                                                                                             China
  3,000,000

  2,000,000

  1,000,000

          0
          2004         2005      2006      2007        2008     2009       2010     2011


4th June 2010                                 v1.0                                               12


                                                                                                            6
2010/6/8


       10 largest exhibition centres in Asia

         Region          City                         Exhibition Centre
      1 China         Guangzhou Chinese Export Commodities Fair Ground - Pazhou complex

      2 China          Shanghai Shanghai New International Expo Centre (SNIEC)
      3 China         Guangzhou Chinese Export Commodities Fair Ground - Liuhua complex

      4 Thailand       Bangkok     IMPACT
      5 China           Yiwu       Yiwu International Expo Centre
      6 China          Chengdu     New International Convention and Exhibition Center (Century City)

      7   China       Shenyang     Shenyang Exhibition Center
      8   China       Shenzhen     Shenzhen Convention & Exhibition Center
      9   China         Beijing    New China International Exhibition Center (NCIEC)
     10   Singapore   Singapore    Singapore Expo


     4th June 2010                                   v1.0                                         13


          Top 5 industries by space sales
                                      Industry                                Estimated annual size in %
1   Engineering, Industrial, Manufacturing, Machines, Instruments, Hardware                         10.4%
2   Furniture, Interior design                                                                      10.2%
3   General                                                                                          8.7%
4   Food and Beverage, Hospitality                                                                   6.5%
5   Textiles, Apparel, Fashion                                                                       6.1%


     4th June 2010                                   v1.0                                         14


                                                                                                                  7
2010/6/8


                 India – key metrics

                          2009        2005    Growth
Net sqm sold             703,500    475,250    48%
Revenues               142,545,750 63,887,000 123%
Capacity (sqm)           257,457    217,457    18%
No. venues                  12         11       9%


 4th June 2010             v1.0                  15


       Top 5 categories in India
1. Premiums, household, gifts & toys

2. Industrial machinery & equipment

3. Textiles, apparel and fashion

4. Construction and infrastructure

5. General goods

 4th June 2010             v1.0                  16


                                                             8
2010/6/8


    Full year outlook for 2010
• Key trade fair growth drivers:

    – Economic growth in Asia outpaces
      rest of world

    – International organisers look to Asia

    – New venue capacity some markets:
        • Additional capacity slowing vs. past
        • Marina Bay Sands in Singapore
4th June 2010             v1.0                   17


                Outlook for 2010
• Threats to growth:

    – Continued weakness in Europe & U.S.
      economies

    – Potentially weak recovery in Asian
      exports – especially if sovereign debt
      crisis worsens

    – Likely continued economic weakness
      in some large markets (esp. Japan)
4th June 2010             v1.0                   18


                                                            9
2010/6/8


                Outlook for 2010
• Strong economic growth in key
  markets to drive industry:
    – India 8.8%, China 10%

• Hong Kong, Korea, Taiwan to
  return to solid GDP growth
  expected to be 4%-6%

• BSG’s initial forecast for trade fair
  growth is higher than 2009
4th June 2010          v1.0               19


                  Thank you

        We would be pleased to take
       your questions and comments
               at this time.


                                                    10

Más contenido relacionado

Destacado (7)

Testing times q2 2009
Testing times   q2 2009Testing times   q2 2009
Testing times q2 2009
 
Cost accounting
Cost accountingCost accounting
Cost accounting
 
itSMFnz conference
itSMFnz conferenceitSMFnz conference
itSMFnz conference
 
Paul Woodward
Paul WoodwardPaul Woodward
Paul Woodward
 
BFA presentation
BFA presentationBFA presentation
BFA presentation
 
Ng
NgNg
Ng
 
Nut
Nut Nut
Nut
 

Similar a Mark cochrane

Colliers International: Retail Highlights Fall 2010
Colliers International: Retail Highlights Fall 2010Colliers International: Retail Highlights Fall 2010
Colliers International: Retail Highlights Fall 2010
Coy Davidson
 
Real Estate Market Report 1st qtr 2011
Real Estate Market Report 1st qtr 2011Real Estate Market Report 1st qtr 2011
Real Estate Market Report 1st qtr 2011
creba_nar
 
MobileTechCon 2011 Mainz / Germany
MobileTechCon 2011 Mainz / GermanyMobileTechCon 2011 Mainz / Germany
MobileTechCon 2011 Mainz / Germany
Avenga Germany GmbH
 
Outdoor Broadcasting
Outdoor BroadcastingOutdoor Broadcasting
Outdoor Broadcasting
Er MD FS
 
Internet presentation q1_2010
Internet presentation q1_2010Internet presentation q1_2010
Internet presentation q1_2010
SKF
 
Retail US Highlights Spring 2011
Retail US Highlights Spring 2011Retail US Highlights Spring 2011
Retail US Highlights Spring 2011
Coy Davidson
 
Metso Corporation Interim Review January - March 2012 presentation
Metso Corporation Interim Review January - March 2012 presentationMetso Corporation Interim Review January - March 2012 presentation
Metso Corporation Interim Review January - March 2012 presentation
Metso Group
 
China pc market idc
China pc market idcChina pc market idc
China pc market idc
Shin Feng
 
Executive Aviation
Executive AviationExecutive Aviation
Executive Aviation
Embraer RI
 

Similar a Mark cochrane (20)

Integrated Marketing - Overman
Integrated Marketing - OvermanIntegrated Marketing - Overman
Integrated Marketing - Overman
 
Colliers International: Retail Highlights Fall 2010
Colliers International: Retail Highlights Fall 2010Colliers International: Retail Highlights Fall 2010
Colliers International: Retail Highlights Fall 2010
 
Real Estate Market Report 1st qtr 2011
Real Estate Market Report 1st qtr 2011Real Estate Market Report 1st qtr 2011
Real Estate Market Report 1st qtr 2011
 
Leboncoin.fr - NOAH12 London
Leboncoin.fr - NOAH12 LondonLeboncoin.fr - NOAH12 London
Leboncoin.fr - NOAH12 London
 
Leboncoin.fr - NOAH12 London
Leboncoin.fr - NOAH12 LondonLeboncoin.fr - NOAH12 London
Leboncoin.fr - NOAH12 London
 
MobileTechCon 2011 Mainz / Germany
MobileTechCon 2011 Mainz / GermanyMobileTechCon 2011 Mainz / Germany
MobileTechCon 2011 Mainz / Germany
 
Analysis of Revenue guidance - Infosys
Analysis of Revenue guidance - InfosysAnalysis of Revenue guidance - Infosys
Analysis of Revenue guidance - Infosys
 
5th Annual Appraisal Summit
5th Annual Appraisal Summit5th Annual Appraisal Summit
5th Annual Appraisal Summit
 
Outdoor Broadcasting
Outdoor BroadcastingOutdoor Broadcasting
Outdoor Broadcasting
 
Creating Value in Banking 2011
Creating Value in Banking 2011Creating Value in Banking 2011
Creating Value in Banking 2011
 
Internet presentation q1_2010
Internet presentation q1_2010Internet presentation q1_2010
Internet presentation q1_2010
 
Roy Webb - national economic conditions
Roy Webb  - national economic conditionsRoy Webb  - national economic conditions
Roy Webb - national economic conditions
 
Latin america light vehicle outlook
Latin america light vehicle outlookLatin america light vehicle outlook
Latin america light vehicle outlook
 
Ren Ren Company Ipo Analysis
Ren Ren Company Ipo AnalysisRen Ren Company Ipo Analysis
Ren Ren Company Ipo Analysis
 
Nordea Forest Products & Paper Seminar in Helsinki. Presentation by CFO Marku...
Nordea Forest Products & Paper Seminar in Helsinki. Presentation by CFO Marku...Nordea Forest Products & Paper Seminar in Helsinki. Presentation by CFO Marku...
Nordea Forest Products & Paper Seminar in Helsinki. Presentation by CFO Marku...
 
Tomas Bella
Tomas BellaTomas Bella
Tomas Bella
 
Retail US Highlights Spring 2011
Retail US Highlights Spring 2011Retail US Highlights Spring 2011
Retail US Highlights Spring 2011
 
Metso Corporation Interim Review January - March 2012 presentation
Metso Corporation Interim Review January - March 2012 presentationMetso Corporation Interim Review January - March 2012 presentation
Metso Corporation Interim Review January - March 2012 presentation
 
China pc market idc
China pc market idcChina pc market idc
China pc market idc
 
Executive Aviation
Executive AviationExecutive Aviation
Executive Aviation
 

Último

Jual Obat Aborsi Di Sibolga wa 0851/7541/5434 Cytotec Misoprostol 200mcg Pfizer
Jual Obat Aborsi Di Sibolga wa 0851/7541/5434 Cytotec Misoprostol 200mcg PfizerJual Obat Aborsi Di Sibolga wa 0851/7541/5434 Cytotec Misoprostol 200mcg Pfizer
Jual Obat Aborsi Di Sibolga wa 0851/7541/5434 Cytotec Misoprostol 200mcg Pfizer
Pusat Herbal Resmi BPOM
 
Creating an Income Statement with Forecasts: A Simple Guide and Free Excel Te...
Creating an Income Statement with Forecasts: A Simple Guide and Free Excel Te...Creating an Income Statement with Forecasts: A Simple Guide and Free Excel Te...
Creating an Income Statement with Forecasts: A Simple Guide and Free Excel Te...
Aurelien Domont, MBA
 
ابو ظبي اعلان | - سايتوتك في الامارات حبوب الاجهاض للبيع ف حبوب الإجهاض ... ا...
ابو ظبي اعلان | - سايتوتك في الامارات حبوب الاجهاض للبيع ف حبوب الإجهاض ... ا...ابو ظبي اعلان | - سايتوتك في الامارات حبوب الاجهاض للبيع ف حبوب الإجهاض ... ا...
ابو ظبي اعلان | - سايتوتك في الامارات حبوب الاجهاض للبيع ف حبوب الإجهاض ... ا...
brennadilys816
 
Apotik Jual Obat Aborsi asli Mataram, Wa : 085180626899 - Penjual obat Cytote...
Apotik Jual Obat Aborsi asli Mataram, Wa : 085180626899 - Penjual obat Cytote...Apotik Jual Obat Aborsi asli Mataram, Wa : 085180626899 - Penjual obat Cytote...
Apotik Jual Obat Aborsi asli Mataram, Wa : 085180626899 - Penjual obat Cytote...
jual Obat Aborsi Bandung, Wa : 085180626899 Apotik jual Obat Cytotec Di Bandung
 
Future of Trade 2024 - Decoupled and Reconfigured - Snapshot Report
Future of Trade 2024 - Decoupled and Reconfigured - Snapshot ReportFuture of Trade 2024 - Decoupled and Reconfigured - Snapshot Report
Future of Trade 2024 - Decoupled and Reconfigured - Snapshot Report
Dubai Multi Commodity Centre
 
Abortion pills in Muscut<Oman(+27737758557) Cytotec available.inn Kuwait City.
Abortion pills in Muscut<Oman(+27737758557) Cytotec available.inn Kuwait City.Abortion pills in Muscut<Oman(+27737758557) Cytotec available.inn Kuwait City.
Abortion pills in Muscut<Oman(+27737758557) Cytotec available.inn Kuwait City.
daisycvs
 

Último (20)

wagamamaLab presentation @MIT 20240509 IRODORI
wagamamaLab presentation @MIT 20240509 IRODORIwagamamaLab presentation @MIT 20240509 IRODORI
wagamamaLab presentation @MIT 20240509 IRODORI
 
Top^Clinic ^%[+27785538335__Safe*Women's clinic//Abortion Pills In Harare
Top^Clinic ^%[+27785538335__Safe*Women's clinic//Abortion Pills In HarareTop^Clinic ^%[+27785538335__Safe*Women's clinic//Abortion Pills In Harare
Top^Clinic ^%[+27785538335__Safe*Women's clinic//Abortion Pills In Harare
 
Jual Obat Aborsi Di Sibolga wa 0851/7541/5434 Cytotec Misoprostol 200mcg Pfizer
Jual Obat Aborsi Di Sibolga wa 0851/7541/5434 Cytotec Misoprostol 200mcg PfizerJual Obat Aborsi Di Sibolga wa 0851/7541/5434 Cytotec Misoprostol 200mcg Pfizer
Jual Obat Aborsi Di Sibolga wa 0851/7541/5434 Cytotec Misoprostol 200mcg Pfizer
 
(推特)Twitter账号批发(自助购买网址🎉top233.com🎉)
(推特)Twitter账号批发(自助购买网址🎉top233.com🎉)(推特)Twitter账号批发(自助购买网址🎉top233.com🎉)
(推特)Twitter账号批发(自助购买网址🎉top233.com🎉)
 
Creating an Income Statement with Forecasts: A Simple Guide and Free Excel Te...
Creating an Income Statement with Forecasts: A Simple Guide and Free Excel Te...Creating an Income Statement with Forecasts: A Simple Guide and Free Excel Te...
Creating an Income Statement with Forecasts: A Simple Guide and Free Excel Te...
 
HAL Financial Performance Analysis and Future Prospects
HAL Financial Performance Analysis and Future ProspectsHAL Financial Performance Analysis and Future Prospects
HAL Financial Performance Analysis and Future Prospects
 
WAM Corporate Presentation May 2024_w.pdf
WAM Corporate Presentation May 2024_w.pdfWAM Corporate Presentation May 2024_w.pdf
WAM Corporate Presentation May 2024_w.pdf
 
5 Brilliant Ways To Buy Verified Payoneer Accounts In 2024
5 Brilliant Ways To Buy Verified Payoneer Accounts In 20245 Brilliant Ways To Buy Verified Payoneer Accounts In 2024
5 Brilliant Ways To Buy Verified Payoneer Accounts In 2024
 
ابو ظبي اعلان | - سايتوتك في الامارات حبوب الاجهاض للبيع ف حبوب الإجهاض ... ا...
ابو ظبي اعلان | - سايتوتك في الامارات حبوب الاجهاض للبيع ف حبوب الإجهاض ... ا...ابو ظبي اعلان | - سايتوتك في الامارات حبوب الاجهاض للبيع ف حبوب الإجهاض ... ا...
ابو ظبي اعلان | - سايتوتك في الامارات حبوب الاجهاض للبيع ف حبوب الإجهاض ... ا...
 
Creative Ideas for Interactive Team Presentations
Creative Ideas for Interactive Team PresentationsCreative Ideas for Interactive Team Presentations
Creative Ideas for Interactive Team Presentations
 
How to refresh to be fit for the future world
How to refresh to be fit for the future worldHow to refresh to be fit for the future world
How to refresh to be fit for the future world
 
1Q24_EN hyundai capital 1q performance
1Q24_EN   hyundai capital 1q performance1Q24_EN   hyundai capital 1q performance
1Q24_EN hyundai capital 1q performance
 
Series A Fundraising Guide (Investing Individuals Improving Our World) by Accion
Series A Fundraising Guide (Investing Individuals Improving Our World) by AccionSeries A Fundraising Guide (Investing Individuals Improving Our World) by Accion
Series A Fundraising Guide (Investing Individuals Improving Our World) by Accion
 
Apotik Jual Obat Aborsi asli Mataram, Wa : 085180626899 - Penjual obat Cytote...
Apotik Jual Obat Aborsi asli Mataram, Wa : 085180626899 - Penjual obat Cytote...Apotik Jual Obat Aborsi asli Mataram, Wa : 085180626899 - Penjual obat Cytote...
Apotik Jual Obat Aborsi asli Mataram, Wa : 085180626899 - Penjual obat Cytote...
 
Future of Trade 2024 - Decoupled and Reconfigured - Snapshot Report
Future of Trade 2024 - Decoupled and Reconfigured - Snapshot ReportFuture of Trade 2024 - Decoupled and Reconfigured - Snapshot Report
Future of Trade 2024 - Decoupled and Reconfigured - Snapshot Report
 
Abortion pills in Muscut<Oman(+27737758557) Cytotec available.inn Kuwait City.
Abortion pills in Muscut<Oman(+27737758557) Cytotec available.inn Kuwait City.Abortion pills in Muscut<Oman(+27737758557) Cytotec available.inn Kuwait City.
Abortion pills in Muscut<Oman(+27737758557) Cytotec available.inn Kuwait City.
 
Elevate Your Online Presence with SEO Services
Elevate Your Online Presence with SEO ServicesElevate Your Online Presence with SEO Services
Elevate Your Online Presence with SEO Services
 
stock price prediction using machine learning
stock price prediction using machine learningstock price prediction using machine learning
stock price prediction using machine learning
 
Guide to Networking Essentials 8th Edition by Greg Tomsho solution manual.doc
Guide to Networking Essentials 8th Edition by Greg Tomsho solution manual.docGuide to Networking Essentials 8th Edition by Greg Tomsho solution manual.doc
Guide to Networking Essentials 8th Edition by Greg Tomsho solution manual.doc
 
Daftar Rumpun, Pohon, dan Cabang Ilmu (2024).pdf
Daftar Rumpun, Pohon, dan Cabang Ilmu (2024).pdfDaftar Rumpun, Pohon, dan Cabang Ilmu (2024).pdf
Daftar Rumpun, Pohon, dan Cabang Ilmu (2024).pdf
 

Mark cochrane

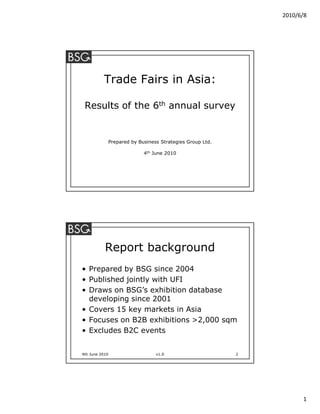
  • 1. 2010/6/8 Trade Fairs in Asia: Results of the 6th annual survey Prepared by Business Strategies Group Ltd. 4th June 2010 Report background • Prepared by BSG since 2004 • Published jointly with UFI • Draws on BSG’s exhibition database developing since 2001 • Covers 15 key markets in Asia • Focuses on B2B exhibitions >2,000 sqm • Excludes B2C events 4th June 2010 v1.0 2 1
  • 2. 2010/6/8 Highlights of 2009 Trade Fair Industry in Asia Report • Nearly 1800 exhibitions identified • 14.9 mil m2 sold in 2009 – up 3.8% • 5% of that space was sold in India • Revenues US$3.41 billion – flat y-on-y • 5% of revenues generated in India 4th June 2010 v1.0 3 Top 5 markets ranked by net size Estimated annual size in m2 9,000,000 8,000,000 7,000,000 6,000,000 5,000,000 Estimated annual size in 4,000,000 m2 3,000,000 2,000,000 1,000,000 0 China Japan Hong Korea India Kong 4th June 2010 v1.0 4 2
  • 3. 2010/6/8 Top 5 y-on-y change in net size Estimated size 2008 vs. 2009 in % change 50% 45% 40% 35% 30% Estimated size 2008 vs. 25% 2009 in % change 20% 15% 10% 5% 0% an a a au sia in re iw ac Ch Ko ay Ta M al M 4th June 2010 v1.0 5 Change in net size: ’09 vs. ‘05 Top 5 exhibition space sold % change 140% 120% 100% 80% Estimated size 2005 vs. 60% 2009 in % change 40% 20% 0% nd na ng m n ta na i la Ko Ch kis ai et ng Th Pa Vi Ho 4th June 2010 v1.0 6 3
  • 4. 2010/6/8 Growth in Asia 2005-2009 16,000,000 14,000,000 Estimated annual size in m2 12,000,000 10,000,000 8,000,000 6,000,000 4,000,000 2,000,000 0 2005 2006 2007 2008 2009 4th June 2010 v1.0 7 Change in U.S. 2000-2009 4th June 2010 v1.0 8 4
  • 5. 2010/6/8 4th June 2010 v1.0 9 Markets ranked by revenues Top 5 markets by revenues 2009 1,200,000,000 1,000,000,000 800,000,000 Estimated annualised 600,000,000 revenues (US$) 400,000,000 200,000,000 0 na ng n a lia pa re i Ko ra Ch Ko Ja st ng Au Ho 4th June 2010 v1.0 10 5
  • 6. 2010/6/8 Markets ranked by capacity Top 5 markets by capacity 4,500,000 4,000,000 3,500,000 3,000,000 2,500,000 2010 Total gross indoor 2,000,000 size in m2 1,500,000 1,000,000 500,000 0 nd na a n a pa di re i la In Ch Ko Ja ai Th 4th June 2010 v1.0 11 Capacity in China 7,000,000 6,000,000 5,000,000 4,000,000 Rest China 3,000,000 2,000,000 1,000,000 0 2004 2005 2006 2007 2008 2009 2010 2011 4th June 2010 v1.0 12 6
  • 7. 2010/6/8 10 largest exhibition centres in Asia Region City Exhibition Centre 1 China Guangzhou Chinese Export Commodities Fair Ground - Pazhou complex 2 China Shanghai Shanghai New International Expo Centre (SNIEC) 3 China Guangzhou Chinese Export Commodities Fair Ground - Liuhua complex 4 Thailand Bangkok IMPACT 5 China Yiwu Yiwu International Expo Centre 6 China Chengdu New International Convention and Exhibition Center (Century City) 7 China Shenyang Shenyang Exhibition Center 8 China Shenzhen Shenzhen Convention & Exhibition Center 9 China Beijing New China International Exhibition Center (NCIEC) 10 Singapore Singapore Singapore Expo 4th June 2010 v1.0 13 Top 5 industries by space sales Industry Estimated annual size in % 1 Engineering, Industrial, Manufacturing, Machines, Instruments, Hardware 10.4% 2 Furniture, Interior design 10.2% 3 General 8.7% 4 Food and Beverage, Hospitality 6.5% 5 Textiles, Apparel, Fashion 6.1% 4th June 2010 v1.0 14 7
  • 8. 2010/6/8 India – key metrics 2009 2005 Growth Net sqm sold 703,500 475,250 48% Revenues 142,545,750 63,887,000 123% Capacity (sqm) 257,457 217,457 18% No. venues 12 11 9% 4th June 2010 v1.0 15 Top 5 categories in India 1. Premiums, household, gifts & toys 2. Industrial machinery & equipment 3. Textiles, apparel and fashion 4. Construction and infrastructure 5. General goods 4th June 2010 v1.0 16 8
  • 9. 2010/6/8 Full year outlook for 2010 • Key trade fair growth drivers: – Economic growth in Asia outpaces rest of world – International organisers look to Asia – New venue capacity some markets: • Additional capacity slowing vs. past • Marina Bay Sands in Singapore 4th June 2010 v1.0 17 Outlook for 2010 • Threats to growth: – Continued weakness in Europe & U.S. economies – Potentially weak recovery in Asian exports – especially if sovereign debt crisis worsens – Likely continued economic weakness in some large markets (esp. Japan) 4th June 2010 v1.0 18 9
  • 10. 2010/6/8 Outlook for 2010 • Strong economic growth in key markets to drive industry: – India 8.8%, China 10% • Hong Kong, Korea, Taiwan to return to solid GDP growth expected to be 4%-6% • BSG’s initial forecast for trade fair growth is higher than 2009 4th June 2010 v1.0 19 Thank you We would be pleased to take your questions and comments at this time. 10