KPI Recruitment Dashboard For HR Recruitment
•
0 recomendaciones•836 vistas

“You can download this product from SlideTeam.net” Presenting this set of slides with name KPI Recruitment Dashboard For HR Recruitment. The topics discussed in these slides are Recruitment Funnel, Positions, Commission. This is a completely editable PowerPoint presentation and is available for immediate download. Download now and impress your audience. https://bit.ly/2YKXYvS
Denunciar
Compartir
Denunciar
Compartir
Descargar para leer sin conexión

Recomendados
Recomendados
Más contenido relacionado
La actualidad más candente
La actualidad más candente (20)
HRBP -
Human Resource Business Partner - Manu Melwin Joy
HRBP -
Human Resource Business Partner - Manu Melwin Joy
Hr Dashboard Number Of Employees Employee Structure
Hr Dashboard Number Of Employees Employee Structure
Strategic Workforce Planning Model PowerPoint Presentation Slides
Strategic Workforce Planning Model PowerPoint Presentation Slides
The New Model for Talent Management: Agenda for 2015
The New Model for Talent Management: Agenda for 2015
Business Sales Review PowerPoint Presentation Slides
Business Sales Review PowerPoint Presentation Slides
Employee Value Proposition PowerPoint Presentation Slides
Employee Value Proposition PowerPoint Presentation Slides
HR and Talent Management Toolkit - Overview and Approach
HR and Talent Management Toolkit - Overview and Approach
Roadmap to become a
strategic talent acquisition organization | ConnectIn
Roadmap to become a
strategic talent acquisition organization | ConnectIn
Human Resources Planning (BBA-III, Sambalpur University)
Human Resources Planning (BBA-III, Sambalpur University)
The Role of the HR Professional in Creating a High-Performance Organisation
The Role of the HR Professional in Creating a High-Performance Organisation
Similar a KPI Recruitment Dashboard For HR Recruitment
Similar a KPI Recruitment Dashboard For HR Recruitment (20)
Business KPI Dashboard Showing Lead To Opportunity Ratio
Business KPI Dashboard Showing Lead To Opportunity Ratio
Recruitment Strategy Powerpoint Presentation Slides
Recruitment Strategy Powerpoint Presentation Slides
Workforce Planning Case Studies Powerpoint Presentation Slides
Workforce Planning Case Studies Powerpoint Presentation Slides
Workforce Planning Case Studies PowerPoint Presentation Slides
Workforce Planning Case Studies PowerPoint Presentation Slides
Compensation Scheme PowerPoint Presentation Slides
Compensation Scheme PowerPoint Presentation Slides
Strategic Human Resource Planning Process PowerPoint Presentation Slides
Strategic Human Resource Planning Process PowerPoint Presentation Slides
Strategic Human Resource Planning Process Powerpoint Presentation Slides
Strategic Human Resource Planning Process Powerpoint Presentation Slides
Recruitment Life Cycle PowerPoint Presentation Slides
Recruitment Life Cycle PowerPoint Presentation Slides
Strategic Workforce Planning Framework PowerPoint Presentation Slides
Strategic Workforce Planning Framework PowerPoint Presentation Slides
Competency Based Management PowerPoint Presentation Slides
Competency Based Management PowerPoint Presentation Slides
Recruitment Proposal Powerpoint Presentation Slides
Recruitment Proposal Powerpoint Presentation Slides
Recruitment Proposal PowerPoint Presentation Slides
Recruitment Proposal PowerPoint Presentation Slides
Workforce Management PowerPoint Presentation Slides
Workforce Management PowerPoint Presentation Slides
Workforce Management Powerpoint Presentation Slides
Workforce Management Powerpoint Presentation Slides
360 Degree View Of Customer Powerpoint Presentation Slides
360 Degree View Of Customer Powerpoint Presentation Slides
Recruitment Process Model Powerpoint Presentation Slides
Recruitment Process Model Powerpoint Presentation Slides
Recruitment Process Model PowerPoint Presentation Slides
Recruitment Process Model PowerPoint Presentation Slides
Más de SlideTeam
Más de SlideTeam (20)
Customer Support And Services Guide Powerpoint Presentation Slides
Customer Support And Services Guide Powerpoint Presentation Slides
Word Of Mouth WOM Marketing Strategies To Build Brand Awareness Powerpoint Pr...
Word Of Mouth WOM Marketing Strategies To Build Brand Awareness Powerpoint Pr...
Strategic Staff Engagement Action Plan Powerpoint Presentation Slides
Strategic Staff Engagement Action Plan Powerpoint Presentation Slides
Traditional Marketing Channel Analysis Powerpoint Presentation Slides Mkt Cd
Traditional Marketing Channel Analysis Powerpoint Presentation Slides Mkt Cd
Integrating Asset Tracking System To Enhance Operational Effectiveness Comple...
Integrating Asset Tracking System To Enhance Operational Effectiveness Comple...
Designing And Implementing Brand Leadership Strategy Powerpoint Presentation ...
Designing And Implementing Brand Leadership Strategy Powerpoint Presentation ...
How Amazon Generates Revenues Across Globe Powerpoint Presentation Slides Str...
How Amazon Generates Revenues Across Globe Powerpoint Presentation Slides Str...
Guide For Effective Event Marketing Powerpoint Presentation Slides Mkt Cd
Guide For Effective Event Marketing Powerpoint Presentation Slides Mkt Cd
Managing Business Customers Technology Powerpoint Presentation Slides
Managing Business Customers Technology Powerpoint Presentation Slides
Unearthing Apples Billion Dollar Branding Secret Powerpoint Presentation Slid...
Unearthing Apples Billion Dollar Branding Secret Powerpoint Presentation Slid...
Developing Flexible Working Practices To Improve Employee Engagement Powerpoi...
Developing Flexible Working Practices To Improve Employee Engagement Powerpoi...
Product Corporate And Umbrella Branding Powerpoint Presentation Slides Brandi...
Product Corporate And Umbrella Branding Powerpoint Presentation Slides Brandi...
Communication Channels And Strategies For Shareholder Engagement Powerpoint P...
Communication Channels And Strategies For Shareholder Engagement Powerpoint P...
Responsible Tech Playbook To Leverage Business Ethics Powerpoint Presentation...
Responsible Tech Playbook To Leverage Business Ethics Powerpoint Presentation...
Generating Leads Through Targeted Digital Marketing Campaign Powerpoint Prese...
Generating Leads Through Targeted Digital Marketing Campaign Powerpoint Prese...
Boosting Profits With New And Effective Sales Strategic Plan Powerpoint Prese...
Boosting Profits With New And Effective Sales Strategic Plan Powerpoint Prese...
Methods To Implement Traditional Marketing Powerpoint Presentation Slides Mkt Cd
Methods To Implement Traditional Marketing Powerpoint Presentation Slides Mkt Cd
Comprehensive Guide To Sports Marketing Strategy Powerpoint Presentation Slid...
Comprehensive Guide To Sports Marketing Strategy Powerpoint Presentation Slid...
Global Shift Towards Flexible Working Powerpoint Presentation Slides
Global Shift Towards Flexible Working Powerpoint Presentation Slides
Último
Falcon stands out as a top-tier P2P Invoice Discounting platform in India, bridging esteemed blue-chip companies and eager investors. Our goal is to transform the investment landscape in India by establishing a comprehensive destination for borrowers and investors with diverse profiles and needs, all while minimizing risk. What sets Falcon apart is the elimination of intermediaries such as commercial banks and depository institutions, allowing investors to enjoy higher yields.Falcon Invoice Discounting: The best investment platform in india for investors
Falcon Invoice Discounting: The best investment platform in india for investorsFalcon Invoice Discounting
Falcon stands out as a top-tier P2P Invoice Discounting platform in India, bridging esteemed blue-chip companies and eager investors. Our goal is to transform the investment landscape in India by establishing a comprehensive destination for borrowers and investors with diverse profiles and needs, all while minimizing risk. What sets Falcon apart is the elimination of intermediaries such as commercial banks and depository institutions, allowing investors to enjoy higher yields.Unveiling Falcon Invoice Discounting: Leading the Way as India's Premier Bill...
Unveiling Falcon Invoice Discounting: Leading the Way as India's Premier Bill...Falcon Invoice Discounting
Último (20)
Berhampur Call Girl Just Call 8084732287 Top Class Call Girl Service Available
Berhampur Call Girl Just Call 8084732287 Top Class Call Girl Service Available
Berhampur CALL GIRL❤7091819311❤CALL GIRLS IN ESCORT SERVICE WE ARE PROVIDING
Berhampur CALL GIRL❤7091819311❤CALL GIRLS IN ESCORT SERVICE WE ARE PROVIDING
Ooty Call Gril 80022//12248 Only For Sex And High Profile Best Gril Sex Avail...
Ooty Call Gril 80022//12248 Only For Sex And High Profile Best Gril Sex Avail...
Quick Doctor In Kuwait +2773`7758`557 Kuwait Doha Qatar Dubai Abu Dhabi Sharj...
Quick Doctor In Kuwait +2773`7758`557 Kuwait Doha Qatar Dubai Abu Dhabi Sharj...
Call 7737669865 Vadodara Call Girls Service at your Door Step Available All Time
Call 7737669865 Vadodara Call Girls Service at your Door Step Available All Time
Falcon Invoice Discounting: The best investment platform in india for investors
Falcon Invoice Discounting: The best investment platform in india for investors
How to Get Started in Social Media for Art League City
How to Get Started in Social Media for Art League City
Unveiling Falcon Invoice Discounting: Leading the Way as India's Premier Bill...
Unveiling Falcon Invoice Discounting: Leading the Way as India's Premier Bill...
Lundin Gold - Q1 2024 Conference Call Presentation (Revised)
Lundin Gold - Q1 2024 Conference Call Presentation (Revised)
The Abortion pills for sale in Qatar@Doha [+27737758557] []Deira Dubai Kuwait
The Abortion pills for sale in Qatar@Doha [+27737758557] []Deira Dubai Kuwait
Horngren’s Cost Accounting A Managerial Emphasis, Canadian 9th edition soluti...
Horngren’s Cost Accounting A Managerial Emphasis, Canadian 9th edition soluti...
Chennai Call Gril 80022//12248 Only For Sex And High Profile Best Gril Sex Av...
Chennai Call Gril 80022//12248 Only For Sex And High Profile Best Gril Sex Av...
Uneak White's Personal Brand Exploration Presentation
Uneak White's Personal Brand Exploration Presentation
KPI Recruitment Dashboard For HR Recruitment
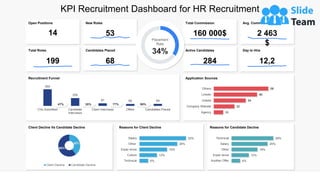
- 1. s KPI Recruitment Dashboard for HR Recruitment This graph/chart is linked to excel, and changes automatically based on data. Just left click on it and select “Edit Data”. New Roles 53 Open Positions 14 Total Roles 199 Candidates Placed 68 Active Candidates 284 Avg. Commission Rate 2 463 $ Day to Hire 12,2 Total Commission 160 000$ Recruitment Funnel 550 259 87 66 69 CVs Submitted Candidate Interviews Client Interviews Offers Candidates Piaced 47% 35% 77% 90% Application Sources 10 22 34 46 58 Agency Company Website Indeed Linkdin Others Client Decline Vs Candidate Decline 40% 60% Client Decline Candidate Decline Reasons for Candidate Decline 6% 12% 18% 25% 29% Another Offer Exper ience Other Salary Technical Reasons for Client Decline 6% 12% 19% 26% 32% Technical Culture Exper ience Other Salary Placement Rate 34%
- 2. Instructions to Edit This Slide This slide has been made in PowerPoint using basic PowerPoint shapes, and all graphics are 100% editable in PowerPoint. You can change color, size and orientation of any element to your liking, and add/edit any piece of text anywhere. Edit any Shape All images are 100% editable in PowerPoint Change color, size and orientation of any icon to your liking” 1. Select the Graph and right click -> Select "Edit Data" 2. An excel matrix will automatically show up 3. Enter the values based on your requirements and hit enter 4. The Graph/Chart shape will automatically adjust according to your data, and anytime you can go and change the value again Edit Excel-linked Chart This is a Data Driven Chart/Graph and the shape automatically adjusts according to your data 3. 2. 1. Resize any Shape and Edit Color 1. 2. 3. Select from Thousands of Editable Icons on Every Topic These icons are available at the Icons section on www.slideteam.net