SlideShare una empresa de Scribd logo
1 de 28
Descargar para leer sin conexión
o
Issue 1 of 2                                                h’s W rkfo


                                                       Uta


                                                                         rce
Next issue: Utah's Businesses Today

           Perspectives on Utah’s Economy
                                                          Today!


                                                                                March/April 2012


                     Special Issue:
                Utah's Workforce Today


                                              Profiling
                                            Utah's Labor
                                              Force—
                                             It's a Good Thing
                                                    pg. 16


                                                                 Department of Workforce Services
Trendlines
                   Setting the
                       Pace
                                                                                          Utah Department of Workforce Services
                                                                                                    Executive Director
                                                                                                          Kristen Cox

                                                                                           Workforce Research and Analysis
                        Kristen Cox, Executive Director,                                              Rick Little, Director
                        Department of Workforce Services                                             Carrie Mayne, Editor


      D
               ear   Readers:                                                                          Contributors

               When snowshoeing a few weeks ago, my youngest son once again                               Mark Knold
               gave meaning to the statement, “out of the mouth of babes.” During                    Lecia Parks Langston
      our hike his older brother turned back to complain about how slow everyone                        John Mathews
      else was moving. My six year old shot back, “Well, you’re the one who’s lead-
      ing!” His comment that the pace of the group was dictated by the one leading                        Jim Robson
      was not only cute, but insightful. Before looking to others to find answers or                      Nate Talley
      place blame, an effective leader will carefully consider the impact they person-              Linda Marling Church
      ally have in determining the pace and cadence of an organization.
                                                                                                         John Krantz
      For me, determining pace and direction are two critical factors to an organiza-                   MeLauni Jensen
      tion's success. Too many new projects or too wide a scope can overwhelm the                         Rick Llittle
      organization and cause bad multi-tasking while a lack of new efforts or direc-
      tion may result in obsolescence. Setting the exact pace or individual direction                    Curt Stewart
      for everyone involved may be impossible, but having at least an awareness of
      these issues is a must.                                                                             Designer
                                                                                                         Pat Swenson
      As an outdoor enthusiast, snowshoeing and hiking are some of my favorite
      recreational activities. Having the right gear makes all of the difference
      between a successful hike and a miserable one. Likewise, having the right
      gear or tools within an organization is imperative when it comes to assessing
                                                                                           jobs.utah.gov
      performance, direction, and pace. At a minimum, the following tools are
      required to be successful:

      •	   Clear targets                                                                  Trendlines is published every other
                                                                                          month by the Workforce Research and
      •	   Dashboards to track cost, quality, and throughput                              Analysis Division. To download this
                                                                                          publication go to http://jobs.utah.gov/wi.
      •	   Structures to track division or unit, as well as organization-wide projects    Click on “Publications” and select the
                                                                                          one you want from the list. To obtain
      •	   Real-time data on how individuals, teams, and divisions/units are per-         additional printed copies or to subscribe
           forming                                                                        to Trendlines contact:

      Whether providing valuable information about the economy of Utah; discuss-          Department of Workforce Services
      ing how women and men match up in educational attainment; or weighing               Attn: WRA
                                                                                          140 East 300 South • SLC, UT 84111
      the value of creating family friendly workplaces to improve productivity and
                                                                                          (801) 526-9785 • Fax: (801) 526-9238
      employee success; our goal is for Trendlines to be a valuable tool for you to use
                                                                                          Email: wipublications@utah.gov
      in setting the direction and pace of your organization. The Utah Department
      of Workforce Services is committed to the mission of connecting job seekers         The Workforce Research and Analysis
      and employers and we hope this edition of Trendlines will help you lead the way.    Division generates accurate, timely, and
                                                                                          understandable data and analyses to provide
      Sincerely,                                                                          knowledge of ever-changing workforce
                                                                                          environments that support sound planning
                                                                                          and decision-making.


2 March/April 2012
contents
                                                                      Metropolitan Areas Lead Utah's
                                                          5                    Employment Growth
                                                                                  Wasatch Front and Statewide

                                                                         Women Outperform Men in
                                                          6                Educational Attainment
            Utah's                                                                             National News


           Workforce                                       8     Third Quarter 2010 New Hire Survey
                                                                                             Economic Insight
            Today                                                          How Do We Determine the
                                                          10                   Unemployment Rate?
                                                                                              Economic News

                                                                   Welfare, Work, and the Economy
                                                          12                                     Insider News

                                                                           Customers Served by the
      Introduction                                        14   Utah Department of Workforce Services
      to this issue:                                                                     For Your Information

          pg. 4                                                         Profiling Utah's Labor Force—
                                                          16                         It's a Good Thing
                                                                                                 The Outlook

                                                                       Work/Life Awards Continue to
                                                          19         Focus on Employer Best Practices
                                                                                                  DWS News

                                                                            The Highs and the Lows of
pg. 12                                                    20          Labor Force Participation in Utah
                                                                                                The Outskirts

                                                                  System Analysts: The Link Between
                                                          22    Business and Information Technology
                                                                                                 Occupations

                                                                        A New System of Classifying
                                                          24   Occupations by Education and Training
                 DWS-03-44-0312                                                            What's Happening
        Equal Opportunity Employer/Program
 Auxiliary aids and services are available upon request                                    Information
    to individuals with disabilities by calling (801)
   526-9240. Individuals with speech and/or hearing
                                                          26                                Industry Highlight
          impairments may call the Relay Utah
 by dialing 711. Spanish Relay Utah: 1-888-346-3162.

                                                                                         Just the Facts...
                                                          27                                      Rate Update

jobs.utah.gov/wi                                                                                    Trendlines   3
Introduction
          I
             n this March/April 2012 edition the    tion. Rick Little, the Director of our
             reader will find Trendlines taking     Workforce Research and Analysis
             a pretty thorough look at Utah’s       Division dives in with both feet to
          economy. Not necessarily a forecast,      identify who those customers are.
          although there are a few glimpses         You’ll see that indeed this department
          into the future by our Chief Economist    touches a lot of Utahns.                    Here's why
          Mark Knold. Known for his strict                                                      Trendlines
          adherence to the data with an eye on      Every issue of Trendlines shines its
          the past, Mark has an "in the trenches"   spotlight on a targeted industry and        is worth
                                                    Insider News. This time we’re taking a
          feel for the economic churn in Utah.
                                                    look at the Information industry, and
                                                                                                reading...
          There’s some interesting insight into     what do we mean when we say the
          newly hired employees in Utah over        “Information Age? Our Insider News
          the third quarter of 2011that indi-       focuses on Welfare, Work, and the
          cates that networking really helps        Economy, tracing the origin of social
          when one is seeking a job and previ-      programs back to the Social Security
          ous employer referrals do make a          Act of 1935, and how it has evolved
          difference.                               into today’s social safety net.

          Every month the department releases       As you’ve read so far Trendlines is
          its monthly analysis of Utah’s economy    about a lot of different topics and
          in the form of Utah’s Employment          subjects. I believe you’ll find it inter-
          Summary, that report is where the         esting and worth the time invested in
          monthly unemployment rate is              reading it. The entire staff at DWS are
          revealed. As most people know, that’s     committed to our mission to connect
          the number media members wait to          Utah job seekers to Utah Employers,
          report on, and politicians pay close      and here you get a good idea on how
          attention to. If you’ve ever wanted to    we go about that.
          know how economists arrive at that
          number, read Mark Knold’s analysis on     Whether discussing how women
          page 10.                                  and men match up against each
                                                    other in educational attainment, or
          The department’s mission states,          the value of creating family friendly
          the Utah Department of Workforce          workplaces to improve productivity
          Services strengthens Utah's economy       and employee success and loyalty,
          by supporting the economic stability      Trendlines will take you there. We
          and quality of the state’s workforce.     invite you pass this edition along
          When we say workforce we mean just        when you have finished reading it and
          about every segment of the popula-        share it with your colleagues.


4 March/April 2012
wasatch front and statewide | by mark knold, chief economist


Metropolitan
           Areas Lead Utah’s Employment Growth
            It is not surprising
               that most of the
          growth is along the
                 Wasatch Front

U
        tah’s employment growth for
        2011 registered 2.4 percent. A
        nice rebound considering the
prior two years combined for a steep
employment contraction.

Most of the growth is concentrated
along the Wasatch Front. This
isn’t necessarily surprising. If
Utah’s economy is going to grow,
it has to come from the populous
metropolitan corridor. Yet many
of the state’s rural economies have
yet to “perk up.” An energy boom
in the Uintah Basin is primarily
helping Duchesne and Uintah
counties, and a construction project
to install windmill energy devices
helped Beaver County, but most
of the remaining rural counties are
not yet experiencing a trickle down
effect from the metropolitan area’s
expansion.

Barring any unforeseen economic
shock, Utah should continue to expe-
rience notable employment growth
throughout 2012, to the degree that
will support both metropolitan and
rural economic expansion.


jobs.utah.gov/wi                                                                      Trendlines   5
national news | by jim robson, economist


       Women
         Outperform
                                               Men          in Educational Attainment


                                   O
                                           ne very important aspect of U.S.   34 had at least a high school diploma,
                                           economic success, prosperity,      increasing to 85.2 percent as measured
                                           and growth over the decades        by the American Community Survey
                                   has been increasing educational            (ACS) in 2010. Females, 25 to 34 years
       Recently, one interesting   attainment of the populace over time.      of age, registered 80.7 percent with at
                                   An educated workforce is associated        least a high school diploma in 2000,
               trend has been a    with higher productivity, increasing       increasing to 89.2 percent in 2010.
                                   real incomes, and a better standard of
           large increase in the   living.                                    When you look at college-level educa-
                                                                              tion at the national level, women
        educational attainment     Levels of education have risen steadily
                                   in America over the past 70 years.
                                                                              significantly surpassed the level of
                                                                              attainment by men. In 2000, 26.1
                                   In the 1940 Census, 24.5 percent of
                     of women.     people age 25 and over had at least a
                                                                              percent of males 25 to 34 years of
                                                                              age had a college diploma or above,
                                   high school diploma. By 2010 this had      increasing by just one percentage point
                                   increased to 85.0 percent, with 27.9       to 27.1 percent by 2010. For women
                                   percent having attained a bachelor’s       of the same age, measured attainment
                                   degree or higher.                          of a college degree or higher was 22.8
                                   In recent years, one trend of particular   percent (3.3 percentage points below
                                   note has been the relatively large         the men) in 2000, increasing by 12.2
                                   increase in educational attainment         percentage points to 35.0 percent in
                                   of women. This trend is most               2010.
                                   readily illustrated by examining the
                                   educational attainment among the           Looking at this same data for those
                                   younger generation, those 25 to 34         in the 25 to 34 age group in Utah, we
                                   years of age.                              see that men exceeded the educational
                                                                              attainment levels of men nationally
                                   The 2000 Census showed nationally          for those with at least a high school
                                   that 80.1 percent of males, ages 25 to     diploma and also for those with a


6 January/February 2012
Percent of the Population 25-34 Years of Age
                                                 with a High School Diploma or Above


                                                                                                                            92.3
                                                                 90.4
                                                                                                             88.1   89.2
                                               87.3
                                                         85.2
                                       80.1                                                          80.7


                                                                                                                            Utah
                                               Utah


                                                                 Utah


                                                                                                             Utah


                                                                                                                    U.S.
                                       U.S.


                                                         U.S.


                                                                                                     U.S.
                                        2000               2010                                       2000           2010
                                       Census              ACS*                                      Census          ACS*

bachelor’s degree or higher (see
figures 1 and 2). However, the edge
Utah men had in 2000 over their
national counterparts has narrowed
in both cases. Of concern for Utah,
in 2000, 30.0 percent of men had
a bachelor’s degree or higher, but                                Percent of the Population 25-34 Years of Age
by 2010 this had dropped to 27.7                                       with a Bachelor’s Degree or Above
percent.

For Utah women in the 25 to 34 age
group, 92.3 percent—3.1 percentage
points above the national level for                                                                                   35
women—have a high school diploma
                                                                 30                                                          29.4
or above in 2010. While more Utah                                                 27.7
                                                                           27.1
women in 2010 have a college degree                      26.1
or higher (29.4 percent) than Utah                                                                   22.8 22.3
men (27.7 percent), Utah women
are 5.6 percentage points below the
national level.
                                                                                                                             Utah
                                                                                                             Utah
                                                                 Utah


                                                                                   Utah


Traditionally, Utah values educa-
                                                                                                                     U.S.
                                                                                                      U.S.
                                                          U.S.


                                                                           U.S.


tional attainment and outperforms
the levels achieved nationally. How-
ever, if current trends continue,                          2000                 2010                   2000                2010
Utah’s educational attainment levels                      Census                ACS*                  Census               ACS*
may fall below national averages,
particularly the percentage of the
population with a bachelor’s degree              *ACS—American Community Survey One-Year Estimates
and above.                                        Source: U.S. Census Bureau.


jobs.utah.gov/wi                                                                                                              Trendlines   7
economic insight | by nate talley, economist


                              Third Quarter 2010
                New Hire Survey
      Average hourly wage for newly hired employees was $13.39


      T
             he Department of Workforce       and national economic environments        there were a total of 177,252 new
             Services (DWS) surveyed a        were still experiencing ill effects       hires during that time).
             random sampling of Utah          from the most recent recession. The
      employers who hired a new employee      truth is that much of the employer        Survey Highlights
      during the third quarter of 2010.       demand for labor persisted during the     •	 The average hourly wage for newly
      Employers were asked a number           referenced quarter. However, it was         hired employees was $13.39.
      of questions about their new hire;      offset by job separations and therefore     Average hourly wages for the
      questions designed to provide insight   not reflected as net job growth.            accommodation and food services
      as to how the employee was recruited,                                               industry was $8.75 an hour and
      compensated, and if they were           There was an estimated 121,243 new
                                                                                          management of companies and
      retained, among other information.      hires in Utah during the third quarter
                                                                                          enterprises industry was $22.90 an
                                              of 2010 (the Census Bureau’s Local
                                                                                          hour.
      Intuitively, one might speculate that   Employment Dynamics program has
      employer hiring stalled during the      a slightly more expansive definition      •	 Fifty-three percent of new hires were
      third quarter of 2010 since the state   of a ‘new hire’ and estimates that          appointed to full-time positions.


8 March/April 2012
Third Quarter 2010
                                                                                            New Hires and Average Hourly Wages

 •	 Eighteen percent of the new hires                                                                                                New Hires                                                               Average Hourly Wage
   were employed on a temporary or
                                                         25,000                                                                                                                                                                                                                                                                                                                                         $25.00


                                                                                                                                                                                                                                                                                                                                                                                                                                           Average Hourly Wage
   seasonal basis.                                       20,000                                                                                                                                                                                                                                                                                                                                         $20.00


                                             New Hires
 •	 Approximately 51 percent of the                      15,000                                                                                                                                                                                                                                                                                                                                         $15.00
   new hires were found in construc-                     10,000                                                                                                                                                                                                                                                                                                                                         $10.00
   tion, retail trade, administrative
   support, waste management ser-                         5,000                                                                                                                                                                                                                                                                                                                                         $5.00
   vices, accommodation and food
                                                                       0                                                                                                                                                                                                                                                                                                                                $0.00
   services. These industries generally
                                                                                                 Agriculture
                                                                                                     Mining
                                                                                                    Utilities
                                                                                               Construction
                                                                                            Manufacturing
                                                                                           Wholesale Trade
                                                                                                Retail Trade
                                                                            Transportation & Warehousing
                                                                                                Information
                                                                                       Finance & Insurance
                                                                                                 Real Estate
                                                                                Prof, Scientific & Technical
                                                                                              Management
                                                                                   Admin Support & Waste
                                                                                         Education Services
                                                                             Healthcare & Social Assistance
                                                                                Arts, Entertainment & Rec
                                                                                  Accommodation & Food
                                                                                             Other Services
                                                                                               Government
   experience a higher-than-average
   turnover, meaning that the demand
   for new hires was likely fueled by
   the need for replacement labor.

 •	 The administrative support and
   waste management services industry
   housed almost 17 percent of all
   new hires during the referenced
   period. Included in this industry are
   temporary help and staffing services
   companies, which are usually the                                                                        Percent of Third Quarter New Hires
   first to experience an increase                                                                              Separated One Year Later
   in hiring activity following an
   economic downturn.                        70%
                                             60%
 •	 Only 55 percent of the newly hired       50%
                                             40%
   employees remained employed by            30%
   the hiring organization one year          20%
   later. This indicates that at least for   10%
   the positions that were filled by the      0%
   newly hired employee, employment
                                                         Agriculture
                                                                       Mining
                                                                                Utilities
                                                                                            Construction
                                                                                                           Manufacturing
                                                                                                                           Wholesale Trade
                                                                                                                                             Retail Trade
                                                                                                                                                            Transportation & Warehousing
                                                                                                                                                                                           Information
                                                                                                                                                                                                         Finance & Insurance
                                                                                                                                                                                                                               Real Estate
                                                                                                                                                                                                                                             Prof, Scientific & Technical
                                                                                                                                                                                                                                                                            Management
                                                                                                                                                                                                                                                                                         Admin Support & Waste
                                                                                                                                                                                                                                                                                                                 Education Services
                                                                                                                                                                                                                                                                                                                                      Healthcare & Social Assistance
                                                                                                                                                                                                                                                                                                                                                                       Arts, Entertainment & Rec
                                                                                                                                                                                                                                                                                                                                                                                                   Accommodation & Food
                                                                                                                                                                                                                                                                                                                                                                                                                          Other Services
                                                                                                                                                                                                                                                                                                                                                                                                                                           Government
   longevity is not standard. As seen
   in figure 2, separation statistics vary
   considerably by industry.

 •	 About 65 percent of all newly
   hired employees discovered the
   job opening through networking
   or word of mouth. Likewise, over
   42 percent of employers stated
   that a referral from a friend, family
   member, or previous employee
   was one of the most influential                                         For additional information on the DWS
   factors of the hiring decision. These
   statistics suggest that informal
                                                                            New Hires Survey contact Nate Talley
   channels of job search and job                                                  at natetalley@utah.gov.
   matching remain prevalent in the
   labor market.


jobs.utah.gov/wi                                                                                                                                                                                                                                                                                                                                                                                                          Trendlines                             9
economic news | by mark knold, chief economist


         How Do We

            Determine
                      The Unemployment Rate?
                                                                         Share of Total Household
              Contrary to what you might think,                             Income in Utah by
              unemployment benefits are not the                               Quintiles 2010
            primary factor in the unemployment
                                 rate calculation.


      U
             nemployment rates are among the most frequently        state-level unemployment rate calculation, and in some
             referenced indicators of labor market health.          states, they are not used at all.
             Given the ubiquitous nature of these rates, it is
      important to understand the methods through which             To be counted as unemployed, one must be without a job
      they are derived.                                             and seeking work. If one is without a job, yet is not looking
                                                                    for a job, then the individual is not considered unemployed
      Unemployment rates are calculated and owned by                under the official definition of unemployment.
      the federal government—more specifically, the U.S.
      Bureau of Labor Statistics (BLS). It is this federal agency   There are three ways through which people become
      that determines not only the national unemployment            unemployed. The first is to lose a job (job losses could take
      rate, but rates for all states, counties, metropolitan        the form of a layoff, firing, expiration of temporary job,
      areas, and cities (with a population of 25,000 or more).      etc.). The second is to voluntarily leave a job. The third is
      Advantages of the federally defined approach to the           to newly enter the labor force (for example, students who
      production of unemployment rates are numerous. First, a       graduate and begin seeking work) or to return to the labor
      centralized methodology allows for the standardization of     force after a period of absence. Unemployment benefits
      unemployment rate estimates, which means that rates can       are only available to those in the first category, and even
      be compared across different states, counties, and other      then, not all are eligible. Therefore, unemployment
      areas. Second, since the release of updated unemployment      insurance activity only includes a fraction of those who
      rates usually elicit a strong market response, a federally    are unemployed. Nationally, about one-third of the
      imposed release schedule helps to add some predictability     unemployed are on the roles of unemployment insurance.
      to when the newest unemployment rates will be available.      In Utah, an even smaller percentage of the unemployed
      Finally, a centrally driven estimate production process       are captured by unemployment insurance statistics.
      helps to keep unemployment rates insulated from local
      political influence.                                          Since those leaving jobs and those entering or re-
                                                                    entering the labor force are generally not eligible to
      Contrary to what many people believe, unemployment            collect unemployment insurance, a more comprehensive
      insurance claims (unemployment benefits) are not the          method is needed to fully estimate the volume of the
      primary factor in the unemployment rate calculation.          unemployed. This is done through a monthly survey
      Instead, a monthly national survey is the driving force.      called the Current Population Survey (commonly
      Unemployment claims are just a small portion of the           referred to as the Household Survey). This is administered


10 March/April 2012
Utah Unemployed by Reason                                   Utah Unemployed
                   December 2010-November 2011                            December 2010-November 2011
                   Job Leavers
                       9%                                                    Looking for
                                                                              Part-Time
                                                                                Work
                                                                                17%
                                             Job Losers                                              Looking for
                         Entrants/              59%                                                   Full-Time
                        Re-entrants                                                                     Work
                           32%                                                                          83%


                          Source: U.S. Census Bureau, Current Population Statistics. • http://www.bls.gov/gps/notescps.htm


monthly to 60,000 households nationwide by the U.S.                      unemployment rate. Utah provides the unemployment
Census Bureau, at the behest and financing of the Bureau                 insurance claims data, and the federal government
of Labor Statistics. Selected households rotate in and out               supplies the remaining inputs and makes the calculation.
of the survey—in for four months, out for eight, back in
for four, then finished. In addition to questions regarding              Each month, Utah announces and profiles both
demographic information such as age, race, and gender,                   Utah’s unemployment rate and employment growth
individuals are asked whether they were employed, how                    estimation, but those numbers are generated by the
many hours they worked, what industry they worked in,                    federal government. The federal government asks
along with many other questions related to their labor                   states to issue a monthly announcement to put a local
market activities. For interviewees who were not working,                analytical perspective on the data; however, the states do
the survey asks whether they are looking for a job, the                  not generate nor “own” the data.
methods used to find a job, and so forth. It provides
detailed survey information of monthly household labor                   The process that generates the unemployment rate is
market activity.                                                         not perfect—it simply produces an estimate. The key to
                                                                         it all comes down to the definition, which centers upon
The survey results produce the national unemployment                     activity. Is an individual without work and looking for a
rate. But at the state and local level, the monthly survey               job? It is theoretically possible for all unemployed people
sample size is not considered statistically strong enough                to stop looking for a job. The unemployment rate would
to produce the unemployment rate on its own (700                         then fall to zero. The unemployment rate statistics suggest
households monthly in Utah). Therefore, each state’s                     that some of the recent unemployment rate decline can
survey results are combined with historical data to                      be attributed to unemployed people no longer looking
construct an econometric model, out of which comes                       for work.
the state’s official unemployment rate estimation. The
inputs into this model are not only historical data and                  The unemployment rate can also decline as people find
the current survey results, but also the recent amount of                jobs. They leave the ranks of the unemployed and become
unemployment insurance claims (although this input’s                     employed. With 36,000 jobs created in Utah over the past
influence with the model varies by state—it does not                     year, job gains are also part of the recent unemployment
have a strong influence in Utah), current estimates                      rate decline.
of Utah employment growth or contraction, Utah
population estimates, and other economic variables. The                  Additionally, variability in the survey can occasionally be
most influential factor in the model is the current survey               significant enough that unemployment movements can
results, yet the other variables help to stabilize monthly               be partially attributed to this factor. In the case of the
fluctuations that are inherent and potentially sizable due               current unemployment rate decline, survey variability
to the survey’s small sample size.                                       also appears to be an influencing factor. Job gains,
                                                                         labor force exits, and survey variability are currently
The federal government designs the model. The survey                     all contributing factors in the state’s recent noticeable
provides the data for the model. The model produces the                  unemployment rate decline.


jobs.utah.gov/wi                                                                                                              Trendlines   11
insider news | by john krantz, economist


                      Welfare,
                                                         Work, and
                                                         the Economy
                                                                                          A background on welfare
                                                                                       for mothers with dependent
                                                                                        children and how numbers
                                                                                           of new entrants coincide
                                                                                              with economic times.


       T
              he social program known as welfare traces its origin   public either accepted the program as satisfying a
              back to the Great Depression, when it was created      legitimate social need or was at least unconcerned with
              as part of the Social Security Act of 1935. The pro-   it. However, the broad social changes of the 1960s would
       gram was originally known as Aid to Dependent Children        drastically alter the public’s opinion toward welfare,
       and later as Aid to Families with Dependent Children          providing an impetus toward reform. Perhaps the
       (AFDC), the title the program would retain through the        most influential social change was the steady increase
       mid-1990s. The program was designed to provide sup-           in the percent of working mothers. Only 28 percent
       port to mothers with dependent children whose fathers         of women with children worked outside of the home
       had left the family, become incapacitated, or died. The       in 1960, but by the 1990s this figure rose to nearly 70
       legislation was motivated by a 1934 study conducted by        percent. Consequently, public opinion shifted away from
       the Committee on Economic Security that found 8 mil-          the view that mothers need to be home taking care of
       lion children living in families receiving unemployment       children toward the view that mothers can and should
       relief, a number equal to approximately 22 percent of all     work outside of the home. Two other social trends served
       children under the age of 16 in the U.S. The study warned     to foster an overall negative view of welfare among the
       that these children were exposed to a significant risk of     public. From 1960 to the mid-1980s, the divorce rate more
       delinquency or serious neglect and prescribed financial       than doubled and the percentage of births to unmarried
       assistance to protect children from this risk.                women quadrupled. Some argued that these trends were
                                                                     the direct results of welfare on the basis that there were
       During the first 25 years of AFDC, the program operated       financial incentives toward divorce, never marrying, and
       as intended, caseloads were relatively low, and the general   out-of-wedlock childbearing. Regardless of the validity of


12 March/April 2012
such arguments, the ever-growing share of the public that                                   important facts about welfare under TANF is that, strictly
had developed an unfavorable opinion of welfare served                                      speaking, it is no longer an entitlement program.
to embolden policymakers to legislate major reforms to
the program.                                                                                Turning to economic matters, the health of Utah’s labor
                                                                                            market and the number of new entrants into TANF exhibit
Welfare reform was achieved with the passing of the                                         an inverse relationship that is clearly discernable in the
Personal Responsibility and Work Opportunities Recon-                                       accompanying graph. The economic downturns are defined
ciliation Act of 1996, which dismantled AFDC and put in                                     as periods where the labor market was contracting in Utah.
its place Temporary Assistance for Needy Families (TANF).                                   As expected, when the demand for labor decreased, a greater
The new program was designed around the central tenet                                       number of individuals were unable to secure employment
that welfare is only a temporary source of financial assis-                                 and were forced to resort to TANF for assistance. Conversely,
tance granted under the expectation that recipients are                                     during periods of strong labor market growth, the greater
actively seeking employment or pursuing activities to                                       the number of employment opportunities, the smaller the
improve their chances of future employment.                                                 number of individuals who needed to rely on TANF to make
                                                                                            ends meet. The impact of the Great Recession upon Utah’s
In order to promote compliance with the requirements to                                     economy has most often been expressed in terms of lost
pursue work-related activities, states are given the power                                  jobs. From December 2007 to February 2010, the State of
to impose sanctions in the forms of benefit reductions                                      Utah experienced the largest percentage drop in employ-
and, under some circumstances, the lifetime elimina-                                        ment during the post-World War II era. Data on the number
tion of all benefits. To eliminate the perceived incentive                                  of new TANF cases provides a supplemental measure of the
toward having additional children out of wedlock, states                                    severity of the recession. The seasonally-adjusted number of
are free to impose caps that fix the size of benefits received                              new TANF cases reached a peak of roughly 380 in May 2010,
by each family. Possibly the most significant reform was                                    shortly after the labor market had reached the bottom of the
the imposition of time limits on the receipt of welfare.                                    downturn. This represents the largest number of new TANF
TANF limits individuals to a maximum of five years of                                       cases in any month since the inception of the program in
eligibility for welfare, but states are permitted to impose                                 October 1996. Not only, then, does the TANF data provide
even shorter time limits if they choose. In Utah, the time                                  another illustration of the depths to which the labor market
limit is 36 months. Because individuals can be denied                                       fell during the Great Recession, but it also reveals that TANF
benefits for not participating in work-related activities                                   serves an important function as a social safety net during
or for having exhausted the time limit, one of the most                                     periods of economic duress.


                                                          New TANF Cases and Employment in Utah
                                                                                        January 1996 to October 2011
   The number of new                1,300                                                                                                                                                                                   600
TANF cases is measured
                                    1,200                                                                                                                                                                                   500
   on the right vertical
 axis while employment              1,100                                                                                                                                                                                   400
   is measured on the
   left vertical axis in            1,000                                                                                                                                                                                   300
  thousands. Different
                                     900                                                                                                                                                                                    200
  scales were chosen to
 more clearly reveal the             800                                                                                                                                                                                    100
relationship between the
     two data series.                700                                                                                                                                                                                    0
                                                                                                                                                                                                                 Jan-2011
                                            Jan-1996

                                                       Jan-1997
                                                                  Jan-1998
                                                                             Jan-1999
                                                                                        Jan-2000
                                                                                                   Jan-2001
                                                                                                              Jan-2002

                                                                                                                         Jan-2003


                                                                                                                                               Jan-2005
                                                                                                                                                          Jan-2006
                                                                                                                                                                     Jan-2007
                                                                                                                                                                                Jan-2008
                                                                                                                                                                                           Jan-2009
                                                                                                                                                                                                      Jan-2010
                                                                                                                                    Jan-2004


                                                       Economic Downturns                                          Total Employment in Utah                                            New TANF Cases
                                               Sources: Utah Department of Workforce Services and the Bureau of Labor Statistics.


jobs.utah.gov/wi                                                                                                                                                                                                      Trendlines   13
for your information | by rick little, director, workforce research & analysis division


        Customers Served
        by the Utah Department of Workforce Services
          The Utah Department of Workforce Services             hoping to enhance their careers. A few job seekers are
       (DWS) strengthens Utah’s economy by supporting           from other states as well as foreign countries. More
       the economic stability and quality of the state’s        than half of all job seekers find employment within
       workforce. In preparing its customers to prosper now     three months of their last service.
       and as the workforce of the future, DWS administers
       public services associated with helping employers to        Unemployment Insurance Claimants—
       find qualified workers and assists job seekers to find   Despite fewer claims last year, there were still
       employment.                                              more than 113,000 claimants. As a condition
                                                                of continued eligibility, claimants must seek
          Four primary customer groups are served by DWS:       employment and report progress weekly. More
       employers, job seekers, unemployment insurance           than 80 percent of claimants also receive services
       claimants, and temporary public assistance recipients.   as job seekers. Additional services may be available
       Each of these is defined and quantified below. In        to unemployment insurance claimants such as re-
       addition, DWS partners with education, economic          employment workshops, counseling, and incentives to
       development, and local government agencies to            employers if they hire claimants.
       inform and support shared projects that strengthen
       Utah’s workforce.                                          Temporary Public Assistance
                                                                Recipients—The key to avoiding poverty and
          Employers—There are approximately 85,000              attaining self-sufficiency is employment. Still, there
       worksites in Utah with more than 1.2 million jobs.       are many thousands of families that need supportive
       DWS associates with virtually all employers to fund      services while they seek employment or higher
       the unemployment insurance trust fund that pays          paying job opportunities. Many employers do not
       benefits to eligible workers in the event of layoffs.    provide health insurance benefits. Households
       Fortunately, claims for unemployment insurance are       facing these challenges may qualify for temporary
       down and more than 6,600 of Utah’s worksites have        public assistance such as Food Stamps or Medicaid.
       jobs listed with DWS. Since many of these employers      A few may be eligible for cash assistance. More than
       are the largest in the state, there were more than       500,000 Utahns (including children) received benefits
       240,000 openings available throughout the year at the    last year. Among these recipients, about 240,000 were
       DWS website,www.jobs.utah.gov.                           adults ages 18 to 64. About 42 percent of these adults
                                                                also received employment services as job seekers.
          Job Seekers—During state fiscal year 2011,            DWS is actively working to increase this ratio.
       DWS served 322,000 job seekers ages 18 to 64. At one
       time or another during the year, about 75 percent of        DWS served more than 466,000 adults last year in
       those served were not employed. This count includes      Utah. These services included rendered job search,
       post-secondary students looking for part-time jobs       unemployment insurance, and/or public assistance
       after class and employed persons seeking a second        services which equates to about one in every four
       job for some extra cash. Others have a job but are       adults in the state during state fiscal year 2011.


 14 March/April 2012
DWS also partners with education, economic development, and local
                    government agencies to inform and support shared projects that
                                      strengthen Utah’s workforce.


                                    Distribution of Customers Served
                                    Department of Workforce Services


                                                         Total Distinct Customers = 466,000 customers ages 18 to 64
      Worksites = 85,000                                                     State Fiscal Year 2011


         Employers          ConnJob
          85,000                ectio                        Unemployment
                                        n
                                                               Insurance
                                                               Claimants
                                                                113,000


                                                                                                      Public Assistance
                                                                                                         Recipients
                                                                                                          240,000


                                            Labor Exchange
                                              Customers
                                               322,000


jobs.utah.gov/wi                                                                                                      Trendlines   15
the outlook | by lecia parks langston, economist


                      Profiling Utah's W
                                                                                 hen misused, the word ‘pro-
                                                                                 filing’ can certainly have
                                                                                 some negative connota-
                                                                      tions. But accessing sufficient data to


                      Labor Force—
                                                                      provide a demographic profile is a
                                                                      good thing. Understanding the na-
                                                                      ture of our labor force provides pro-
                                                                      ductive information for planners at
                                                                      the individual, business, and public-

                           It's a Good Thing. . .                     sector level.

                                                                      Fortunately, the American Communi-
                                                                      ty Survey provides a vast storehouse
                                                                      of information about Utah’s labor
                                                                      force. This particular profile includes
                                                                      data from the recently-released 2010
                                                                      one-year estimates.


   Not in labor
                                  Utah Labor
                         Male 55.9%
                                                        Bachelor's                         Unpaid
                                                        degree or                           family
   force 31.6%                                         higher 31.9%                        workers
                         Female                                                              0.1%
                          44.1%
  Employed                                                                                   Self-
   61.8%                                                 Some                              employed
                                                       college or                            4.9%
                                                       associate's
                                                         degree
                                                         37.2%                          Government
  Unemployed                                                                              16.6%
     6.4%                                             High school
                                                       graduate                       Private wage
                                                        23.2%                          and salary
                                                                                          78.4%
                                                        Less than
                                                       high school
                                                      graduate 7.7%

     Employment Status            Gender   Educational Attainment            Class of Worker


16 March/April 2012
The average Utah labor force               have any kind of work-related dis-
participant is most likely employed—       ability. At his place of employment,
although 32 percent of the population      he probably has some type of sales-
is not in the labor force at all. The      related position. He typically works              A vast amount
average labor force participant is
also just slightly more likely to be
                                           almost 37 hours a week earning about
                                           $41,000 a year at his full-time job. If            of information
male than female. He’ll usually
boast some college attendance or an
                                           he is married, his wife is also most
                                           likely a member of the labor force.
                                                                                           about Utah's labor
associate’s degree. He’s most likely to
work for a private sector employer,        Of course, the “average” tells only              force is provided
be about 37 years old, and be white
(not Hispanic). He probably lives in a
                                           one small paragraph of Utah’s labor
                                           force story. As you can see from                 by the American
household with two or more workers.        the accompanying charts, Utah’s
                                           labor force is actually very diverse.
                                                                                           Community Survey
He spends his 21 minute commute            Plus, the work experience of its
driving in a truck, car, or van all by     numerous members is incredibly
himself. He most likely does not           varied.


Force Profile                                                                                       2010   Profile cont. next page


     Age 75+
      0.5%                                           Native                                                      3 or more
                                                 Hawaiian and                                                     workers
 Age 65-74                                       Other Pacific                                                      9.3%
   2.8%                                          Islander 0.9%
                                                                                       White
Age 55-64                                        Black or African                    alone, not                  2 workers
  12.9%                                          American 1.0%                        Hispanic                     31.8%
                                                                                     or Latino
Age 45-54                                        American Indian                       86.7%                     1 worker
  20%                                              and Alaska                                                     38.8%
                                                  Native 1.2%
                                                                                       Hispanic
 Age 25-44                                                                             or Latino                 No workers
   49.5%                                            Other
                                                    5.5%                               origin (of                  20.1%
                                                                                       any race)
 Age 20-24                                                                              13.3%
  14.3%                                               Asian
                                                      2.2%
  Age 16-19
    6.8%                                              White
                                                      91.2%
                Age                       Race                           Ethnicity                  Workers in Household


jobs.utah.gov/wi                                                                                                      Trendlines     17
the outlook | by lecia parks langston, economist


                                                                    For more information about
                                    Other means 1.8%
                                                                       Utah’s labor force from
                                    Public transportation            the American Community
                                             2.1%
                                     Work at home 4.4%
                                                                           Survey, go to:
                                        Walk 2.9%
                                                                   • http://factfinder2.census.gov
                                    Carpool in car, truck, or
                                         van 11.2%

                                   Drive alone in car, truck,
                                        or van 77.6%


                                                                Profile
                Means of Travel to Work


                      Production, transportation,
                         and material moving
                                                                                                    2010 cont.
                          occupations 12.4%
                                                                          Did not work
                                 Natural resources,                          21.9%
                           construction, and maintenance
                                 occupations 9.7%                                Usually
                                                                               work 1 to
                                                                              14 hours per
                                     Sales and office                          week 5.3%
                                    occupations 27.1%

                             Service occupations 15.4%                         Usually work                     No
                                                                                 15 to 34                    disability
                          Healthcare practitioner and                           hours per                     95.6%
                          technical occupations 4.6%                           week 17.7%
                                                                              Usually                         With a
                         Education, legal, community                        work 35 or                       disability
                           service, arts, and media                         more hours                         4.4%
                             occupations 10.8%                               per week
                                                                              55.1%
                         Management, business, and
                         financial occupations 13.8%

              Occupation                                        Usual Hours Worked             Employed by
                                                                                              Disability Status


18 March/April 2012
dws news | by curt stewart, public information officer


Work/Life Awards                                                    2011


Continue to Focus on Employer Best                                                    2011 Work/Life Award
Practices                                                                                   Winners


F
     or the thirteenth year, the De-    •Whole Life Best Scores                  •	   Fehr & Peers – Salt Lake City
     partment of Workforce Services'    Child care, elder care, community
     Office of Work and Family Life     involvement, balance, wellness and
                                                                                 •	   Digital Financial Group – Murray
recognized the state’s best workplac-   education.                               •	   Utah Foster Care Foundation –
es with the Utah Work/Life Awards.                                                    Murray
This year there were twenty winning     •Workplace Excellence Best
companies from around the state,         Scores                                  •	   DigiCert, Inc. – Lindon
ranging from 10 to almost 1,000 em-     A healthy work environment,
ployees. The Utah Work/Life Awards      company culture, employee                •	   Cementation USA Inc. – Sandy
showcase employer best practices        retention and recruiting.
and provide an on-going forum for                                                •	   Cirque Corporation – Salt Lake City
outstanding companies to exchange       •Business & People Success Best
ideas and collaborate on challenges.     Scores                                  •	   Intermountain Financial Group/
                                        Based on training, accountability,            MassMutual – Salt Lake City
The winning companies demon-            professional/personal development
strated a dedication to hiring inter-   and communication.                       •	   Equitable Life & Casualty Insurance
nally and creating cultures of learn-                                                 Company – Salt Lake City
ing, passion and engagement. The        “The Work/Life Awards are designed
“Work Life” awards are a DWS tradi-     to help employers customize and          •	   Software Technology Group – Salt
                                        match their workplace culture and             Lake City
tion that does more than just rec-
ognize an employer’s commitment         needs of their current and future
                                        workforce,” says DWS Executive           •	   Spillman Technologies – Salt Lake
to employees; these awards also re-                                                   City
flect the Department of Workforce       Director Kristen Cox. “Winning the
                                        award is rarely about bells and whis-
Services' mission to connect Utahns
                                        tles. It is about culture and meaning,
                                                                                 •	   CyberSource, a Visa Company –
with employment.                                                                      American Fork
                                        asking and responding.” 
These awards are presented in three                                              •	   Futura Industries – Clearfield
size categories: micro, medium          “Every year this award gets harder
and large organizations each with       and harder to win,” said Lynette Ras-    •	   CLEARLINK – Salt Lake City
varying degrees of cultural depth,      mussen, Director of the Department
workplace identity and clarity of       of Workforce Services’ Office of Work    •	   Marriott Vacation Club
focus. Employees are articulate         & Family Life. “The success of Work/          International, Owner Services – Salt
ambassadors when it comes to            Life   Award-winning       companies          Lake City
describing   impactful     workplace    shows up in many forms, including
experiences and their company’s         improved productivity, customer re-      •	   Nicholas & Co., Inc. – Salt Lake
success in creating an exceptional      lations, retention, recruitment and           City
place to work. The Work/Life            marketing.”
Award focuses on four best practice
                                                                                 •	   South Davis Community Hospital –
                                        The companies recognized by this              Bountiful
categories. Companies that excel
in addressing their employee            award not only reflect the monetary
                                        value of employment but reflect the      •	   Canyons – A Talisker Mountain
and business needs in these areas                                                     Resort – Park City
see high return on investments,         values and importance of family.
                                        The strength of Utah’s workforce
increased    productivity,   loyalty,
                                        and their commitment to their
                                                                                 •	   1-800 CONTACTS, Inc. – Draper
retention, innovation and bottom-
line reward. The awards are based       employees is one of the factors          •	   Automatic Data Processing, Inc. –
on the following criteria:              that allows our state to weather the          West Valley City
                                        storm of the recession and start the
•Flexibility and Benefits Best          recovery ahead of other states. For      •	   Mountain American Credit Union –
 Scores                                 more information and how to apply             West Jordan
Flexible work arrangements, time        for this award next year, contact the
off, family/flex benefits and health    Work and Family Life team at 801-
care.                                   468-0112.


jobs.utah.gov/wi                                                                                                Trendlines   19
the outskirts | by lecia parks langston, economist


          The Highs and the Lows
 of Labor Force


                                                                               in Utah
  Participation
         E
               lection years bring about inevitable conversations regard-
               ing unemployment rates, employment ratios, discouraged
               workers and labor force participation. This article spot-
         lights one aspect of the labor force I’ve always found interesting:
         the labor force participation rate.

         When measuring labor force participation, the usual universe
         includes the population 16 years and older not confined to
         an institution (nursing homes, prisons, etc.). The universe
         includes individuals 65 and older who are typically retired.
         The participation rate is simply the percentage of that universe
         which is active in the labor force.

         To be counted in the labor force, one can either be employed or
         unemployed. Employed persons worked for pay or profit (or at
         least 15 hours in a family-owned business for no pay). A person
         on temporary absence from a job is also included. For example,
         if you are ill, on strike, on vacation, snowed in, or having a baby
         and will be returning to a particular job, you are counted as
         employed.

         Enumerating the unemployed is somewhat trickier. To be counted
         among the unemployed you must be “able and available” for
         work and you must have made some type of job search during
         the last four weeks. An exception to the job-search rule is made
         for workers on temporary layoff.

         Those not “employed” or “unemployed,” are excluded from
         labor force counts—the retired, stay at home parents, discouraged
         workers who have stopped making a job search, and teenagers
         just going to school.

         The American Community Survey five-year estimates (2006-
         2010) which are available for all counties, allow us to compare
         participation rates across Utah. Participation rates vary from
         only 51 percent of the 16 years-and-older population in Daggett
         and Piute counties to 73-75 percent in neighboring Wasatch
         and Summit counties. Studies have shown—particularly


20 March/April 2012
The labor force participation includes
                                 the population 16 years and older, as
                                        well as individuals 65+.

  for women—a high correlation between educational                        participation in individual families to make ends meet.
  attainment and labor force participation. Interestingly,                It seems reasonable to suppose that counties with a
  Summit County also shows the highest proportion of                      high proportion of seniors would show low labor force
  individuals with a bachelor’s degree or higher in the                   participation rates. Statistical analysis indeed shows
  state. Population-dense Wasatch Front metropolitan                      a strong correlation between the percentage of the
  counties all display higher-than-average labor force                    population over the age of 65 and a low labor force
  participation rates. Yet, some small rural counties also                participation rate. Given the fact that women tend to
  maintain high rates—notably Garfield (71 percent) and                   participate in the labor force at a lower rate than men, I
  Wayne (69 percent). Interestingly, both of these counties               thought there might also be a relationship between the
  display a significant tourism-related component to                      share of the labor force that was female and low overall
  their employment base. Perhaps the seasonal, low-pay                    participation rates. Not so. There appears to be only a
  nature of these jobs require a higher rate of worker                    weak correlation between the two.


                2006-2010 Labor Force Participation Rate


                                                                                                       For more information
                                                                                                     about individual county
                                                                                                      labor force data, check
                                                                                                         out the American
                                                                                                        Community Survey
                                                                                                              data at:

                                                                                                      • http://factfinder2.
                                                                                                           census.gov


            Source: U.S. Census Bureau; American Community Survey Five-Year estimate.


jobs.utah.gov/wi                                                                                                               Trendlines   21
occupations | by linda marling church, research analyst


                   System
                  Analysts:
           The Link Between Business
         and Information Technology


         I
             want to streamline a production process within my      solutions and ways that they can be customized to
             company. Sounds simple, right? I want to make a few    benefit your business. For example, they can recommend
             changes here and there and it’s done. While making     the most suitable web application for your business or
         minor changes may sound simple, many questions may         organization and develop ways to incorporate the power
         arise, that if not analyzed and answered carefully may     of multiple web applications in order to solve business
         cost a lot of money and make an inefficient process        problems. They can identify the most efficient software
         even worse. I need new computer equipment and I need       in terms of speed, usability, cost of implementation,
         to plan for the cost and implementation of the new         and maintenance. Utilizing your system analyst to
         system. How long will production be held up, and how       recommend suitable hardware and recommend server
         will this affect my employees? Will I be facing layoffs    architecture will enhance your company‘s bottom line.
         or will I be paying overtime? System analysts make the
         communication between information technology and           Melding the potentially disparate goals of the business
         business departments possible. They bridge the gap         owner, a supervisor, an accountant, a computer
         between what a business wants to do and how it can be      programmer and production worker into a productive
         done, taking into consideration all the consequences of    and profitable system is the task of the system analyst.
         doing so.                                                  Most analysts have computer science or information
                                                                    science degrees. They must understand math, computers,
         System analysts learn the relationships and interactions   planning, and have exceptional communication and
         of your business system and the elements that compose      critical thinking skills. Writing skills are essential
         it. They develop and test strategies for managing the      when gathering information from a variety of sources
         system and improving its outcome. System analysts          and different levels of management. The ability to
         understand the architecture behind different software      explain their systems and give clear instructions and


22 March/April 2012
Most analysts have computer science
                         or information science degrees.
recommendations is key to the success of the analyst.       According to the Bureau of Labor Statistics, employment
Since system analysts work in a variety of fields, a        of computer system analysts is expected to grow by 20
degree that corresponds with the field is often required.   percent from 2008 to 2018, which is a much faster rate
For instance, many MBAs also have a concentration in        than the average occupation. Demand for these workers
information systems, bank system analysts may have          will increase as organizations continue to adopt and
a degree in finance, and an analyst employed by a           integrate increasingly sophisticated technologies and
hospital may have training or experience in health care.    as the need for information security grows. The annual
Since technology is changing rapidly, ongoing training      median wage for this occupation in the United States is
is a must.                                                  about $78,000 for those with a bachelor’s degree.


                                 2008-2018 Employment Projections for
                                      Computer Systems Analysts
                      Current               Projected             Annual %          Total Annual          Star
  Area Name
                    Employment             Employment              Change            Openings            Rating

     Utah -
                         2,871                  3,598                 2.5                140               4
   Statewide
  Metro Utah             2,710                  3,390                 2.5                130               5
   Nonmetro
                          80                     100                   2                  0                 3
     Utah
 United States         532,180                640,270                  2                22,280


                                            Resources:
                                   Utah Economic Data Viewer
                        •	 http://jobs.utah.gov/jsp/wi/utalmis/default.do
                                         •	 www.bls.gov


jobs.utah.gov/wi                                                                                                Trendlines   23
what's happening | by john mathews, economist


                                  A New System
                            of Classifying Occupations
                             by Education and Training
             A new classification structure provides an in-depth
                      look at occupations and needed training.

       J
          ob seekers, students, and anyone interested in work-        This system
          ing want to know what educational and training re-          was used to
          quirements are needed to get started in an occupation.      assign training
       Do I need a degree, work experience in a related occupation,   levels in the
       on-the-job training, or a combination of the three to          Utah        Job
       jump into the world of work? Well, it depends on the oc-       Outlook for
       cupation you are interested in. The U.S. Bureau of Labor       2008-2018. It was
       Statistics (BLS) has developed a new classification system     a one-dimensional classification structure that assigned
       that addresses the question of “delineating the most           one of the above training codes to the list of the some
       common way persons prepare for an occupation.”                 750 occupations in the Utah Job Outlook. What the prior
                                                                      classification system didn’t do was provide the job seeker
       In the past, the BLS has assigned training codes defining      with two other important dimensions for describing
       how workers prepared by determining the typical way one        occupation other than the typical educational level needed
       enters an occupation. This system, which we used at the        for entry. These two included a category defining work
       Department of Workforce Services, specified 11 training        experience in a related occupation, and the typical on-
       levels as the typical method of job entry. This hierarchy      the-job training (including apprenticeship or internship)
       was a continuum starting with academic credentials             needed to attain competency in the occupation.
       (degrees) and ending with basic short-term on-the-job
       training. Here is the list of the 11 education/training        The new system addresses these added dimensions by
       levels:                                                        providing three education/training categories instead of
                                                                      one. First, and similar to the original 11 assignments,
        •	    First professional degree                               is the typical education needed for performing a job.
                                                                      Second, is an indicator of the level of work experience
        •	    Doctoral degree                                         needed in a related occupation, and third, the level of
        •	    Master’s degree                                         on-the-job training called for. Now job seekers can gain
                                                                      a better understanding of what is needed for success in
        •	    Bachelor’s or higher degree, plus work experience
                                                                      a given occupation. Below is a table showing the new
        •	    Bachelor’s degree                                       three-dimensional classification of level of training, work
        •	    Associate degree                                        experience, and on-the-job training (see table 1).

        •	    Postsecondary vocational awards                         By the Numbers—Some notes
        •	    Work experience in a related occupation                 In the Standard Occupational Classification (SOC) system,
        •	    Long-term on-the-job training (including skilled        there are 750 job titles that are assigned 1) a typical level
              and apprenticed trades) training in OJT setting         of education for entry, 2) work experience in a related
              and/or in formal classroom setting for one year or      occupation, and 3) the level of on-the-job training needed
              more                                                    for competency in the occupation. Some occupations
                                                                      only call for the education and training (showing “none”
        •	    Moderate-term on-the-job training—from one              for the work experience and on-the-job training criteria).
              month up to one year                                    Others have a mix of all three. For example, most manager
        •	    Short-term on-the-job training—short                    job titles call for a bachelor’s degree and work experience
              demonstration and observation of less than one          in a related occupation. Engineers need just the bachelor’s
              month.                                                  degree. Cashiers need less than a high school diploma or
                                                                      work experience and the minimum of on-the-job training.
                                                                      Skilled construction trades like electricians and plumbers


24 March/April 2012
Utah Trendlines: March-April 2012

Más contenido relacionado

Destacado

Outils De Veille Pour MéDiathèQues Presentation
Outils De Veille Pour MéDiathèQues PresentationOutils De Veille Pour MéDiathèQues Presentation
Outils De Veille Pour MéDiathèQues Presentationsteftonon
 
KT Tunstall - Suddenly I see
KT Tunstall - Suddenly I seeKT Tunstall - Suddenly I see
KT Tunstall - Suddenly I seePeter Jones
 
Proyecto programación 2
Proyecto programación 2Proyecto programación 2
Proyecto programación 2Carlos Pelukia
 
Xpm e xtreme project management
Xpm   e xtreme project managementXpm   e xtreme project management
Xpm e xtreme project managementGeneXus
 
Vostok offering [JAP]
Vostok offering [JAP]Vostok offering [JAP]
Vostok offering [JAP]Vostok Studio
 
Money kumar and caring for your currency
Money kumar and caring for your currencyMoney kumar and caring for your currency
Money kumar and caring for your currencyManish Chauhan
 
Overview of Thunderbird Online - 2014
Overview of Thunderbird Online - 2014Overview of Thunderbird Online - 2014
Overview of Thunderbird Online - 2014Leslie del Angel
 
Nutrientes Para O Corpo Na Tpm
Nutrientes Para O Corpo Na TpmNutrientes Para O Corpo Na Tpm
Nutrientes Para O Corpo Na TpmMedusa Fabula
 
X2 T05 07 quadratic denominators (2010)
X2 T05 07 quadratic denominators (2010)X2 T05 07 quadratic denominators (2010)
X2 T05 07 quadratic denominators (2010)Nigel Simmons
 
Curso calc tema_1
Curso calc tema_1Curso calc tema_1
Curso calc tema_1milagros
 
Kütahya karayollari 14422
Kütahya karayollari  14422Kütahya karayollari  14422
Kütahya karayollari 14422AlimBey
 
I`View Ipw 2009 Deel 3
I`View Ipw 2009 Deel 3I`View Ipw 2009 Deel 3
I`View Ipw 2009 Deel 3Roelandop
 
Monitoring and controlling the Internet
Monitoring and controlling the InternetMonitoring and controlling the Internet
Monitoring and controlling the Internetblogzilla
 
Swiss International Hotel’s footprint extends in North Africa with Swiss Inte...
Swiss International Hotel’s footprint extends in North Africa with Swiss Inte...Swiss International Hotel’s footprint extends in North Africa with Swiss Inte...
Swiss International Hotel’s footprint extends in North Africa with Swiss Inte...Swiss International Hotels & Resorts
 
Izrael Haifa Zahrady
Izrael Haifa ZahradyIzrael Haifa Zahrady
Izrael Haifa Zahradyguest580998
 

Destacado (20)

Outils De Veille Pour MéDiathèQues Presentation
Outils De Veille Pour MéDiathèQues PresentationOutils De Veille Pour MéDiathèQues Presentation
Outils De Veille Pour MéDiathèQues Presentation
 
KT Tunstall - Suddenly I see
KT Tunstall - Suddenly I seeKT Tunstall - Suddenly I see
KT Tunstall - Suddenly I see
 
Azret
AzretAzret
Azret
 
Xp day ubiqlangpres
Xp day ubiqlangpresXp day ubiqlangpres
Xp day ubiqlangpres
 
Proyecto Patty
Proyecto PattyProyecto Patty
Proyecto Patty
 
Proyecto programación 2
Proyecto programación 2Proyecto programación 2
Proyecto programación 2
 
Xpm e xtreme project management
Xpm   e xtreme project managementXpm   e xtreme project management
Xpm e xtreme project management
 
Vostok offering [JAP]
Vostok offering [JAP]Vostok offering [JAP]
Vostok offering [JAP]
 
Money kumar and caring for your currency
Money kumar and caring for your currencyMoney kumar and caring for your currency
Money kumar and caring for your currency
 
Overview of Thunderbird Online - 2014
Overview of Thunderbird Online - 2014Overview of Thunderbird Online - 2014
Overview of Thunderbird Online - 2014
 
Nutrientes Para O Corpo Na Tpm
Nutrientes Para O Corpo Na TpmNutrientes Para O Corpo Na Tpm
Nutrientes Para O Corpo Na Tpm
 
X2 T05 07 quadratic denominators (2010)
X2 T05 07 quadratic denominators (2010)X2 T05 07 quadratic denominators (2010)
X2 T05 07 quadratic denominators (2010)
 
Curso calc tema_1
Curso calc tema_1Curso calc tema_1
Curso calc tema_1
 
Xanthi2
Xanthi2Xanthi2
Xanthi2
 
Kütahya karayollari 14422
Kütahya karayollari  14422Kütahya karayollari  14422
Kütahya karayollari 14422
 
I`View Ipw 2009 Deel 3
I`View Ipw 2009 Deel 3I`View Ipw 2009 Deel 3
I`View Ipw 2009 Deel 3
 
Monitoring and controlling the Internet
Monitoring and controlling the InternetMonitoring and controlling the Internet
Monitoring and controlling the Internet
 
Swiss International Hotel’s footprint extends in North Africa with Swiss Inte...
Swiss International Hotel’s footprint extends in North Africa with Swiss Inte...Swiss International Hotel’s footprint extends in North Africa with Swiss Inte...
Swiss International Hotel’s footprint extends in North Africa with Swiss Inte...
 
Volante Lineas
Volante LineasVolante Lineas
Volante Lineas
 
Izrael Haifa Zahrady
Izrael Haifa ZahradyIzrael Haifa Zahrady
Izrael Haifa Zahrady
 

Similar a Utah Trendlines: March-April 2012

Trendlines: Winter 2013, Perspectives on Utah's Economy
Trendlines: Winter 2013, Perspectives on Utah's EconomyTrendlines: Winter 2013, Perspectives on Utah's Economy
Trendlines: Winter 2013, Perspectives on Utah's EconomyState of Utah, Salt Lake City
 
Trendlines: Perspectives on Utah's Economy, Nov/Dec 2009
Trendlines: Perspectives on Utah's Economy, Nov/Dec 2009Trendlines: Perspectives on Utah's Economy, Nov/Dec 2009
Trendlines: Perspectives on Utah's Economy, Nov/Dec 2009State of Utah, Salt Lake City
 
Scaffolding for a Growing Team - Surge 2014
Scaffolding for a Growing Team - Surge 2014Scaffolding for a Growing Team - Surge 2014
Scaffolding for a Growing Team - Surge 2014Fran Fabrizio
 
Page 110Discussion questions. What is character. .docx
Page 110Discussion questions. What is character. .docxPage 110Discussion questions. What is character. .docx
Page 110Discussion questions. What is character. .docxalfred4lewis58146
 
SMPDD Hancock Co Workforce Visioning Presentation-Jan 2013
SMPDD Hancock Co Workforce Visioning Presentation-Jan 2013SMPDD Hancock Co Workforce Visioning Presentation-Jan 2013
SMPDD Hancock Co Workforce Visioning Presentation-Jan 2013bellisbrown
 

Similar a Utah Trendlines: March-April 2012 (20)

Trendlines: May-June 2012
Trendlines: May-June 2012Trendlines: May-June 2012
Trendlines: May-June 2012
 
Utah Trendlines, May-Jun 2011
Utah Trendlines, May-Jun 2011Utah Trendlines, May-Jun 2011
Utah Trendlines, May-Jun 2011
 
Trendlines, Spring 2013
Trendlines, Spring 2013Trendlines, Spring 2013
Trendlines, Spring 2013
 
Utah Trendlines: May-June 2010
Utah Trendlines: May-June 2010Utah Trendlines: May-June 2010
Utah Trendlines: May-June 2010
 
Utah Trendlines, Jan-Feb 2011
Utah Trendlines, Jan-Feb 2011Utah Trendlines, Jan-Feb 2011
Utah Trendlines, Jan-Feb 2011
 
Utah Trendlines: Sep-Oct 2009
Utah Trendlines:  Sep-Oct 2009Utah Trendlines:  Sep-Oct 2009
Utah Trendlines: Sep-Oct 2009
 
Utah Trendlines: July - August 2010
Utah Trendlines: July - August 2010Utah Trendlines: July - August 2010
Utah Trendlines: July - August 2010
 
Trendlines: Winter 2013, Perspectives on Utah's Economy
Trendlines: Winter 2013, Perspectives on Utah's EconomyTrendlines: Winter 2013, Perspectives on Utah's Economy
Trendlines: Winter 2013, Perspectives on Utah's Economy
 
Trendlines: Fall 2012
Trendlines: Fall 2012Trendlines: Fall 2012
Trendlines: Fall 2012
 
Utah Trendlines: September - October 2010
Utah Trendlines: September - October 2010Utah Trendlines: September - October 2010
Utah Trendlines: September - October 2010
 
Utah Trendlines: March - April 2011
Utah Trendlines: March - April 2011Utah Trendlines: March - April 2011
Utah Trendlines: March - April 2011
 
Trendlines: Perspectives on Utah's Economy, Nov/Dec 2009
Trendlines: Perspectives on Utah's Economy, Nov/Dec 2009Trendlines: Perspectives on Utah's Economy, Nov/Dec 2009
Trendlines: Perspectives on Utah's Economy, Nov/Dec 2009
 
Utah Trendlines for Jan/Feb 2010
Utah Trendlines for Jan/Feb 2010Utah Trendlines for Jan/Feb 2010
Utah Trendlines for Jan/Feb 2010
 
Utah Trendlines: January-February 2012
Utah Trendlines: January-February 2012Utah Trendlines: January-February 2012
Utah Trendlines: January-February 2012
 
Utah Trendlines March-April 2010
Utah Trendlines March-April 2010Utah Trendlines March-April 2010
Utah Trendlines March-April 2010
 
Utah trendlines, July-August 2011
Utah trendlines, July-August 2011Utah trendlines, July-August 2011
Utah trendlines, July-August 2011
 
KeySpan Strategy@Work Article
KeySpan Strategy@Work ArticleKeySpan Strategy@Work Article
KeySpan Strategy@Work Article
 
Scaffolding for a Growing Team - Surge 2014
Scaffolding for a Growing Team - Surge 2014Scaffolding for a Growing Team - Surge 2014
Scaffolding for a Growing Team - Surge 2014
 
Page 110Discussion questions. What is character. .docx
Page 110Discussion questions. What is character. .docxPage 110Discussion questions. What is character. .docx
Page 110Discussion questions. What is character. .docx
 
SMPDD Hancock Co Workforce Visioning Presentation-Jan 2013
SMPDD Hancock Co Workforce Visioning Presentation-Jan 2013SMPDD Hancock Co Workforce Visioning Presentation-Jan 2013
SMPDD Hancock Co Workforce Visioning Presentation-Jan 2013
 

Más de State of Utah, Salt Lake City

Health Data Transparency: Utah’s All Payer Claims Database
Health Data Transparency: Utah’s All Payer Claims DatabaseHealth Data Transparency: Utah’s All Payer Claims Database
Health Data Transparency: Utah’s All Payer Claims DatabaseState of Utah, Salt Lake City
 
Health Disparities by Utah Legislative District 2019
Health Disparities by Utah Legislative District 2019Health Disparities by Utah Legislative District 2019
Health Disparities by Utah Legislative District 2019State of Utah, Salt Lake City
 
The Utah Geological Survey provides timely scientific information about Utah’...
The Utah Geological Survey provides timely scientific information about Utah’...The Utah Geological Survey provides timely scientific information about Utah’...
The Utah Geological Survey provides timely scientific information about Utah’...State of Utah, Salt Lake City
 
Utah Division of Wildlife Resources Presentation to 2019 Legislature
Utah Division of Wildlife Resources Presentation to 2019 LegislatureUtah Division of Wildlife Resources Presentation to 2019 Legislature
Utah Division of Wildlife Resources Presentation to 2019 LegislatureState of Utah, Salt Lake City
 
Utah Division of Aeronautics Annual Needs and Accomplishments
Utah Division of Aeronautics Annual Needs and AccomplishmentsUtah Division of Aeronautics Annual Needs and Accomplishments
Utah Division of Aeronautics Annual Needs and AccomplishmentsState of Utah, Salt Lake City
 
Fourth Quarter FY2018 Quarterly Report from Utah DCFS
Fourth Quarter FY2018 Quarterly Report from Utah DCFSFourth Quarter FY2018 Quarterly Report from Utah DCFS
Fourth Quarter FY2018 Quarterly Report from Utah DCFSState of Utah, Salt Lake City
 
Transportation Policy and Funding: Historical and Emerging Trends
Transportation Policy and Funding: Historical and Emerging TrendsTransportation Policy and Funding: Historical and Emerging Trends
Transportation Policy and Funding: Historical and Emerging TrendsState of Utah, Salt Lake City
 

Más de State of Utah, Salt Lake City (20)

Utah Veterinary Diagnostic Laboratory
Utah Veterinary Diagnostic LaboratoryUtah Veterinary Diagnostic Laboratory
Utah Veterinary Diagnostic Laboratory
 
Health Data Transparency: Utah’s All Payer Claims Database
Health Data Transparency: Utah’s All Payer Claims DatabaseHealth Data Transparency: Utah’s All Payer Claims Database
Health Data Transparency: Utah’s All Payer Claims Database
 
Utah Division of Juvenile and Justice Services
Utah Division of Juvenile and Justice ServicesUtah Division of Juvenile and Justice Services
Utah Division of Juvenile and Justice Services
 
Health Disparities by Utah Legislative District 2019
Health Disparities by Utah Legislative District 2019Health Disparities by Utah Legislative District 2019
Health Disparities by Utah Legislative District 2019
 
Localscapes
LocalscapesLocalscapes
Localscapes
 
Status of Translocated Tortoises in Southwest Utah
Status of Translocated Tortoises in Southwest UtahStatus of Translocated Tortoises in Southwest Utah
Status of Translocated Tortoises in Southwest Utah
 
The Logan River Observatory
The Logan River ObservatoryThe Logan River Observatory
The Logan River Observatory
 
Utah Strategic Workforce Presentation
Utah Strategic Workforce PresentationUtah Strategic Workforce Presentation
Utah Strategic Workforce Presentation
 
The Utah Geological Survey provides timely scientific information about Utah’...
The Utah Geological Survey provides timely scientific information about Utah’...The Utah Geological Survey provides timely scientific information about Utah’...
The Utah Geological Survey provides timely scientific information about Utah’...
 
Utah Forestry, Fire and State Lands 2019
Utah Forestry, Fire and State Lands 2019Utah Forestry, Fire and State Lands 2019
Utah Forestry, Fire and State Lands 2019
 
Utah Division of Wildlife Resources Presentation to 2019 Legislature
Utah Division of Wildlife Resources Presentation to 2019 LegislatureUtah Division of Wildlife Resources Presentation to 2019 Legislature
Utah Division of Wildlife Resources Presentation to 2019 Legislature
 
UDOT Presentation to 2019 Legislature
UDOT Presentation to 2019 LegislatureUDOT Presentation to 2019 Legislature
UDOT Presentation to 2019 Legislature
 
Utah System of Technical Colleges
Utah System of Technical CollegesUtah System of Technical Colleges
Utah System of Technical Colleges
 
Public Water System Identification in Utah
Public Water System Identification in UtahPublic Water System Identification in Utah
Public Water System Identification in Utah
 
State of Utah Suicide Prevention
State of Utah Suicide PreventionState of Utah Suicide Prevention
State of Utah Suicide Prevention
 
Utah Division of Aeronautics Annual Needs and Accomplishments
Utah Division of Aeronautics Annual Needs and AccomplishmentsUtah Division of Aeronautics Annual Needs and Accomplishments
Utah Division of Aeronautics Annual Needs and Accomplishments
 
Fourth Quarter FY2018 Quarterly Report from Utah DCFS
Fourth Quarter FY2018 Quarterly Report from Utah DCFSFourth Quarter FY2018 Quarterly Report from Utah DCFS
Fourth Quarter FY2018 Quarterly Report from Utah DCFS
 
Update on FirstNet in Utah
Update on FirstNet in UtahUpdate on FirstNet in Utah
Update on FirstNet in Utah
 
Energy Incentives in Utah - 2018 Audit
Energy Incentives in Utah - 2018 AuditEnergy Incentives in Utah - 2018 Audit
Energy Incentives in Utah - 2018 Audit
 
Transportation Policy and Funding: Historical and Emerging Trends
Transportation Policy and Funding: Historical and Emerging TrendsTransportation Policy and Funding: Historical and Emerging Trends
Transportation Policy and Funding: Historical and Emerging Trends
 

Último

Cracking the Cultural Competence Code.pptx
Cracking the Cultural Competence Code.pptxCracking the Cultural Competence Code.pptx
Cracking the Cultural Competence Code.pptxWorkforce Group
 
Call Girls In Panjim North Goa 9971646499 Genuine Service
Call Girls In Panjim North Goa 9971646499 Genuine ServiceCall Girls In Panjim North Goa 9971646499 Genuine Service
Call Girls In Panjim North Goa 9971646499 Genuine Serviceritikaroy0888
 
Dr. Admir Softic_ presentation_Green Club_ENG.pdf
Dr. Admir Softic_ presentation_Green Club_ENG.pdfDr. Admir Softic_ presentation_Green Club_ENG.pdf
Dr. Admir Softic_ presentation_Green Club_ENG.pdfAdmir Softic
 
Pharma Works Profile of Karan Communications
Pharma Works Profile of Karan CommunicationsPharma Works Profile of Karan Communications
Pharma Works Profile of Karan Communicationskarancommunications
 
Mysore Call Girls 8617370543 WhatsApp Number 24x7 Best Services
Mysore Call Girls 8617370543 WhatsApp Number 24x7 Best ServicesMysore Call Girls 8617370543 WhatsApp Number 24x7 Best Services
Mysore Call Girls 8617370543 WhatsApp Number 24x7 Best ServicesDipal Arora
 
Call Girls From Pari Chowk Greater Noida ❤️8448577510 ⊹Best Escorts Service I...
Call Girls From Pari Chowk Greater Noida ❤️8448577510 ⊹Best Escorts Service I...Call Girls From Pari Chowk Greater Noida ❤️8448577510 ⊹Best Escorts Service I...
Call Girls From Pari Chowk Greater Noida ❤️8448577510 ⊹Best Escorts Service I...lizamodels9
 
Call Girls Navi Mumbai Just Call 9907093804 Top Class Call Girl Service Avail...
Call Girls Navi Mumbai Just Call 9907093804 Top Class Call Girl Service Avail...Call Girls Navi Mumbai Just Call 9907093804 Top Class Call Girl Service Avail...
Call Girls Navi Mumbai Just Call 9907093804 Top Class Call Girl Service Avail...Dipal Arora
 
John Halpern sued for sexual assault.pdf
John Halpern sued for sexual assault.pdfJohn Halpern sued for sexual assault.pdf
John Halpern sued for sexual assault.pdfAmzadHosen3
 
Call Girls In Noida 959961⊹3876 Independent Escort Service Noida
Call Girls In Noida 959961⊹3876 Independent Escort Service NoidaCall Girls In Noida 959961⊹3876 Independent Escort Service Noida
Call Girls In Noida 959961⊹3876 Independent Escort Service Noidadlhescort
 
Call Girls Jp Nagar Just Call 👗 7737669865 👗 Top Class Call Girl Service Bang...
Call Girls Jp Nagar Just Call 👗 7737669865 👗 Top Class Call Girl Service Bang...Call Girls Jp Nagar Just Call 👗 7737669865 👗 Top Class Call Girl Service Bang...
Call Girls Jp Nagar Just Call 👗 7737669865 👗 Top Class Call Girl Service Bang...amitlee9823
 
0183760ssssssssssssssssssssssssssss00101011 (27).pdf
0183760ssssssssssssssssssssssssssss00101011 (27).pdf0183760ssssssssssssssssssssssssssss00101011 (27).pdf
0183760ssssssssssssssssssssssssssss00101011 (27).pdfRenandantas16
 
Call Girls Pune Just Call 9907093804 Top Class Call Girl Service Available
Call Girls Pune Just Call 9907093804 Top Class Call Girl Service AvailableCall Girls Pune Just Call 9907093804 Top Class Call Girl Service Available
Call Girls Pune Just Call 9907093804 Top Class Call Girl Service AvailableDipal Arora
 
Russian Call Girls In Gurgaon ❤️8448577510 ⊹Best Escorts Service In 24/7 Delh...
Russian Call Girls In Gurgaon ❤️8448577510 ⊹Best Escorts Service In 24/7 Delh...Russian Call Girls In Gurgaon ❤️8448577510 ⊹Best Escorts Service In 24/7 Delh...
Russian Call Girls In Gurgaon ❤️8448577510 ⊹Best Escorts Service In 24/7 Delh...lizamodels9
 
Value Proposition canvas- Customer needs and pains
Value Proposition canvas- Customer needs and painsValue Proposition canvas- Customer needs and pains
Value Proposition canvas- Customer needs and painsP&CO
 
Phases of Negotiation .pptx
 Phases of Negotiation .pptx Phases of Negotiation .pptx
Phases of Negotiation .pptxnandhinijagan9867
 
MONA 98765-12871 CALL GIRLS IN LUDHIANA LUDHIANA CALL GIRL
MONA 98765-12871 CALL GIRLS IN LUDHIANA LUDHIANA CALL GIRLMONA 98765-12871 CALL GIRLS IN LUDHIANA LUDHIANA CALL GIRL
MONA 98765-12871 CALL GIRLS IN LUDHIANA LUDHIANA CALL GIRLSeo
 
The Path to Product Excellence: Avoiding Common Pitfalls and Enhancing Commun...
The Path to Product Excellence: Avoiding Common Pitfalls and Enhancing Commun...The Path to Product Excellence: Avoiding Common Pitfalls and Enhancing Commun...
The Path to Product Excellence: Avoiding Common Pitfalls and Enhancing Commun...Aggregage
 
Insurers' journeys to build a mastery in the IoT usage
Insurers' journeys to build a mastery in the IoT usageInsurers' journeys to build a mastery in the IoT usage
Insurers' journeys to build a mastery in the IoT usageMatteo Carbone
 
Mondelez State of Snacking and Future Trends 2023
Mondelez State of Snacking and Future Trends 2023Mondelez State of Snacking and Future Trends 2023
Mondelez State of Snacking and Future Trends 2023Neil Kimberley
 
Monthly Social Media Update April 2024 pptx.pptx
Monthly Social Media Update April 2024 pptx.pptxMonthly Social Media Update April 2024 pptx.pptx
Monthly Social Media Update April 2024 pptx.pptxAndy Lambert
 

Último (20)

Cracking the Cultural Competence Code.pptx
Cracking the Cultural Competence Code.pptxCracking the Cultural Competence Code.pptx
Cracking the Cultural Competence Code.pptx
 
Call Girls In Panjim North Goa 9971646499 Genuine Service
Call Girls In Panjim North Goa 9971646499 Genuine ServiceCall Girls In Panjim North Goa 9971646499 Genuine Service
Call Girls In Panjim North Goa 9971646499 Genuine Service
 
Dr. Admir Softic_ presentation_Green Club_ENG.pdf
Dr. Admir Softic_ presentation_Green Club_ENG.pdfDr. Admir Softic_ presentation_Green Club_ENG.pdf
Dr. Admir Softic_ presentation_Green Club_ENG.pdf
 
Pharma Works Profile of Karan Communications
Pharma Works Profile of Karan CommunicationsPharma Works Profile of Karan Communications
Pharma Works Profile of Karan Communications
 
Mysore Call Girls 8617370543 WhatsApp Number 24x7 Best Services
Mysore Call Girls 8617370543 WhatsApp Number 24x7 Best ServicesMysore Call Girls 8617370543 WhatsApp Number 24x7 Best Services
Mysore Call Girls 8617370543 WhatsApp Number 24x7 Best Services
 
Call Girls From Pari Chowk Greater Noida ❤️8448577510 ⊹Best Escorts Service I...
Call Girls From Pari Chowk Greater Noida ❤️8448577510 ⊹Best Escorts Service I...Call Girls From Pari Chowk Greater Noida ❤️8448577510 ⊹Best Escorts Service I...
Call Girls From Pari Chowk Greater Noida ❤️8448577510 ⊹Best Escorts Service I...
 
Call Girls Navi Mumbai Just Call 9907093804 Top Class Call Girl Service Avail...
Call Girls Navi Mumbai Just Call 9907093804 Top Class Call Girl Service Avail...Call Girls Navi Mumbai Just Call 9907093804 Top Class Call Girl Service Avail...
Call Girls Navi Mumbai Just Call 9907093804 Top Class Call Girl Service Avail...
 
John Halpern sued for sexual assault.pdf
John Halpern sued for sexual assault.pdfJohn Halpern sued for sexual assault.pdf
John Halpern sued for sexual assault.pdf
 
Call Girls In Noida 959961⊹3876 Independent Escort Service Noida
Call Girls In Noida 959961⊹3876 Independent Escort Service NoidaCall Girls In Noida 959961⊹3876 Independent Escort Service Noida
Call Girls In Noida 959961⊹3876 Independent Escort Service Noida
 
Call Girls Jp Nagar Just Call 👗 7737669865 👗 Top Class Call Girl Service Bang...
Call Girls Jp Nagar Just Call 👗 7737669865 👗 Top Class Call Girl Service Bang...Call Girls Jp Nagar Just Call 👗 7737669865 👗 Top Class Call Girl Service Bang...
Call Girls Jp Nagar Just Call 👗 7737669865 👗 Top Class Call Girl Service Bang...
 
0183760ssssssssssssssssssssssssssss00101011 (27).pdf
0183760ssssssssssssssssssssssssssss00101011 (27).pdf0183760ssssssssssssssssssssssssssss00101011 (27).pdf
0183760ssssssssssssssssssssssssssss00101011 (27).pdf
 
Call Girls Pune Just Call 9907093804 Top Class Call Girl Service Available
Call Girls Pune Just Call 9907093804 Top Class Call Girl Service AvailableCall Girls Pune Just Call 9907093804 Top Class Call Girl Service Available
Call Girls Pune Just Call 9907093804 Top Class Call Girl Service Available
 
Russian Call Girls In Gurgaon ❤️8448577510 ⊹Best Escorts Service In 24/7 Delh...
Russian Call Girls In Gurgaon ❤️8448577510 ⊹Best Escorts Service In 24/7 Delh...Russian Call Girls In Gurgaon ❤️8448577510 ⊹Best Escorts Service In 24/7 Delh...
Russian Call Girls In Gurgaon ❤️8448577510 ⊹Best Escorts Service In 24/7 Delh...
 
Value Proposition canvas- Customer needs and pains
Value Proposition canvas- Customer needs and painsValue Proposition canvas- Customer needs and pains
Value Proposition canvas- Customer needs and pains
 
Phases of Negotiation .pptx
 Phases of Negotiation .pptx Phases of Negotiation .pptx
Phases of Negotiation .pptx
 
MONA 98765-12871 CALL GIRLS IN LUDHIANA LUDHIANA CALL GIRL
MONA 98765-12871 CALL GIRLS IN LUDHIANA LUDHIANA CALL GIRLMONA 98765-12871 CALL GIRLS IN LUDHIANA LUDHIANA CALL GIRL
MONA 98765-12871 CALL GIRLS IN LUDHIANA LUDHIANA CALL GIRL
 
The Path to Product Excellence: Avoiding Common Pitfalls and Enhancing Commun...
The Path to Product Excellence: Avoiding Common Pitfalls and Enhancing Commun...The Path to Product Excellence: Avoiding Common Pitfalls and Enhancing Commun...
The Path to Product Excellence: Avoiding Common Pitfalls and Enhancing Commun...
 
Insurers' journeys to build a mastery in the IoT usage
Insurers' journeys to build a mastery in the IoT usageInsurers' journeys to build a mastery in the IoT usage
Insurers' journeys to build a mastery in the IoT usage
 
Mondelez State of Snacking and Future Trends 2023
Mondelez State of Snacking and Future Trends 2023Mondelez State of Snacking and Future Trends 2023
Mondelez State of Snacking and Future Trends 2023
 
Monthly Social Media Update April 2024 pptx.pptx
Monthly Social Media Update April 2024 pptx.pptxMonthly Social Media Update April 2024 pptx.pptx
Monthly Social Media Update April 2024 pptx.pptx
 

Utah Trendlines: March-April 2012

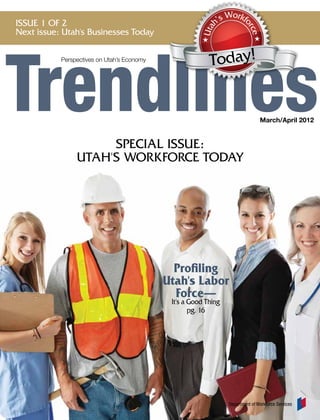
  • 1. o Issue 1 of 2 h’s W rkfo Uta rce Next issue: Utah's Businesses Today Perspectives on Utah’s Economy Today! March/April 2012 Special Issue: Utah's Workforce Today Profiling Utah's Labor Force— It's a Good Thing pg. 16 Department of Workforce Services
  • 2. Trendlines Setting the Pace Utah Department of Workforce Services Executive Director Kristen Cox Workforce Research and Analysis Kristen Cox, Executive Director, Rick Little, Director Department of Workforce Services Carrie Mayne, Editor D ear Readers: Contributors When snowshoeing a few weeks ago, my youngest son once again Mark Knold gave meaning to the statement, “out of the mouth of babes.” During Lecia Parks Langston our hike his older brother turned back to complain about how slow everyone John Mathews else was moving. My six year old shot back, “Well, you’re the one who’s lead- ing!” His comment that the pace of the group was dictated by the one leading Jim Robson was not only cute, but insightful. Before looking to others to find answers or Nate Talley place blame, an effective leader will carefully consider the impact they person- Linda Marling Church ally have in determining the pace and cadence of an organization. John Krantz For me, determining pace and direction are two critical factors to an organiza- MeLauni Jensen tion's success. Too many new projects or too wide a scope can overwhelm the Rick Llittle organization and cause bad multi-tasking while a lack of new efforts or direc- tion may result in obsolescence. Setting the exact pace or individual direction Curt Stewart for everyone involved may be impossible, but having at least an awareness of these issues is a must. Designer Pat Swenson As an outdoor enthusiast, snowshoeing and hiking are some of my favorite recreational activities. Having the right gear makes all of the difference between a successful hike and a miserable one. Likewise, having the right gear or tools within an organization is imperative when it comes to assessing jobs.utah.gov performance, direction, and pace. At a minimum, the following tools are required to be successful: • Clear targets Trendlines is published every other month by the Workforce Research and • Dashboards to track cost, quality, and throughput Analysis Division. To download this publication go to http://jobs.utah.gov/wi. • Structures to track division or unit, as well as organization-wide projects Click on “Publications” and select the one you want from the list. To obtain • Real-time data on how individuals, teams, and divisions/units are per- additional printed copies or to subscribe forming to Trendlines contact: Whether providing valuable information about the economy of Utah; discuss- Department of Workforce Services ing how women and men match up in educational attainment; or weighing Attn: WRA 140 East 300 South • SLC, UT 84111 the value of creating family friendly workplaces to improve productivity and (801) 526-9785 • Fax: (801) 526-9238 employee success; our goal is for Trendlines to be a valuable tool for you to use Email: wipublications@utah.gov in setting the direction and pace of your organization. The Utah Department of Workforce Services is committed to the mission of connecting job seekers The Workforce Research and Analysis and employers and we hope this edition of Trendlines will help you lead the way. Division generates accurate, timely, and understandable data and analyses to provide Sincerely, knowledge of ever-changing workforce environments that support sound planning and decision-making. 2 March/April 2012
  • 3. contents Metropolitan Areas Lead Utah's 5 Employment Growth Wasatch Front and Statewide Women Outperform Men in 6 Educational Attainment Utah's National News Workforce 8 Third Quarter 2010 New Hire Survey Economic Insight Today How Do We Determine the 10 Unemployment Rate? Economic News Welfare, Work, and the Economy 12 Insider News Customers Served by the Introduction 14 Utah Department of Workforce Services to this issue: For Your Information pg. 4 Profiling Utah's Labor Force— 16 It's a Good Thing The Outlook Work/Life Awards Continue to 19 Focus on Employer Best Practices DWS News The Highs and the Lows of pg. 12 20 Labor Force Participation in Utah The Outskirts System Analysts: The Link Between 22 Business and Information Technology Occupations A New System of Classifying 24 Occupations by Education and Training DWS-03-44-0312 What's Happening Equal Opportunity Employer/Program Auxiliary aids and services are available upon request Information to individuals with disabilities by calling (801) 526-9240. Individuals with speech and/or hearing 26 Industry Highlight impairments may call the Relay Utah by dialing 711. Spanish Relay Utah: 1-888-346-3162. Just the Facts... 27 Rate Update jobs.utah.gov/wi Trendlines 3
  • 4. Introduction I n this March/April 2012 edition the tion. Rick Little, the Director of our reader will find Trendlines taking Workforce Research and Analysis a pretty thorough look at Utah’s Division dives in with both feet to economy. Not necessarily a forecast, identify who those customers are. although there are a few glimpses You’ll see that indeed this department into the future by our Chief Economist touches a lot of Utahns. Here's why Mark Knold. Known for his strict Trendlines adherence to the data with an eye on Every issue of Trendlines shines its the past, Mark has an "in the trenches" spotlight on a targeted industry and is worth Insider News. This time we’re taking a feel for the economic churn in Utah. look at the Information industry, and reading... There’s some interesting insight into what do we mean when we say the newly hired employees in Utah over “Information Age? Our Insider News the third quarter of 2011that indi- focuses on Welfare, Work, and the cates that networking really helps Economy, tracing the origin of social when one is seeking a job and previ- programs back to the Social Security ous employer referrals do make a Act of 1935, and how it has evolved difference. into today’s social safety net. Every month the department releases As you’ve read so far Trendlines is its monthly analysis of Utah’s economy about a lot of different topics and in the form of Utah’s Employment subjects. I believe you’ll find it inter- Summary, that report is where the esting and worth the time invested in monthly unemployment rate is reading it. The entire staff at DWS are revealed. As most people know, that’s committed to our mission to connect the number media members wait to Utah job seekers to Utah Employers, report on, and politicians pay close and here you get a good idea on how attention to. If you’ve ever wanted to we go about that. know how economists arrive at that number, read Mark Knold’s analysis on Whether discussing how women page 10. and men match up against each other in educational attainment, or The department’s mission states, the value of creating family friendly the Utah Department of Workforce workplaces to improve productivity Services strengthens Utah's economy and employee success and loyalty, by supporting the economic stability Trendlines will take you there. We and quality of the state’s workforce. invite you pass this edition along When we say workforce we mean just when you have finished reading it and about every segment of the popula- share it with your colleagues. 4 March/April 2012
  • 5. wasatch front and statewide | by mark knold, chief economist Metropolitan Areas Lead Utah’s Employment Growth It is not surprising that most of the growth is along the Wasatch Front U tah’s employment growth for 2011 registered 2.4 percent. A nice rebound considering the prior two years combined for a steep employment contraction. Most of the growth is concentrated along the Wasatch Front. This isn’t necessarily surprising. If Utah’s economy is going to grow, it has to come from the populous metropolitan corridor. Yet many of the state’s rural economies have yet to “perk up.” An energy boom in the Uintah Basin is primarily helping Duchesne and Uintah counties, and a construction project to install windmill energy devices helped Beaver County, but most of the remaining rural counties are not yet experiencing a trickle down effect from the metropolitan area’s expansion. Barring any unforeseen economic shock, Utah should continue to expe- rience notable employment growth throughout 2012, to the degree that will support both metropolitan and rural economic expansion. jobs.utah.gov/wi Trendlines 5
  • 6. national news | by jim robson, economist Women Outperform Men in Educational Attainment O ne very important aspect of U.S. 34 had at least a high school diploma, economic success, prosperity, increasing to 85.2 percent as measured and growth over the decades by the American Community Survey has been increasing educational (ACS) in 2010. Females, 25 to 34 years Recently, one interesting attainment of the populace over time. of age, registered 80.7 percent with at An educated workforce is associated least a high school diploma in 2000, trend has been a with higher productivity, increasing increasing to 89.2 percent in 2010. real incomes, and a better standard of large increase in the living. When you look at college-level educa- tion at the national level, women educational attainment Levels of education have risen steadily in America over the past 70 years. significantly surpassed the level of attainment by men. In 2000, 26.1 In the 1940 Census, 24.5 percent of of women. people age 25 and over had at least a percent of males 25 to 34 years of age had a college diploma or above, high school diploma. By 2010 this had increasing by just one percentage point increased to 85.0 percent, with 27.9 to 27.1 percent by 2010. For women percent having attained a bachelor’s of the same age, measured attainment degree or higher. of a college degree or higher was 22.8 In recent years, one trend of particular percent (3.3 percentage points below note has been the relatively large the men) in 2000, increasing by 12.2 increase in educational attainment percentage points to 35.0 percent in of women. This trend is most 2010. readily illustrated by examining the educational attainment among the Looking at this same data for those younger generation, those 25 to 34 in the 25 to 34 age group in Utah, we years of age. see that men exceeded the educational attainment levels of men nationally The 2000 Census showed nationally for those with at least a high school that 80.1 percent of males, ages 25 to diploma and also for those with a 6 January/February 2012
  • 7. Percent of the Population 25-34 Years of Age with a High School Diploma or Above 92.3 90.4 88.1 89.2 87.3 85.2 80.1 80.7 Utah Utah Utah Utah U.S. U.S. U.S. U.S. 2000 2010 2000 2010 Census ACS* Census ACS* bachelor’s degree or higher (see figures 1 and 2). However, the edge Utah men had in 2000 over their national counterparts has narrowed in both cases. Of concern for Utah, in 2000, 30.0 percent of men had a bachelor’s degree or higher, but Percent of the Population 25-34 Years of Age by 2010 this had dropped to 27.7 with a Bachelor’s Degree or Above percent. For Utah women in the 25 to 34 age group, 92.3 percent—3.1 percentage points above the national level for 35 women—have a high school diploma 30 29.4 or above in 2010. While more Utah 27.7 27.1 women in 2010 have a college degree 26.1 or higher (29.4 percent) than Utah 22.8 22.3 men (27.7 percent), Utah women are 5.6 percentage points below the national level. Utah Utah Utah Utah Traditionally, Utah values educa- U.S. U.S. U.S. U.S. tional attainment and outperforms the levels achieved nationally. How- ever, if current trends continue, 2000 2010 2000 2010 Utah’s educational attainment levels Census ACS* Census ACS* may fall below national averages, particularly the percentage of the population with a bachelor’s degree *ACS—American Community Survey One-Year Estimates and above. Source: U.S. Census Bureau. jobs.utah.gov/wi Trendlines 7
  • 8. economic insight | by nate talley, economist Third Quarter 2010 New Hire Survey Average hourly wage for newly hired employees was $13.39 T he Department of Workforce and national economic environments there were a total of 177,252 new Services (DWS) surveyed a were still experiencing ill effects hires during that time). random sampling of Utah from the most recent recession. The employers who hired a new employee truth is that much of the employer Survey Highlights during the third quarter of 2010. demand for labor persisted during the • The average hourly wage for newly Employers were asked a number referenced quarter. However, it was hired employees was $13.39. of questions about their new hire; offset by job separations and therefore Average hourly wages for the questions designed to provide insight not reflected as net job growth. accommodation and food services as to how the employee was recruited, industry was $8.75 an hour and compensated, and if they were There was an estimated 121,243 new management of companies and retained, among other information. hires in Utah during the third quarter enterprises industry was $22.90 an of 2010 (the Census Bureau’s Local hour. Intuitively, one might speculate that Employment Dynamics program has employer hiring stalled during the a slightly more expansive definition • Fifty-three percent of new hires were third quarter of 2010 since the state of a ‘new hire’ and estimates that appointed to full-time positions. 8 March/April 2012
  • 9. Third Quarter 2010 New Hires and Average Hourly Wages • Eighteen percent of the new hires New Hires Average Hourly Wage were employed on a temporary or 25,000 $25.00 Average Hourly Wage seasonal basis. 20,000 $20.00 New Hires • Approximately 51 percent of the 15,000 $15.00 new hires were found in construc- 10,000 $10.00 tion, retail trade, administrative support, waste management ser- 5,000 $5.00 vices, accommodation and food 0 $0.00 services. These industries generally Agriculture Mining Utilities Construction Manufacturing Wholesale Trade Retail Trade Transportation & Warehousing Information Finance & Insurance Real Estate Prof, Scientific & Technical Management Admin Support & Waste Education Services Healthcare & Social Assistance Arts, Entertainment & Rec Accommodation & Food Other Services Government experience a higher-than-average turnover, meaning that the demand for new hires was likely fueled by the need for replacement labor. • The administrative support and waste management services industry housed almost 17 percent of all new hires during the referenced period. Included in this industry are temporary help and staffing services companies, which are usually the Percent of Third Quarter New Hires first to experience an increase Separated One Year Later in hiring activity following an economic downturn. 70% 60% • Only 55 percent of the newly hired 50% 40% employees remained employed by 30% the hiring organization one year 20% later. This indicates that at least for 10% the positions that were filled by the 0% newly hired employee, employment Agriculture Mining Utilities Construction Manufacturing Wholesale Trade Retail Trade Transportation & Warehousing Information Finance & Insurance Real Estate Prof, Scientific & Technical Management Admin Support & Waste Education Services Healthcare & Social Assistance Arts, Entertainment & Rec Accommodation & Food Other Services Government longevity is not standard. As seen in figure 2, separation statistics vary considerably by industry. • About 65 percent of all newly hired employees discovered the job opening through networking or word of mouth. Likewise, over 42 percent of employers stated that a referral from a friend, family member, or previous employee was one of the most influential For additional information on the DWS factors of the hiring decision. These statistics suggest that informal New Hires Survey contact Nate Talley channels of job search and job at natetalley@utah.gov. matching remain prevalent in the labor market. jobs.utah.gov/wi Trendlines 9
  • 10. economic news | by mark knold, chief economist How Do We Determine The Unemployment Rate? Share of Total Household Contrary to what you might think, Income in Utah by unemployment benefits are not the Quintiles 2010 primary factor in the unemployment rate calculation. U nemployment rates are among the most frequently state-level unemployment rate calculation, and in some referenced indicators of labor market health. states, they are not used at all. Given the ubiquitous nature of these rates, it is important to understand the methods through which To be counted as unemployed, one must be without a job they are derived. and seeking work. If one is without a job, yet is not looking for a job, then the individual is not considered unemployed Unemployment rates are calculated and owned by under the official definition of unemployment. the federal government—more specifically, the U.S. Bureau of Labor Statistics (BLS). It is this federal agency There are three ways through which people become that determines not only the national unemployment unemployed. The first is to lose a job (job losses could take rate, but rates for all states, counties, metropolitan the form of a layoff, firing, expiration of temporary job, areas, and cities (with a population of 25,000 or more). etc.). The second is to voluntarily leave a job. The third is Advantages of the federally defined approach to the to newly enter the labor force (for example, students who production of unemployment rates are numerous. First, a graduate and begin seeking work) or to return to the labor centralized methodology allows for the standardization of force after a period of absence. Unemployment benefits unemployment rate estimates, which means that rates can are only available to those in the first category, and even be compared across different states, counties, and other then, not all are eligible. Therefore, unemployment areas. Second, since the release of updated unemployment insurance activity only includes a fraction of those who rates usually elicit a strong market response, a federally are unemployed. Nationally, about one-third of the imposed release schedule helps to add some predictability unemployed are on the roles of unemployment insurance. to when the newest unemployment rates will be available. In Utah, an even smaller percentage of the unemployed Finally, a centrally driven estimate production process are captured by unemployment insurance statistics. helps to keep unemployment rates insulated from local political influence. Since those leaving jobs and those entering or re- entering the labor force are generally not eligible to Contrary to what many people believe, unemployment collect unemployment insurance, a more comprehensive insurance claims (unemployment benefits) are not the method is needed to fully estimate the volume of the primary factor in the unemployment rate calculation. unemployed. This is done through a monthly survey Instead, a monthly national survey is the driving force. called the Current Population Survey (commonly Unemployment claims are just a small portion of the referred to as the Household Survey). This is administered 10 March/April 2012
  • 11. Utah Unemployed by Reason Utah Unemployed December 2010-November 2011 December 2010-November 2011 Job Leavers 9% Looking for Part-Time Work 17% Job Losers Looking for Entrants/ 59% Full-Time Re-entrants Work 32% 83% Source: U.S. Census Bureau, Current Population Statistics. • http://www.bls.gov/gps/notescps.htm monthly to 60,000 households nationwide by the U.S. unemployment rate. Utah provides the unemployment Census Bureau, at the behest and financing of the Bureau insurance claims data, and the federal government of Labor Statistics. Selected households rotate in and out supplies the remaining inputs and makes the calculation. of the survey—in for four months, out for eight, back in for four, then finished. In addition to questions regarding Each month, Utah announces and profiles both demographic information such as age, race, and gender, Utah’s unemployment rate and employment growth individuals are asked whether they were employed, how estimation, but those numbers are generated by the many hours they worked, what industry they worked in, federal government. The federal government asks along with many other questions related to their labor states to issue a monthly announcement to put a local market activities. For interviewees who were not working, analytical perspective on the data; however, the states do the survey asks whether they are looking for a job, the not generate nor “own” the data. methods used to find a job, and so forth. It provides detailed survey information of monthly household labor The process that generates the unemployment rate is market activity. not perfect—it simply produces an estimate. The key to it all comes down to the definition, which centers upon The survey results produce the national unemployment activity. Is an individual without work and looking for a rate. But at the state and local level, the monthly survey job? It is theoretically possible for all unemployed people sample size is not considered statistically strong enough to stop looking for a job. The unemployment rate would to produce the unemployment rate on its own (700 then fall to zero. The unemployment rate statistics suggest households monthly in Utah). Therefore, each state’s that some of the recent unemployment rate decline can survey results are combined with historical data to be attributed to unemployed people no longer looking construct an econometric model, out of which comes for work. the state’s official unemployment rate estimation. The inputs into this model are not only historical data and The unemployment rate can also decline as people find the current survey results, but also the recent amount of jobs. They leave the ranks of the unemployed and become unemployment insurance claims (although this input’s employed. With 36,000 jobs created in Utah over the past influence with the model varies by state—it does not year, job gains are also part of the recent unemployment have a strong influence in Utah), current estimates rate decline. of Utah employment growth or contraction, Utah population estimates, and other economic variables. The Additionally, variability in the survey can occasionally be most influential factor in the model is the current survey significant enough that unemployment movements can results, yet the other variables help to stabilize monthly be partially attributed to this factor. In the case of the fluctuations that are inherent and potentially sizable due current unemployment rate decline, survey variability to the survey’s small sample size. also appears to be an influencing factor. Job gains, labor force exits, and survey variability are currently The federal government designs the model. The survey all contributing factors in the state’s recent noticeable provides the data for the model. The model produces the unemployment rate decline. jobs.utah.gov/wi Trendlines 11
  • 12. insider news | by john krantz, economist Welfare, Work, and the Economy A background on welfare for mothers with dependent children and how numbers of new entrants coincide with economic times. T he social program known as welfare traces its origin public either accepted the program as satisfying a back to the Great Depression, when it was created legitimate social need or was at least unconcerned with as part of the Social Security Act of 1935. The pro- it. However, the broad social changes of the 1960s would gram was originally known as Aid to Dependent Children drastically alter the public’s opinion toward welfare, and later as Aid to Families with Dependent Children providing an impetus toward reform. Perhaps the (AFDC), the title the program would retain through the most influential social change was the steady increase mid-1990s. The program was designed to provide sup- in the percent of working mothers. Only 28 percent port to mothers with dependent children whose fathers of women with children worked outside of the home had left the family, become incapacitated, or died. The in 1960, but by the 1990s this figure rose to nearly 70 legislation was motivated by a 1934 study conducted by percent. Consequently, public opinion shifted away from the Committee on Economic Security that found 8 mil- the view that mothers need to be home taking care of lion children living in families receiving unemployment children toward the view that mothers can and should relief, a number equal to approximately 22 percent of all work outside of the home. Two other social trends served children under the age of 16 in the U.S. The study warned to foster an overall negative view of welfare among the that these children were exposed to a significant risk of public. From 1960 to the mid-1980s, the divorce rate more delinquency or serious neglect and prescribed financial than doubled and the percentage of births to unmarried assistance to protect children from this risk. women quadrupled. Some argued that these trends were the direct results of welfare on the basis that there were During the first 25 years of AFDC, the program operated financial incentives toward divorce, never marrying, and as intended, caseloads were relatively low, and the general out-of-wedlock childbearing. Regardless of the validity of 12 March/April 2012
  • 13. such arguments, the ever-growing share of the public that important facts about welfare under TANF is that, strictly had developed an unfavorable opinion of welfare served speaking, it is no longer an entitlement program. to embolden policymakers to legislate major reforms to the program. Turning to economic matters, the health of Utah’s labor market and the number of new entrants into TANF exhibit Welfare reform was achieved with the passing of the an inverse relationship that is clearly discernable in the Personal Responsibility and Work Opportunities Recon- accompanying graph. The economic downturns are defined ciliation Act of 1996, which dismantled AFDC and put in as periods where the labor market was contracting in Utah. its place Temporary Assistance for Needy Families (TANF). As expected, when the demand for labor decreased, a greater The new program was designed around the central tenet number of individuals were unable to secure employment that welfare is only a temporary source of financial assis- and were forced to resort to TANF for assistance. Conversely, tance granted under the expectation that recipients are during periods of strong labor market growth, the greater actively seeking employment or pursuing activities to the number of employment opportunities, the smaller the improve their chances of future employment. number of individuals who needed to rely on TANF to make ends meet. The impact of the Great Recession upon Utah’s In order to promote compliance with the requirements to economy has most often been expressed in terms of lost pursue work-related activities, states are given the power jobs. From December 2007 to February 2010, the State of to impose sanctions in the forms of benefit reductions Utah experienced the largest percentage drop in employ- and, under some circumstances, the lifetime elimina- ment during the post-World War II era. Data on the number tion of all benefits. To eliminate the perceived incentive of new TANF cases provides a supplemental measure of the toward having additional children out of wedlock, states severity of the recession. The seasonally-adjusted number of are free to impose caps that fix the size of benefits received new TANF cases reached a peak of roughly 380 in May 2010, by each family. Possibly the most significant reform was shortly after the labor market had reached the bottom of the the imposition of time limits on the receipt of welfare. downturn. This represents the largest number of new TANF TANF limits individuals to a maximum of five years of cases in any month since the inception of the program in eligibility for welfare, but states are permitted to impose October 1996. Not only, then, does the TANF data provide even shorter time limits if they choose. In Utah, the time another illustration of the depths to which the labor market limit is 36 months. Because individuals can be denied fell during the Great Recession, but it also reveals that TANF benefits for not participating in work-related activities serves an important function as a social safety net during or for having exhausted the time limit, one of the most periods of economic duress. New TANF Cases and Employment in Utah January 1996 to October 2011 The number of new 1,300 600 TANF cases is measured 1,200 500 on the right vertical axis while employment 1,100 400 is measured on the left vertical axis in 1,000 300 thousands. Different 900 200 scales were chosen to more clearly reveal the 800 100 relationship between the two data series. 700 0 Jan-2011 Jan-1996 Jan-1997 Jan-1998 Jan-1999 Jan-2000 Jan-2001 Jan-2002 Jan-2003 Jan-2005 Jan-2006 Jan-2007 Jan-2008 Jan-2009 Jan-2010 Jan-2004 Economic Downturns Total Employment in Utah New TANF Cases Sources: Utah Department of Workforce Services and the Bureau of Labor Statistics. jobs.utah.gov/wi Trendlines 13
  • 14. for your information | by rick little, director, workforce research & analysis division Customers Served by the Utah Department of Workforce Services The Utah Department of Workforce Services hoping to enhance their careers. A few job seekers are (DWS) strengthens Utah’s economy by supporting from other states as well as foreign countries. More the economic stability and quality of the state’s than half of all job seekers find employment within workforce. In preparing its customers to prosper now three months of their last service. and as the workforce of the future, DWS administers public services associated with helping employers to Unemployment Insurance Claimants— find qualified workers and assists job seekers to find Despite fewer claims last year, there were still employment. more than 113,000 claimants. As a condition of continued eligibility, claimants must seek Four primary customer groups are served by DWS: employment and report progress weekly. More employers, job seekers, unemployment insurance than 80 percent of claimants also receive services claimants, and temporary public assistance recipients. as job seekers. Additional services may be available Each of these is defined and quantified below. In to unemployment insurance claimants such as re- addition, DWS partners with education, economic employment workshops, counseling, and incentives to development, and local government agencies to employers if they hire claimants. inform and support shared projects that strengthen Utah’s workforce. Temporary Public Assistance Recipients—The key to avoiding poverty and Employers—There are approximately 85,000 attaining self-sufficiency is employment. Still, there worksites in Utah with more than 1.2 million jobs. are many thousands of families that need supportive DWS associates with virtually all employers to fund services while they seek employment or higher the unemployment insurance trust fund that pays paying job opportunities. Many employers do not benefits to eligible workers in the event of layoffs. provide health insurance benefits. Households Fortunately, claims for unemployment insurance are facing these challenges may qualify for temporary down and more than 6,600 of Utah’s worksites have public assistance such as Food Stamps or Medicaid. jobs listed with DWS. Since many of these employers A few may be eligible for cash assistance. More than are the largest in the state, there were more than 500,000 Utahns (including children) received benefits 240,000 openings available throughout the year at the last year. Among these recipients, about 240,000 were DWS website,www.jobs.utah.gov. adults ages 18 to 64. About 42 percent of these adults also received employment services as job seekers. Job Seekers—During state fiscal year 2011, DWS is actively working to increase this ratio. DWS served 322,000 job seekers ages 18 to 64. At one time or another during the year, about 75 percent of DWS served more than 466,000 adults last year in those served were not employed. This count includes Utah. These services included rendered job search, post-secondary students looking for part-time jobs unemployment insurance, and/or public assistance after class and employed persons seeking a second services which equates to about one in every four job for some extra cash. Others have a job but are adults in the state during state fiscal year 2011. 14 March/April 2012
  • 15. DWS also partners with education, economic development, and local government agencies to inform and support shared projects that strengthen Utah’s workforce. Distribution of Customers Served Department of Workforce Services Total Distinct Customers = 466,000 customers ages 18 to 64 Worksites = 85,000 State Fiscal Year 2011 Employers ConnJob 85,000 ectio Unemployment n Insurance Claimants 113,000 Public Assistance Recipients 240,000 Labor Exchange Customers 322,000 jobs.utah.gov/wi Trendlines 15
  • 16. the outlook | by lecia parks langston, economist Profiling Utah's W hen misused, the word ‘pro- filing’ can certainly have some negative connota- tions. But accessing sufficient data to Labor Force— provide a demographic profile is a good thing. Understanding the na- ture of our labor force provides pro- ductive information for planners at the individual, business, and public- It's a Good Thing. . . sector level. Fortunately, the American Communi- ty Survey provides a vast storehouse of information about Utah’s labor force. This particular profile includes data from the recently-released 2010 one-year estimates. Not in labor Utah Labor Male 55.9% Bachelor's Unpaid degree or family force 31.6% higher 31.9% workers Female 0.1% 44.1% Employed Self- 61.8% Some employed college or 4.9% associate's degree 37.2% Government Unemployed 16.6% 6.4% High school graduate Private wage 23.2% and salary 78.4% Less than high school graduate 7.7% Employment Status Gender Educational Attainment Class of Worker 16 March/April 2012
  • 17. The average Utah labor force have any kind of work-related dis- participant is most likely employed— ability. At his place of employment, although 32 percent of the population he probably has some type of sales- is not in the labor force at all. The related position. He typically works A vast amount average labor force participant is also just slightly more likely to be almost 37 hours a week earning about $41,000 a year at his full-time job. If of information male than female. He’ll usually boast some college attendance or an he is married, his wife is also most likely a member of the labor force. about Utah's labor associate’s degree. He’s most likely to work for a private sector employer, Of course, the “average” tells only force is provided be about 37 years old, and be white (not Hispanic). He probably lives in a one small paragraph of Utah’s labor force story. As you can see from by the American household with two or more workers. the accompanying charts, Utah’s labor force is actually very diverse. Community Survey He spends his 21 minute commute Plus, the work experience of its driving in a truck, car, or van all by numerous members is incredibly himself. He most likely does not varied. Force Profile 2010 Profile cont. next page Age 75+ 0.5% Native 3 or more Hawaiian and workers Age 65-74 Other Pacific 9.3% 2.8% Islander 0.9% White Age 55-64 Black or African alone, not 2 workers 12.9% American 1.0% Hispanic 31.8% or Latino Age 45-54 American Indian 86.7% 1 worker 20% and Alaska 38.8% Native 1.2% Hispanic Age 25-44 or Latino No workers 49.5% Other 5.5% origin (of 20.1% any race) Age 20-24 13.3% 14.3% Asian 2.2% Age 16-19 6.8% White 91.2% Age Race Ethnicity Workers in Household jobs.utah.gov/wi Trendlines 17
  • 18. the outlook | by lecia parks langston, economist For more information about Other means 1.8% Utah’s labor force from Public transportation the American Community 2.1% Work at home 4.4% Survey, go to: Walk 2.9% • http://factfinder2.census.gov Carpool in car, truck, or van 11.2% Drive alone in car, truck, or van 77.6% Profile Means of Travel to Work Production, transportation, and material moving 2010 cont. occupations 12.4% Did not work Natural resources, 21.9% construction, and maintenance occupations 9.7% Usually work 1 to 14 hours per Sales and office week 5.3% occupations 27.1% Service occupations 15.4% Usually work No 15 to 34 disability Healthcare practitioner and hours per 95.6% technical occupations 4.6% week 17.7% Usually With a Education, legal, community work 35 or disability service, arts, and media more hours 4.4% occupations 10.8% per week 55.1% Management, business, and financial occupations 13.8% Occupation Usual Hours Worked Employed by Disability Status 18 March/April 2012
  • 19. dws news | by curt stewart, public information officer Work/Life Awards 2011 Continue to Focus on Employer Best 2011 Work/Life Award Practices Winners F or the thirteenth year, the De- •Whole Life Best Scores • Fehr & Peers – Salt Lake City partment of Workforce Services' Child care, elder care, community Office of Work and Family Life involvement, balance, wellness and • Digital Financial Group – Murray recognized the state’s best workplac- education. • Utah Foster Care Foundation – es with the Utah Work/Life Awards. Murray This year there were twenty winning •Workplace Excellence Best companies from around the state, Scores • DigiCert, Inc. – Lindon ranging from 10 to almost 1,000 em- A healthy work environment, ployees. The Utah Work/Life Awards company culture, employee • Cementation USA Inc. – Sandy showcase employer best practices retention and recruiting. and provide an on-going forum for • Cirque Corporation – Salt Lake City outstanding companies to exchange •Business & People Success Best ideas and collaborate on challenges. Scores • Intermountain Financial Group/ Based on training, accountability, MassMutual – Salt Lake City The winning companies demon- professional/personal development strated a dedication to hiring inter- and communication. • Equitable Life & Casualty Insurance nally and creating cultures of learn- Company – Salt Lake City ing, passion and engagement. The “The Work/Life Awards are designed “Work Life” awards are a DWS tradi- to help employers customize and • Software Technology Group – Salt match their workplace culture and Lake City tion that does more than just rec- ognize an employer’s commitment needs of their current and future workforce,” says DWS Executive • Spillman Technologies – Salt Lake to employees; these awards also re- City flect the Department of Workforce Director Kristen Cox. “Winning the award is rarely about bells and whis- Services' mission to connect Utahns tles. It is about culture and meaning, • CyberSource, a Visa Company – with employment. American Fork asking and responding.”  These awards are presented in three • Futura Industries – Clearfield size categories: micro, medium “Every year this award gets harder and large organizations each with and harder to win,” said Lynette Ras- • CLEARLINK – Salt Lake City varying degrees of cultural depth, mussen, Director of the Department workplace identity and clarity of of Workforce Services’ Office of Work • Marriott Vacation Club focus. Employees are articulate & Family Life. “The success of Work/ International, Owner Services – Salt ambassadors when it comes to Life Award-winning companies Lake City describing impactful workplace shows up in many forms, including experiences and their company’s improved productivity, customer re- • Nicholas & Co., Inc. – Salt Lake success in creating an exceptional lations, retention, recruitment and City place to work. The Work/Life marketing.” Award focuses on four best practice • South Davis Community Hospital – The companies recognized by this Bountiful categories. Companies that excel in addressing their employee award not only reflect the monetary value of employment but reflect the • Canyons – A Talisker Mountain and business needs in these areas Resort – Park City see high return on investments, values and importance of family. The strength of Utah’s workforce increased productivity, loyalty, and their commitment to their • 1-800 CONTACTS, Inc. – Draper retention, innovation and bottom- line reward. The awards are based employees is one of the factors • Automatic Data Processing, Inc. – on the following criteria: that allows our state to weather the West Valley City storm of the recession and start the •Flexibility and Benefits Best recovery ahead of other states. For • Mountain American Credit Union – Scores more information and how to apply West Jordan Flexible work arrangements, time for this award next year, contact the off, family/flex benefits and health Work and Family Life team at 801- care. 468-0112. jobs.utah.gov/wi Trendlines 19
  • 20. the outskirts | by lecia parks langston, economist The Highs and the Lows of Labor Force in Utah Participation E lection years bring about inevitable conversations regard- ing unemployment rates, employment ratios, discouraged workers and labor force participation. This article spot- lights one aspect of the labor force I’ve always found interesting: the labor force participation rate. When measuring labor force participation, the usual universe includes the population 16 years and older not confined to an institution (nursing homes, prisons, etc.). The universe includes individuals 65 and older who are typically retired. The participation rate is simply the percentage of that universe which is active in the labor force. To be counted in the labor force, one can either be employed or unemployed. Employed persons worked for pay or profit (or at least 15 hours in a family-owned business for no pay). A person on temporary absence from a job is also included. For example, if you are ill, on strike, on vacation, snowed in, or having a baby and will be returning to a particular job, you are counted as employed. Enumerating the unemployed is somewhat trickier. To be counted among the unemployed you must be “able and available” for work and you must have made some type of job search during the last four weeks. An exception to the job-search rule is made for workers on temporary layoff. Those not “employed” or “unemployed,” are excluded from labor force counts—the retired, stay at home parents, discouraged workers who have stopped making a job search, and teenagers just going to school. The American Community Survey five-year estimates (2006- 2010) which are available for all counties, allow us to compare participation rates across Utah. Participation rates vary from only 51 percent of the 16 years-and-older population in Daggett and Piute counties to 73-75 percent in neighboring Wasatch and Summit counties. Studies have shown—particularly 20 March/April 2012
  • 21. The labor force participation includes the population 16 years and older, as well as individuals 65+. for women—a high correlation between educational participation in individual families to make ends meet. attainment and labor force participation. Interestingly, It seems reasonable to suppose that counties with a Summit County also shows the highest proportion of high proportion of seniors would show low labor force individuals with a bachelor’s degree or higher in the participation rates. Statistical analysis indeed shows state. Population-dense Wasatch Front metropolitan a strong correlation between the percentage of the counties all display higher-than-average labor force population over the age of 65 and a low labor force participation rates. Yet, some small rural counties also participation rate. Given the fact that women tend to maintain high rates—notably Garfield (71 percent) and participate in the labor force at a lower rate than men, I Wayne (69 percent). Interestingly, both of these counties thought there might also be a relationship between the display a significant tourism-related component to share of the labor force that was female and low overall their employment base. Perhaps the seasonal, low-pay participation rates. Not so. There appears to be only a nature of these jobs require a higher rate of worker weak correlation between the two. 2006-2010 Labor Force Participation Rate For more information about individual county labor force data, check out the American Community Survey data at: • http://factfinder2. census.gov Source: U.S. Census Bureau; American Community Survey Five-Year estimate. jobs.utah.gov/wi Trendlines 21
  • 22. occupations | by linda marling church, research analyst System Analysts: The Link Between Business and Information Technology I want to streamline a production process within my solutions and ways that they can be customized to company. Sounds simple, right? I want to make a few benefit your business. For example, they can recommend changes here and there and it’s done. While making the most suitable web application for your business or minor changes may sound simple, many questions may organization and develop ways to incorporate the power arise, that if not analyzed and answered carefully may of multiple web applications in order to solve business cost a lot of money and make an inefficient process problems. They can identify the most efficient software even worse. I need new computer equipment and I need in terms of speed, usability, cost of implementation, to plan for the cost and implementation of the new and maintenance. Utilizing your system analyst to system. How long will production be held up, and how recommend suitable hardware and recommend server will this affect my employees? Will I be facing layoffs architecture will enhance your company‘s bottom line. or will I be paying overtime? System analysts make the communication between information technology and Melding the potentially disparate goals of the business business departments possible. They bridge the gap owner, a supervisor, an accountant, a computer between what a business wants to do and how it can be programmer and production worker into a productive done, taking into consideration all the consequences of and profitable system is the task of the system analyst. doing so. Most analysts have computer science or information science degrees. They must understand math, computers, System analysts learn the relationships and interactions planning, and have exceptional communication and of your business system and the elements that compose critical thinking skills. Writing skills are essential it. They develop and test strategies for managing the when gathering information from a variety of sources system and improving its outcome. System analysts and different levels of management. The ability to understand the architecture behind different software explain their systems and give clear instructions and 22 March/April 2012
  • 23. Most analysts have computer science or information science degrees. recommendations is key to the success of the analyst. According to the Bureau of Labor Statistics, employment Since system analysts work in a variety of fields, a of computer system analysts is expected to grow by 20 degree that corresponds with the field is often required. percent from 2008 to 2018, which is a much faster rate For instance, many MBAs also have a concentration in than the average occupation. Demand for these workers information systems, bank system analysts may have will increase as organizations continue to adopt and a degree in finance, and an analyst employed by a integrate increasingly sophisticated technologies and hospital may have training or experience in health care. as the need for information security grows. The annual Since technology is changing rapidly, ongoing training median wage for this occupation in the United States is is a must. about $78,000 for those with a bachelor’s degree. 2008-2018 Employment Projections for Computer Systems Analysts Current Projected Annual % Total Annual Star Area Name Employment Employment Change Openings Rating Utah - 2,871 3,598 2.5 140 4 Statewide Metro Utah 2,710 3,390 2.5 130 5 Nonmetro 80 100 2 0 3 Utah United States 532,180 640,270 2 22,280 Resources: Utah Economic Data Viewer • http://jobs.utah.gov/jsp/wi/utalmis/default.do • www.bls.gov jobs.utah.gov/wi Trendlines 23
  • 24. what's happening | by john mathews, economist A New System of Classifying Occupations by Education and Training A new classification structure provides an in-depth look at occupations and needed training. J ob seekers, students, and anyone interested in work- This system ing want to know what educational and training re- was used to quirements are needed to get started in an occupation. assign training Do I need a degree, work experience in a related occupation, levels in the on-the-job training, or a combination of the three to Utah Job jump into the world of work? Well, it depends on the oc- Outlook for cupation you are interested in. The U.S. Bureau of Labor 2008-2018. It was Statistics (BLS) has developed a new classification system a one-dimensional classification structure that assigned that addresses the question of “delineating the most one of the above training codes to the list of the some common way persons prepare for an occupation.” 750 occupations in the Utah Job Outlook. What the prior classification system didn’t do was provide the job seeker In the past, the BLS has assigned training codes defining with two other important dimensions for describing how workers prepared by determining the typical way one occupation other than the typical educational level needed enters an occupation. This system, which we used at the for entry. These two included a category defining work Department of Workforce Services, specified 11 training experience in a related occupation, and the typical on- levels as the typical method of job entry. This hierarchy the-job training (including apprenticeship or internship) was a continuum starting with academic credentials needed to attain competency in the occupation. (degrees) and ending with basic short-term on-the-job training. Here is the list of the 11 education/training The new system addresses these added dimensions by levels: providing three education/training categories instead of one. First, and similar to the original 11 assignments, • First professional degree is the typical education needed for performing a job. Second, is an indicator of the level of work experience • Doctoral degree needed in a related occupation, and third, the level of • Master’s degree on-the-job training called for. Now job seekers can gain a better understanding of what is needed for success in • Bachelor’s or higher degree, plus work experience a given occupation. Below is a table showing the new • Bachelor’s degree three-dimensional classification of level of training, work • Associate degree experience, and on-the-job training (see table 1). • Postsecondary vocational awards By the Numbers—Some notes • Work experience in a related occupation In the Standard Occupational Classification (SOC) system, • Long-term on-the-job training (including skilled there are 750 job titles that are assigned 1) a typical level and apprenticed trades) training in OJT setting of education for entry, 2) work experience in a related and/or in formal classroom setting for one year or occupation, and 3) the level of on-the-job training needed more for competency in the occupation. Some occupations only call for the education and training (showing “none” • Moderate-term on-the-job training—from one for the work experience and on-the-job training criteria). month up to one year Others have a mix of all three. For example, most manager • Short-term on-the-job training—short job titles call for a bachelor’s degree and work experience demonstration and observation of less than one in a related occupation. Engineers need just the bachelor’s month. degree. Cashiers need less than a high school diploma or work experience and the minimum of on-the-job training. Skilled construction trades like electricians and plumbers 24 March/April 2012