Trend visionreport rancho mirage
•
0 recomendaciones•574 vistas

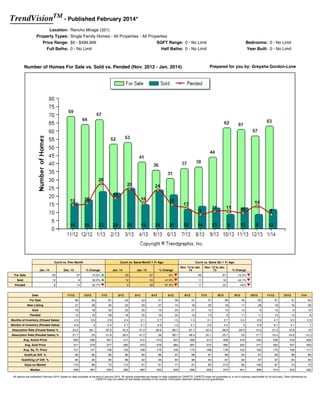
Number of Homes For Sale vs. Sold vs. Pended (Nov. 2012 - Jan. 2014)

Recomendados
Recomendados
Más contenido relacionado
La actualidad más candente
La actualidad más candente (17)
Similar a Trend visionreport rancho mirage
Similar a Trend visionreport rancho mirage (20)
Más de SDM: Music Venture
Más de SDM: Music Venture (19)
Último
Último (20)
Trend visionreport rancho mirage
- 1. TrendVisionTM - Published February 2014* Location: Property Types: Price Range: Full Baths: Rancho Mirage (321) Single Family Homes - All Properties - All Properties $0 - $499,999 SQFT Range: 0 - No Limit 0 - No Limit Half Baths: 0 - No Limit Prepared for you by: Greysha Gordon-Love Number of Homes For Sale vs. Sold vs. Pended (Nov. 2012 - Jan. 2014) Curnt vs. Prev Month Jan. 14 Dec. 13 Curnt vs. Same Month 1 Yr Ago % Change Jan. 14 Jan. 13 Bedrooms: 0 - No Limit Year Built: 0 - No Limit Curnt vs. Same Qtr 1 Yr Ago Nov. 13 to Jan. 14 % Change Nov. 12 to Jan. 13 % Change For Sale 63 57 10.5% 63 67 -6% 60 67 -10.4% Sold 12 9 33.3% 12 23 -47.8% 11 19 -42.1% Pended 9 14 -35.7% 9 28 -67.9% 11 20 -45% Date 11/12 12/12 1/13 2/13 3/13 4/13 5/13 6/13 7/13 8/13 9/13 10/13 11/13 12/13 1/14 For Sale 69 64 67 52 53 41 36 31 37 38 44 62 61 57 63 New Listing 27 26 35 23 20 27 15 18 22 18 17 28 18 10 26 Sold 16 18 23 22 25 15 24 21 12 14 13 9 13 9 12 Pended 15 16 28 19 25 16 24 15 13 9 11 11 10 14 9 Months of Inventory (Closed Sales) 4.3 3.6 2.9 2.4 2.1 2.7 1.5 1.5 3.1 2.7 3.4 6.9 4.7 6.3 5.3 Months of Inventory (Pended Sales) 4.6 4 2.4 2.7 2.1 2.6 1.5 2.1 2.8 4.2 4 5.6 6.1 4.1 7 Absorption Rate (Closed Sales) % 23.2 28.1 34.3 42.3 47.2 36.6 66.7 67.7 32.4 36.8 29.5 14.5 21.3 15.8 19 Absorption Rate (Pended Sales) % 21.7 25 41.8 36.5 47.2 39 66.7 48.4 35.1 23.7 25 17.7 16.4 24.6 14.3 Avg. Active Price 400 399 407 417 412 410 407 406 412 409 418 430 430 418 428 Avg. Sold Price 317 379 377 360 370 379 384 387 375 385 325 377 350 407 430 Avg. Sq. Ft. Price 151 147 158 153 168 173 156 173 168 178 152 162 170 199 171 Sold/List Diff. % 99 96 96 96 96 96 97 98 97 98 94 97 99 98 96 Sold/Orig LP Diff. % 90 90 95 89 92 94 94 96 95 97 92 97 97 95 93 Days on Market 170 96 72 112 81 91 77 81 63 213 85 109 67 74 73 Median 328 387 365 383 380 400 409 399 406 374 401 399 374 420 430 All reports are published February 2014, based on data available at the end of January 2014. All reports presented are based on data supplied by CARETS. CARETS does not guarantee or is not in anyway responsible for its accuracy. Data maintained by CARETS may not reflect all real estate activities in the market. Information deemed reliable but not guaranteed.
- 2. TrendVisionTM - Published February 2014* Location: Property Types: Price Range: Full Baths: Rancho Mirage (321) Single Family Homes - All Properties - All Properties $0 - $499,999 SQFT Range: 0 - No Limit 0 - No Limit Half Baths: 0 - No Limit Prepared for you by: Greysha Gordon-Love Average Price per SQFT (Nov. 2012 - Jan. 2014) Curnt vs. Prev Month Jan. 14 Avg. Sq. Ft. Price Dec. 13 171.2 Date Curnt vs. Same Month 1 Yr Ago % Change 199 11/12 Jan. 14 -14% 12/12 Jan. 13 171.2 1/13 2/13 Bedrooms: 0 - No Limit Year Built: 0 - No Limit % Change 157.9 3/13 Curnt vs. Same Qtr 1 Yr Ago Nov. 13 to Jan. 14 8.4% 4/13 Nov. 12 to Jan. 13 178.2 5/13 6/13 % Change 152.5 7/13 16.8% 8/13 9/13 10/13 11/13 12/13 1/14 For Sale 69 64 67 52 53 41 36 31 37 38 44 62 61 57 63 New Listing 27 26 35 23 20 27 15 18 22 18 17 28 18 10 26 Sold 16 18 23 22 25 15 24 21 12 14 13 9 13 9 12 Pended 15 16 28 19 25 16 24 15 13 9 11 11 10 14 9 Months of Inventory (Closed Sales) 4.3 3.6 2.9 2.4 2.1 2.7 1.5 1.5 3.1 2.7 3.4 6.9 4.7 6.3 5.3 Months of Inventory (Pended Sales) 4.6 4 2.4 2.7 2.1 2.6 1.5 2.1 2.8 4.2 4 5.6 6.1 4.1 7 Absorption Rate (Closed Sales) % 23.2 28.1 34.3 42.3 47.2 36.6 66.7 67.7 32.4 36.8 29.5 14.5 21.3 15.8 19 Absorption Rate (Pended Sales) % 21.7 25 41.8 36.5 47.2 39 66.7 48.4 35.1 23.7 25 17.7 16.4 24.6 14.3 Avg. Active Price 400 399 407 417 412 410 407 406 412 409 418 430 430 418 428 Avg. Sold Price 317 379 377 360 370 379 384 387 375 385 325 377 350 407 430 Avg. Sq. Ft. Price 151 147 158 153 168 173 156 173 168 178 152 162 170 199 171 Sold/List Diff. % 99 96 96 96 96 96 97 98 97 98 94 97 99 98 96 Sold/Orig LP Diff. % 90 90 95 89 92 94 94 96 95 97 92 97 97 95 93 Days on Market 170 96 72 112 81 91 77 81 63 213 85 109 67 74 73 Median 328 387 365 383 380 400 409 399 406 374 401 399 374 420 430 All reports are published February 2014, based on data available at the end of January 2014. All reports presented are based on data supplied by CARETS. CARETS does not guarantee or is not in anyway responsible for its accuracy. Data maintained by CARETS may not reflect all real estate activities in the market. Information deemed reliable but not guaranteed.
- 3. TrendVisionTM - Published February 2014* Location: Property Types: Price Range: Full Baths: Rancho Mirage (321) Single Family Homes - All Properties - All Properties $0 - $499,999 SQFT Range: 0 - No Limit 0 - No Limit Half Baths: 0 - No Limit Prepared for you by: Greysha Gordon-Love Avg Days On Market & SP/Orig LP % (Nov. 2012 - Jan. 2014) Curnt vs. Prev Month Jan. 14 Dec. 13 Curnt vs. Same Month 1 Yr Ago % Change Jan. 14 Jan. 13 Bedrooms: 0 - No Limit Year Built: 0 - No Limit Curnt vs. Same Qtr 1 Yr Ago Nov. 13 to Jan. 14 % Change Nov. 12 to Jan. 13 % Change Days on Market 73 74 -1.4% 73 72 1.4% 71 107 -33.6% Sold/Orig LP Diff. % 93 95 -2.1% 93 95 -2.1% 95 92 3.3% Date 11/12 12/12 1/13 2/13 3/13 4/13 5/13 6/13 7/13 8/13 9/13 10/13 11/13 12/13 1/14 For Sale 69 64 67 52 53 41 36 31 37 38 44 62 61 57 63 New Listing 27 26 35 23 20 27 15 18 22 18 17 28 18 10 26 Sold 16 18 23 22 25 15 24 21 12 14 13 9 13 9 12 Pended 15 16 28 19 25 16 24 15 13 9 11 11 10 14 9 Months of Inventory (Closed Sales) 4.3 3.6 2.9 2.4 2.1 2.7 1.5 1.5 3.1 2.7 3.4 6.9 4.7 6.3 5.3 Months of Inventory (Pended Sales) 4.6 4 2.4 2.7 2.1 2.6 1.5 2.1 2.8 4.2 4 5.6 6.1 4.1 7 Absorption Rate (Closed Sales) % 23.2 28.1 34.3 42.3 47.2 36.6 66.7 67.7 32.4 36.8 29.5 14.5 21.3 15.8 19 Absorption Rate (Pended Sales) % 21.7 25 41.8 36.5 47.2 39 66.7 48.4 35.1 23.7 25 17.7 16.4 24.6 14.3 Avg. Active Price 400 399 407 417 412 410 407 406 412 409 418 430 430 418 428 Avg. Sold Price 317 379 377 360 370 379 384 387 375 385 325 377 350 407 430 Avg. Sq. Ft. Price 151 147 158 153 168 173 156 173 168 178 152 162 170 199 171 Sold/List Diff. % 99 96 96 96 96 96 97 98 97 98 94 97 99 98 96 Sold/Orig LP Diff. % 90 90 95 89 92 94 94 96 95 97 92 97 97 95 93 Days on Market 170 96 72 112 81 91 77 81 63 213 85 109 67 74 73 Median 328 387 365 383 380 400 409 399 406 374 401 399 374 420 430 All reports are published February 2014, based on data available at the end of January 2014. All reports presented are based on data supplied by CARETS. CARETS does not guarantee or is not in anyway responsible for its accuracy. Data maintained by CARETS may not reflect all real estate activities in the market. Information deemed reliable but not guaranteed.
- 4. TrendVisionTM - Published February 2014* Location: Property Types: Price Range: Full Baths: Rancho Mirage (321) Single Family Homes - All Properties - All Properties $0 - $499,999 SQFT Range: 0 - No Limit 0 - No Limit Half Baths: 0 - No Limit Prepared for you by: Greysha Gordon-Love Average Price of For Sale and Sold (Nov. 2012 - Jan. 2014) Curnt vs. Prev Month Jan. 14 Dec. 13 Curnt vs. Same Month 1 Yr Ago % Change Jan. 14 Bedrooms: 0 - No Limit Year Built: 0 - No Limit Jan. 13 Curnt vs. Same Qtr 1 Yr Ago Nov. 13 to Jan. 14 % Change Nov. 12 to Jan. 13 % Change Avg. Active Price 428 418 2.4% 428 407 5.2% 426 402 6% Avg. Sold Price 430 407 5.7% 430 377 14.1% 393 361 8.9% Date 11/12 12/12 1/13 2/13 3/13 4/13 5/13 6/13 7/13 8/13 9/13 10/13 11/13 12/13 1/14 For Sale 69 64 67 52 53 41 36 31 37 38 44 62 61 57 63 New Listing 27 26 35 23 20 27 15 18 22 18 17 28 18 10 26 Sold 16 18 23 22 25 15 24 21 12 14 13 9 13 9 12 Pended 15 16 28 19 25 16 24 15 13 9 11 11 10 14 9 Months of Inventory (Closed Sales) 4.3 3.6 2.9 2.4 2.1 2.7 1.5 1.5 3.1 2.7 3.4 6.9 4.7 6.3 5.3 Months of Inventory (Pended Sales) 4.6 4 2.4 2.7 2.1 2.6 1.5 2.1 2.8 4.2 4 5.6 6.1 4.1 7 Absorption Rate (Closed Sales) % 23.2 28.1 34.3 42.3 47.2 36.6 66.7 67.7 32.4 36.8 29.5 14.5 21.3 15.8 19 Absorption Rate (Pended Sales) % 21.7 25 41.8 36.5 47.2 39 66.7 48.4 35.1 23.7 25 17.7 16.4 24.6 14.3 Avg. Active Price 400 399 407 417 412 410 407 406 412 409 418 430 430 418 428 Avg. Sold Price 317 379 377 360 370 379 384 387 375 385 325 377 350 407 430 Avg. Sq. Ft. Price 151 147 158 153 168 173 156 173 168 178 152 162 170 199 171 Sold/List Diff. % 99 96 96 96 96 96 97 98 97 98 94 97 99 98 96 Sold/Orig LP Diff. % 90 90 95 89 92 94 94 96 95 97 92 97 97 95 93 Days on Market 170 96 72 112 81 91 77 81 63 213 85 109 67 74 73 Median 328 387 365 383 380 400 409 399 406 374 401 399 374 420 430 All reports are published February 2014, based on data available at the end of January 2014. All reports presented are based on data supplied by CARETS. CARETS does not guarantee or is not in anyway responsible for its accuracy. Data maintained by CARETS may not reflect all real estate activities in the market. Information deemed reliable but not guaranteed.
- 5. TrendVisionTM - Published February 2014* Location: Property Types: Price Range: Full Baths: Rancho Mirage (321) Single Family Homes - All Properties - All Properties $0 - $499,999 SQFT Range: 0 - No Limit 0 - No Limit Half Baths: 0 - No Limit Prepared for you by: Greysha Gordon-Love Absorption Rate based on Closed Sales (%) (Nov. 2012 - Jan. 2014) Curnt vs. Prev Month Jan. 14 Absorption Rate (Closed Sales) % Dec. 13 19 Date Curnt vs. Same Month 1 Yr Ago % Change 15.8 11/12 Jan. 14 Jan. 13 20.6% 12/12 19 1/13 2/13 3/13 Curnt vs. Same Qtr 1 Yr Ago Nov. 13 to Jan. 14 % Change 34.3 -44.5% 4/13 Bedrooms: 0 - No Limit Year Built: 0 - No Limit Nov. 12 to Jan. 13 18.3 5/13 6/13 % Change 28.4 7/13 -35.4% 8/13 9/13 10/13 11/13 12/13 1/14 For Sale 69 64 67 52 53 41 36 31 37 38 44 62 61 57 63 New Listing 27 26 35 23 20 27 15 18 22 18 17 28 18 10 26 Sold 16 18 23 22 25 15 24 21 12 14 13 9 13 9 12 Pended 15 16 28 19 25 16 24 15 13 9 11 11 10 14 9 Months of Inventory (Closed Sales) 4.3 3.6 2.9 2.4 2.1 2.7 1.5 1.5 3.1 2.7 3.4 6.9 4.7 6.3 5.3 Months of Inventory (Pended Sales) 4.6 4 2.4 2.7 2.1 2.6 1.5 2.1 2.8 4.2 4 5.6 6.1 4.1 7 Absorption Rate (Closed Sales) % 23.2 28.1 34.3 42.3 47.2 36.6 66.7 67.7 32.4 36.8 29.5 14.5 21.3 15.8 19 Absorption Rate (Pended Sales) % 21.7 25 41.8 36.5 47.2 39 66.7 48.4 35.1 23.7 25 17.7 16.4 24.6 14.3 Avg. Active Price 400 399 407 417 412 410 407 406 412 409 418 430 430 418 428 Avg. Sold Price 317 379 377 360 370 379 384 387 375 385 325 377 350 407 430 Avg. Sq. Ft. Price 151 147 158 153 168 173 156 173 168 178 152 162 170 199 171 Sold/List Diff. % 99 96 96 96 96 96 97 98 97 98 94 97 99 98 96 Sold/Orig LP Diff. % 90 90 95 89 92 94 94 96 95 97 92 97 97 95 93 Days on Market 170 96 72 112 81 91 77 81 63 213 85 109 67 74 73 Median 328 387 365 383 380 400 409 399 406 374 401 399 374 420 430 All reports are published February 2014, based on data available at the end of January 2014. All reports presented are based on data supplied by CARETS. CARETS does not guarantee or is not in anyway responsible for its accuracy. Data maintained by CARETS may not reflect all real estate activities in the market. Information deemed reliable but not guaranteed.