
Recomendados
Recomendados
Más contenido relacionado
Similar a Race, Redlining and our Neighborhoods: Brooklyn, Chicago & D.C.
Similar a Race, Redlining and our Neighborhoods: Brooklyn, Chicago & D.C. (20)
Último
Último (20)
Race, Redlining and our Neighborhoods: Brooklyn, Chicago & D.C.
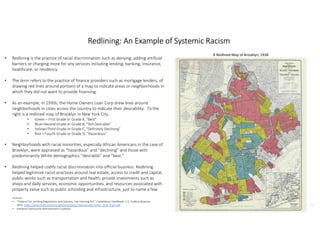
- 1. 1 1 Redlining: An Example of Systemic Racism • Redlining is the practice of racial discrimination such as denying, adding artificial barriers or charging more for any services including lending, banking, insurance, healthcare, or residency. • The term refers to the practice of finance providers such as mortgage lenders, of drawing red lines around portions of a map to indicate areas or neighborhoods in which they did not want to provide financing. • As an example, in 1930s, the Home Owners Loan Corp drew lines around neighborhoods in cities across the country to indicate their desirability. To the right is a redlined map of Brooklyn in New York City. • Green = First Grade or Grade A, “Best” • Blue=Second Grade or Grade B, “Still Desirable” • Yellow=Third Grade or Grade C, “Definitely Declining” • Red = Fourth Grade or Grade D, “Hazardous” • Neighborhoods with racial minorities, especially African Americans in the case of Brooklyn, were appraised as “hazardous” and “declining” and those with predominantly White demographics “desirable” and “best.” • Redlining helped codify racial discrimination into official business. Redlining helped legitimize racist practices around real estate, access to credit and capital, public-works such as transportation and health, private investments such as shops and daily services, economic opportunities, and resources associated with property value such as public schooling and infrastructure, just to name a few. A Redlined Map of Brooklyn, 1938 Sources: • "Federal Fair Lending Regulations and Statutes, Fair Housing Act." Compliance Handbook. U.S. Federal Reserve, Web. https://www.federalreserve.gov/boarddocs/supmanual/cch/fair_lend_fhact.pdf • National Community Reinvestment Coalition
- 2. 2 • Redlining helped design our residential systems to keep communities of color under-resourced and under-served. As resources concentrated in predominantly White neighborhoods, underinvestment and neglect led to concentrated poverty in minority neighborhoods. • Redlining was a predatory tool to perpetuate racial inequality. Between 1930s and 1970s, when homeownership rose in America as an avenue for economic mobility, minority homeownership faced crippling barriers and inequality widened at an accelerated pace along racial lines. • Redlined maps became self-fulfilling prophesies for growing inequality, as racial minorities were confined to Redlined neighborhoods, and neighborhoods with racial minorities were marked “hazardous” and “undesirable,” thus starved of investment. • It wasn’t until 1968, merely 52 years ago, that Redlining practices were declared unlawful by the Fair Housing Act (FHAct), as part of the Civil Rights Act of 1968.1 Even so, discriminatory practices and biased narratives continued. • The hard work of rooting out segregation is ongoing. Today many American cities continue to have racially segregated communities, shaped by a history of predatory practices such as Redlining. Why it’s important to know about Redlining 1Fair Housing Act (FHAct) made it unlawful for any lender to discriminate in its housing-related lending activities against any person because of race, color, religion, national origin, sex, handicap, or familial status. Anyone who is in the business of providing housing-related loans is subject to the FHAct (as well as the Equal Credit Opportunity Act). Redlining is an example of systemic racism, which played a part in sustained segregation and growing inequality. Redlining was legal until 1968; systemic racism is not a distant past but rather a current reality. Sources: • Photos: top left harvardcrcl.org; top right seattle.gov; bottom left WBEZ Chicago; bottom right The Chicago Sun • “The Effects of the 1930s HOLC “Redlining Maps” by D. Aaronson, D. Hartley, B. Mazumder https://www.nytimes.com/2017/08/24/upshot/how-redlinings-racist-effects-lasted-for-decades.html
- 3. 3 3 Lasting Effects of Systemic Racism: Example of Chicago Cermak Road 1 3 2 $19,932 Englewood median household income.2 $28,091 N & S Lawndales median household income. $92,714 Lincoln Park median household income Northside South Side West Side - “South of Cermak,” with predominantly African American neighborhoods including Bronzeville, Woodlawn, Englewood, Hyde Park - Restrictive policies dating back to the Great Migration1 barred African Americans from moving outside the historic Black Belt (today’s Bronzeville) until 1940s - Redlining denied African Americans housing loans for other neighborhoods, forcing them into specific geographies that were neglected by the city and starved of investment. Black Americans in Chicago, like in many other cities, also faced several other predatory housing practices such as Contract Buying2 and BlockBusting which robbed Black Americans from wealth building. 1 2 3 - Predominantly minority neighborhoods, several of which are Hispanic/Latinx, others African Americans - Waves of Mexican immigration during WWII in manufacturing, settled in West Side in industrial zone - Neighborhoods include N Lawndale, S Lawndale and Humboldt Park - Much of Chicago’s economy, transportation and wealth is concentrated in the northern section. - This part of Chicago tends to be White (non-hispanic) and higher income. - White individuals did not face racial discrimination in obtaining financing, to settle in the Northern neighborhoods and invest in their communities. Sources: "Racial Wealth Divide in Chicago," Racial Wealth Divide Initiative. Prosperity Now, January 2017. Web. https://prosperitynow.org/files/PDFs/profiles/Racial_Wealth_Divide_in_Chicago_RWDI.pdf; American Community Survey; Census Bureau 1The Great migration in the US refers to the relocation of over 6 Million African Americas from rural South to the cities of the North, Midwest and West, ranging roughly from 1916 to 1970s. Decades later, we see the ramifications of racist practices such as Redlining in sustained segregation and income disparities. Chicago
- 4. 4 Lasting Effects of Systemic Racism: Example of Washington D.C. Decades later, we see the ramifications of racist practices such as Redlining in sustained segregation and income disparities. Washington DC WardsRace and geography White Black/African American Hispanic Potomac River Anacostia River $70,848k median $0k $250k East of the River: Wards 7, 8 Median household income in Washington Highlands: $29,0002 Median household income in Spring Valley: >200,000.2 Median Household Income, 2015 ACS estimates • In D.C., Wards 7 and 8, home to predominantly Black/African American communities, were starved of investment for decades1 • Banks in D.C., like in many other American cities, often lent to low-income White applicants, while denying higher income African Americans Sources: The Urban Institute, 2015; ESRI Living Atlas map and analysis using U.S. Census Bureau data; D.C. Fiscal Policy Institute, 2016; Wards 7 and 8 comprise 41 total neighborhoods.