Energy & Commodities - 2010 - October
•
1 recomendación•247 vistas

Swedbank was founded in 1820, as Sweden’s first savings bank was established. Today, our heritage is visible in that we truly are a bank for each and every one and in that we still strive to contribute to a sustainable development of society and our environment. We are strongly committed to society as a whole and keen to help bring about a sustainable form of societal development. Our Swedish operations hold an ISO 14001 environmental certification, and environmental work is an integral part of our business activities.

Recomendados
Recomendados
Más contenido relacionado
La actualidad más candente
La actualidad más candente (20)
Destacado
Destacado (9)
Similar a Energy & Commodities - 2010 - October
Similar a Energy & Commodities - 2010 - October (20)
Más de Swedbank
Más de Swedbank (20)
Último
Último (20)
Energy & Commodities - 2010 - October
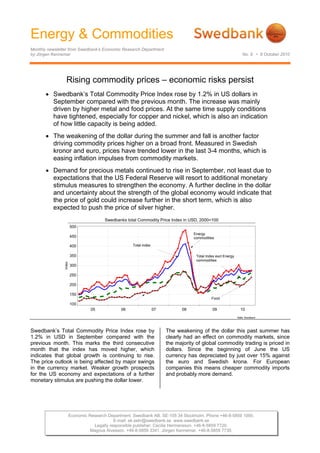
- 1. Energy & Commodities Monthly newsletter from Swedbank’s Economic Research Department by Jörgen Kennemar No. 9 • 8 October 2010 Economic Research Department. Swedbank AB. SE-105 34 Stockholm. Phone +46-8-5859 1000. E-mail: ek.sekr@swedbank.se www.swedbank.se Legally responsible publisher: Cecilia Hermansson. +46-8-5859 7720. Magnus Alvesson. +46-8-5859 3341. Jörgen Kennemar. +46-8-5859 7730. Rising commodity prices – economic risks persist • Swedbank’s Total Commodity Price Index rose by 1.2% in US dollars in September compared with the previous month. The increase was mainly driven by higher metal and food prices. At the same time supply conditions have tightened, especially for copper and nickel, which is also an indication of how little capacity is being added. • The weakening of the dollar during the summer and fall is another factor driving commodity prices higher on a broad front. Measured in Swedish kronor and euro, prices have trended lower in the last 3-4 months, which is easing inflation impulses from commodity markets. • Demand for precious metals continued to rise in September, not least due to expectations that the US Federal Reserve will resort to additional monetary stimulus measures to strengthen the economy. A further decline in the dollar and uncertainty about the strength of the global economy would indicate that the price of gold could increase further in the short term, which is also expected to push the price of silver higher. Swedbanks total Commodity Price Index in USD, 2000=100 Källa: Swedbank 05 06 07 08 09 10 Index 100 150 200 250 300 350 400 450 500 Total Index excl Energy commodities Total index Energy commodities Food Swedbank’s Total Commodity Price Index rose by 1.2% in USD in September compared with the previous month. This marks the third consecutive month that the index has moved higher, which indicates that global growth is continuing to rise. The price outlook is being affected by major swings in the currency market. Weaker growth prospects for the US economy and expectations of a further monetary stimulus are pushing the dollar lower. The weakening of the dollar this past summer has clearly had an effect on commodity markets, since the majority of global commodity trading is priced in dollars. Since the beginning of June the US currency has depreciated by just over 15% against the euro and Swedish krona. For European companies this means cheaper commodity imports and probably more demand.
- 2. Energy & Commodities Monthly newsletter from Swedbank’s Economic Research Department, continued No. 9 • 8 October 2010 2 (4) Swedbanks total Commodity Price Index in USD and SEK, December 2009=100 90 95 100 105 110 115 120 2009m12 2010m1 2010m2 2010m3 2010m4 2010m5 2010m6 2010m7 2010m8 2010m9 SEK USD In September Swedbank’s Total Commodity Price Index fell by 2.2% in SEK compared with August. Looked at over the last three months, the index has fallen by 5.6%, against an increase of 5% in USD. Tighter supply conditions for metals Higher food and metal prices contributed to the increase in the Total Commodity Price Index in USD in September. Stock levels for non-ferrous metals, million tons Source: LME, Reuters EcoWin 00 01 02 03 04 05 06 07 08 09 10 Ton(metric) -25000 0 25000 50000 75000 100000 125000 150000 175000 200000 225000 Ton(metric)(millions) 0.0 0.1 0.2 0.3 0.4 0.5 0.6 0.7 0.8 0.9 1.0 Copper Zink Lead Nickel, right scal Among metal prices, nickel, copper and lead noted the biggest increases, an indication that global industry is continuing to expand at a decent rate. Besides the fact that metal consumption has grown, supply has tightened for several metals, notably copper, where inventories have dropped to their lowest levels since last winter. This trend is expected to continue for the next year, according to the latest forecast from the Copper Study Group. Too little capacity expansion and lower copper concentrates would seem to point to further price hikes, as long as the economic slowdown anticipated in 2011 isn’t weaker than projected. At the time of writing the price of copper had reached USD 8 000 per ton, the highest level in two years. Tin is another case where inventories have fallen at the same time that prices have soared. Nickel has posted the biggest price gain among industrial metals in Swedbank’s Commodity Price Index since the start of the year, climbing over 30% in USD. Growing demand for metals is also evident in recent projections from the World Steel Association (WST), which sees steel consumption rising by 13% in volume in 2010, following last year's decline of 7%. A significant share of higher steel consumption was back in the first half of the year, however, when the global industrial climate improved and companies began building up inventory. Mature industrial countries account for the biggest increase in steel consumption – 23% after the severe downturn in 2009. For emerging economies, led by China, growth is expected to slow for 2010 as a whole, although they still represent slightly over 70% of global consumption. As a whole, steel consumption will remain at a higher level in 2010 before the global economy eventually slows. Next year steel consumption is expected to grow at a significantly slower pace as economic policies are tightened and the inventory built up by industry starts to shrink. Low capacity utilisation and uncertainty about the strength of the economy are limiting or delaying investment by OECD countries. The industrialisation of emerging economies and growth in urban populations will mean higher demand for steel and other metals for the foreseeable future. Forecasts for 2011 point to a further slowdown in consumption, however, partly due to austerity measures, particularly in China, to avoid a future overheating in the housing market, among other areas. Despite that demand is expected to grow at a slower pace next year, the steel market faces supply restrictions. Tighter requirements on energy efficiency have forced a number of small Chinese steel manufacturers to shut down in 2010 when they could not meet the demands authorities have made. Stable energy prices Energy prices have been the most stable element in Swedbank’s Commodity Price Index in recent months. The index for energy products, which includes coal and crude oil, rose by a marginal 0.3% in September from the previous month. Crude prices, which weigh heavily in the index, have fluctuated in range of 75-80 dollars a barrel in 2010. The decline in the dollar in recent weeks means, however, that the price of oil in USD tends to rise at the same time, which could lead to higher demand in countries where oil consumption is increasing rapidly. We do not expect OPEC countries to change their production quotas at the summit in October, partly because of the economic uncertainty.
- 3. Energy & Commodities Monthly newsletter from Swedbank’s Economic Research Department, continued No. 9 • 8 October 2010 3 (4) Poor harvests are driving up food prices The price index for foods continues to rise rapidly, climbing 15% since June in USD. Food prices in USD, December 2008=100 Source: Reuters EcoWin jan mar maj jul sep nov jan mar maj jul sep nov jan mar maj jul 08 09 10 Index 90 100 110 120 130 140 150 160 170 180 Sugar, beverages Food prices, total 2008-12-31=100 Cereals Within a short span, lower grain supplies have driven up grain prices to the highest levels since the fall of 2008, even though supply restrictions are less extensive than compared with the food crisis two years ago. Unfavourable weather conditions have affected the supply of other foods such as rice, which is likely to further rise in price in the next half year. Countries where food consumption is high will be hardest hit by the global food price increase. Over time this tends to drive up inflation. For agricultural products, including pulp and cotton, prices rose by 2.5% in September, which means that the price level is about 26% higher than at the same time last year. There are major variations between products, however. Tight supply conditions for cotton and pulp have led to the largest price increases in the last year. Gold prices reach new record levels Demand for precious metals continued to accelerate during the fall, driving up the price of gold to over 1 300 dollars a troy ounce. The gold price and the USD Source: Reuters EcoWin 00 01 02 03 04 05 06 07 08 09 10 0.0070 0.0075 0.0080 0.0085 0.0090 0.0095 0.0100 0.0105 0.0110 0.0115 0.0120 0.0125 0.0130 USD/Ounce(troy) 200 300 400 500 600 700 800 900 1000 1100 1200 1300 1400 Gold price, left scale USD, real effective exchange rate, right scale The rise in the price of gold has also contributed to higher demand for silver in financial markets, at the same time that industrial consumption of silver is on the rise. So far this year silver prices have risen by around 25%, compared with 18% for gold. Growing capital inflows from investors are an important reason for the strong demand for gold. Data from the World Gold Council show that the capital inflows from financial players rose by slightly over 400% during the second quarter of 2010 compared with a year earlier. As a result, demand is increasing considerably faster than supply. Low interest rates and expectations of additional monetary stimulus measures, especially in the US, have strengthened investors’ interest in gold in recent weeks at the same time that the dollar has been under pressure. We expect that the low interest rates and uncertain economic outlook, with the inherent risk of deflation, could push gold prices beyond today's already high levels. At the same time there are concerns in the financial market that expansive economic policies will eventually lead to higher inflation, which is also driving up the price of gold. Jörgen Kennemar
- 4. Energy & Commodities Monthly newsletter from Swedbank’s Economic Research Department, continued No. 9 • 8 October 2010 4 (4) Swedbank Commodity Index - US$ - Basis 2000 = 1oo 04-10-10 7.2010 8.2010 9.2010 Total index 264,8 270,0 273,1 Per cent change month ago 1,9 1,9 1,2 Per cent change year ago 22,3 13,6 19,3 Total index exclusive energy 256,3 265,6 273,8 Per cent change month ago 7,1 3,6 3,1 Per cent change year ago 38,6 32,5 36,7 Food, tropical beverages 225,8 234,1 245,9 Per cent change month ago 6,3 3,7 5,0 Per cent change year ago 11,5 10,9 19,6 Cereals 193,4 215,5 240,1 Per cent change month ago 11,0 11,4 11,4 Per cent change year ago 3,1 19,3 39,4 Tropical beverages and tobacco 249,0 253,6 264,4 Per cent change month ago 5,9 1,8 4,3 Per cent change year ago 21,0 14,5 16,7 Coffee 153,4 157,5 163,6 Per cent change month ago 7,9 2,7 3,9 Per cent change year ago 35,9 34,0 40,5 Oilseeds and oil 196,8 204,2 209,7 Per cent change month ago 4,6 3,8 2,7 Per cent change year ago -4,0 -2,1 15,3 Industrial raw materials 265,1 274,7 281,8 Per cent change month ago 7,3 3,6 2,6 Per cent change year ago 47,5 39,1 41,8 Agricultural raw materials 166,8 170,7 175,0 Per cent change month ago 2,1 2,3 2,5 Per cent change year ago 36,1 29,8 26,4 Cotton 79,0 86,6 96,8 Per cent change month ago -2,9 9,6 11,8 Per cent change year ago 33,4 47,8 60,8 Softwood 149,1 150,0 149,2 Per cent change month ago 3,5 0,6 -0,5 Per cent change year ago 27,7 21,7 15,0 Woodpulp 978,6 976,6 972,2 Per cent change month ago 0,9 -0,2 -0,5 Per cent change year ago 53,4 46,3 37,6 Non-ferrous metals 214,8 232,5 243,9 Per cent change month ago 3,4 8,2 4,9 Per cent change year ago 23,6 14,1 22,1 Copper 6734,6 7283,2 7708,9 Per cent change month ago 3,6 8,1 5,8 Per cent change year ago 29,1 17,8 24,4 Aluminium 1987,8 2112,1 2162,0 Per cent change month ago 2,9 6,3 2,4 Per cent change year ago 19,2 9,4 17,9 Lead 1836,4 2071,8 2183,6 Per cent change month ago 7,8 12,8 5,4 Per cent change year ago 9,4 8,5 -0,9 Zinc 1843,4 2042,6 2151,0 Per cent change month ago 5,8 10,8 5,3 Per cent change year ago 16,8 12,2 14,2 Nickel 19512,8 21370,0 22640,6 Per cent change month ago 0,7 9,5 5,9 Per cent change year ago 22,1 8,8 29,6 Iron ore, steel scrap 658,0 659,3 661,9 Per cent change month ago 15,1 0,2 0,4 Per cent change year ago 92,1 89,3 89,2 Energy raw materials 268,6 271,9 272,8 Per cent change month ago -0,2 1,2 0,3 Per cent change year ago 16,4 7,0 12,9 Coking coal 362,5 341,9 354,8 Per cent change month ago -2,6 -5,7 3,8 Per cent change year ago 31,3 26,0 39,4 Crude oil 264,3 268,7 269,1 Per cent change month ago 0,0 1,7 0,1 Per cent change year ago 15,6 6,0 11,6 Source : SWEDBANK and HWWA-Institute for Economic Research Hamburg Swedbank Commodity Index - SKr - Basis 2000 = 1oo 04-10-10 7.2010 8.2010 9.2010 Total index 213,3 213,9 209,3 Per cent change month ago -3,7 0,3 -2,2 Per cent change year ago 18,0 15,8 20,3 Total index exclusive energy 206,4 210,4 209,8 Per cent change month ago 1,2 2,0 -0,3 Per cent change year ago 33,8 35,1 37,9 Food, tropical beverages 181,8 185,5 188,4 Per cent change month ago 0,5 2,0 1,6 Per cent change year ago 7,6 13,1 20,7 Cereals 155,8 170,8 184,0 Per cent change month ago 4,9 9,6 7,7 Per cent change year ago -0,5 21,7 40,6 Tropical beverages and tobacco 200,6 201,0 202,6 Per cent change month ago 0,1 0,2 0,8 Per cent change year ago 16,7 16,7 17,7 Coffee 123,6 124,8 125,4 Per cent change month ago 2,0 1,0 0,5 Per cent change year ago 31,1 36,7 41,8 Oilseeds and oil 158,5 161,8 160,7 Per cent change month ago -1,2 2,1 -0,7 Per cent change year ago -7,4 -0,1 16,3 Industrial raw materials 213,5 217,6 216,0 Per cent change month ago 1,4 1,9 -0,8 Per cent change year ago 42,3 41,8 43,1 Agricultural raw materials 134,3 135,3 134,1 Per cent change month ago -3,5 0,7 -0,9 Per cent change year ago 31,3 32,4 27,5 Cotton 63,6 68,6 74,2 Per cent change month ago -8,3 7,8 8,1 Per cent change year ago 28,8 50,7 62,2 Softwood 120,1 118,9 114,3 Per cent change month ago -2,2 -1,0 -3,8 Per cent change year ago 23,2 24,0 16,0 Woodpulp 788,2 773,8 745,0 Per cent change month ago -4,6 -1,8 -3,7 Per cent change year ago 48,0 49,2 38,8 Non-ferrous metals 173,0 184,2 186,9 Per cent change month ago -2,3 6,5 1,4 Per cent change year ago 19,2 16,4 23,1 Copper 5424,3 5771,1 5907,4 Per cent change month ago -2,1 6,4 2,4 Per cent change year ago 24,6 20,2 25,5 Aluminium 1601,0 1673,6 1656,8 Per cent change month ago -2,7 4,5 -1,0 Per cent change year ago 15,0 11,5 18,9 Lead 1479,1 1641,7 1673,3 Per cent change month ago 1,9 11,0 1,9 Per cent change year ago 5,6 10,6 -0,1 Zinc 1484,7 1618,5 1648,3 Per cent change month ago 0,0 9,0 1,8 Per cent change year ago 12,7 14,4 15,2 Nickel 15716,3 16933,4 17349,6 Per cent change month ago -4,9 7,7 2,5 Per cent change year ago 17,8 11,0 30,7 Iron ore, steel scrap 530,0 522,4 507,2 Per cent change month ago 8,8 -1,4 -2,9 Per cent change year ago 85,4 93,0 90,8 Energy raw materials 216,3 215,5 209,1 Per cent change month ago -5,6 -0,4 -3,0 Per cent change year ago 12,3 9,1 13,9 Coking coal 292,0 270,9 271,9 Per cent change month ago -7,9 -7,2 0,4 Per cent change year ago 26,7 28,4 40,6 Crude oil 212,9 212,9 206,2 Per cent change month ago -5,5 0,0 -3,1 Per cent change year ago 11,6 8,1 12,6 Source : SWEDBANK and HWWA-Institute for Economic Research Hamburg Swedbank Economic Research Department SE-105 34 Stockholm, Sweden Phone +46-8-5859 7740 ek.sekr@swedbank.se www.swedbank.se Legally responsible publisher Cecilia Hermansson, +46-88-5859 7720 Magnus Alvesson, +46-8-5859 3341 Jörgen Kennemar, +46-8-5859 7730 Swedbank’s monthly Energy & Commodities newsletter is published as a service to our customers. We believe that we have used reliable sources and methods in the preparation of the analyses reported in this publication. However, we cannot guarantee the accuracy or completeness of the report and cannot be held responsible for any error or omission in the underlying material or its use. Readers are encouraged to base any (investment) decisions on other material as well. Neither Swedbank nor its employees may be held responsible for losses or damages, direct or indirect, owing to any errors or omissions in Swedbank’s monthly Energy & Commodities newsletter.