Energy & Commodities, No.4, 15 April 2011
•
1 recomendación•382 vistas

- Swedbank's Total Commodity Price Index rose in March to its highest level since August 2008, driven by a substantial increase in oil prices. Excluding energy, the price index fell for the first time in over half a year. - Investments in precious metals like gold and silver have seen renewed interest due to high oil prices and inflation concerns. Gold prices have risen to new record levels. - Metal prices slowed in March, with nickel, zinc and copper declining the most, though prices remain high. Slower Chinese commodity imports and Japanese production cuts contributed to the decline.

Recomendados
Recomendados
Más contenido relacionado
La actualidad más candente
La actualidad más candente (20)
Destacado
Destacado (9)
Similar a Energy & Commodities, No.4, 15 April 2011
Similar a Energy & Commodities, No.4, 15 April 2011 (20)
Más de Swedbank
Más de Swedbank (20)
Último
Último (20)
Energy & Commodities, No.4, 15 April 2011
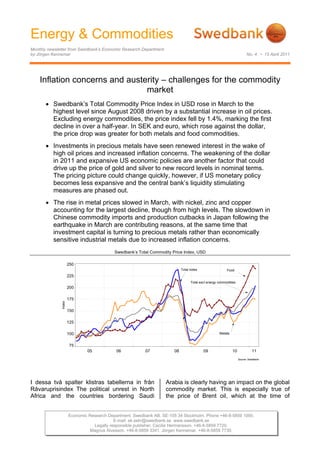
- 1. Energy & Commodities Monthly newsletter from Swedbank’s Economic Research Department by Jörgen Kennemar No. 4 • 15 April 2011 Inflation concerns and austerity – challenges for the commodity market • Swedbank’s Total Commodity Price Index in USD rose in March to the highest level since August 2008 driven by a substantial increase in oil prices. Excluding energy commodities, the price index fell by 1.4%, marking the first decline in over a half-year. In SEK and euro, which rose against the dollar, the price drop was greater for both metals and food commodities. • Investments in precious metals have seen renewed interest in the wake of high oil prices and increased inflation concerns. The weakening of the dollar in 2011 and expansive US economic policies are another factor that could drive up the price of gold and silver to new record levels in nominal terms. The pricing picture could change quickly, however, if US monetary policy becomes less expansive and the central bank’s liquidity stimulating measures are phased out. • The rise in metal prices slowed in March, with nickel, zinc and copper accounting for the largest decline, though from high levels. The slowdown in Chinese commodity imports and production cutbacks in Japan following the earthquake in March are contributing reasons, at the same time that investment capital is turning to precious metals rather than economically sensitive industrial metals due to increased inflation concerns. Swedbank’s Total Commodity Price Index, USD 250 Total index Food 225 Total excl energy commodities 200 175 Index 150 125 100 Metals 75 05 06 07 08 09 10 11 Source: Swedbank I dessa två spalter klistras tabellerna in från Arabia is clearly having an impact on the global Råvaruprisindex The political unrest in North commodity market. This is especially true of Africa and the countries bordering Saudi the price of Brent oil, which at the time of Economic Research Department. Swedbank AB. SE-105 34 Stockholm. Phone +46-8-5859 1000. E-mail: ek.sekr@swedbank.se www.swedbank.se Legally responsible publisher: Cecilia Hermansson. +46-8-5859 7720. Magnus Alvesson. +46-8-5859 3341. Jörgen Kennemar. +46-8-5859 7730.
- 2. Energy & Commodities Monthly newsletter from Swedbank’s Economic Research Department, continued No. 4 • 14 April 2011 writing was fluctuating around USD 120-125 crisis remains unresolved in several EMU per barrel. On average, the price of oil in USD countries. A move by the EMU countries to rose by 11.3% in March, which was one speed up monetary austerity at the same time reason why energy accounted for the large that the US central bank, the Federal Reserve part of the increase in Swedbank’s Total (Fed), puts off any rate hikes is contributing to Commodity Price Index. In total, the index rose the weaker dollar. The risk of a further decline by 7.2% in March compared with the previous in the dollar increases if expansive fiscal policy month, reaching its highest level since August in the US continues at the same time that the 2008. The increase was 5.4% in euro and Fed waits to raise interest rates, while rates 5.7% in SEK. Concerns about future oil are expected to rise in Europe. This would supplies have led to skyrocketing oil prices at push commodity prices – including oil – higher. the same time that global demand is expected to rise by 1.5 million barrels a day in 2011 after The other important energy commodity, coal, last year's increase of 2.5 million barrels. In which rose substantially in price last year in Japan, the world's second largest oil importer, connection with the major floods in Australia, fossil fuel consumption will rise as long as the has trended slightly lower in recent months. nuclear power problem persists, which could Against the backdrop of high oil prices and the take several years. As a whole, this means that risk of supply disruptions, it is likely that coal supply conditions in the oil market are prices will rise in the months ahead as demand tightening, because of which oil inventories in for coal grows as a replacement for crude oil. OECD countries will fall from today's relatively Coal is the most commonly used energy high levels. resource in energy-intensive emerging economies led by China and India. There is Swedbank’s Commodity Price Index in various currencies also a clear connection between the prices of 160 oil and coal, where higher oil prices drives up the price of coal. But since coal prices are 150 EUR negotiated between coal and steel producers 140 rather than set by daily listings on financial 130 markets, the substantial recent rise in oil prices 120 is not yet reflected in coal prices. SEK 110 USD 100 90 Metal price increase slows 12 10 11 12 1 2 3 4 5 6 7 8 9 1 2 3 The major increase in oil prices in March m m m m m m m m m m m m m m m m 10 10 10 10 10 10 10 10 10 11 11 11 09 10 10 10 20 20 20 20 20 20 20 20 20 20 20 20 20 20 20 20 contrasts with other commodities in Swedbank’s Total Commodity Price Index. Excluding energy, the index rose in USD by As long as geopolitical uncertainty continues in 1.4% in March compared with February. This is the Middle East, the prospects of a major the first time since June 2010 that the index decline in oil prices are less likely, because of has fallen and the second month in a row in which the risk that oil prices will average more SEK. The decline was driven by lower metal than USD 105, as we forecast this year in our and food prices, though from high levels. latest economic outlook, is high. This is also Among metals, nickel had the largest price reflected in oil futures, which have risen in the decline, at 5.1% in USD, followed by zinc (- past month from USD 112 dollar per barrel to 4.7%) and copper (-3.4%). Slightly lower metal USD 118 for delivery in December 2011. Like prices have been followed by rising many other commodities, oil is also affected by inventories, which raises the question of how exchange rates and the fact that the dollar has much Chinese metal consumption will weaken trended lower against the euro in 2011 – due to the economic austerity measures despite that the US economy is experiencing a authorities there have taken to avoid an faster growth rate while the sovereign debt overheating. In March copper inventories reached their highest level since July 2010, 2 (6)
- 3. Energy & Commodities Monthly newsletter from Swedbank’s Economic Research Department, continued No. 4 • 14 April 2011 contrary to the market's expectations of a metal prices higher, not least aluminium, where copper shortage, which probably drove up the energy consumption is high, accounting for price to a record-high USD 10 000 per ton in slightly over one third of the total production early February. Iron ore prices were largely cost. Since 2009 the covariation between unchanged in March in Swedbank’s Total metal prices and oil has been clear. During the Commodity Price Index in USD, but fell slightly first months of the year this pattern has in SEK. In the short term iron ore prices are changed, however, as oil prices have risen under pressure from reduced Japanese steel significantly faster than metal prices. production in the wake of the disaster, at the same time that the supply of Indian steel is rising. When reconstruction in Japan begins, however, demand for iron ore will increase, Inflation concerns are driving up the price which should also drive up the prices of iron of gold ore and steel. Investor interest in gold rose again in February and March after a slight decline in January. Metal and oil price trends in USD, Index Geopolitical developments in the Middle East, 200 with the risk of persistently high oil prices and 175 higher future inflation, have driven up the price 150 of gold to new record levels in nominal terms. 125 At the time of writing, the price of gold is USD Index 100 1 456 per ounce, an increase of slightly over 75 10% since the end of January. Gold has also 50 risen in SEK and euro, but is still lower than at 25 05 06 07 08 09 10 11 the start of the year. Non-ferrous metals Crude oil, brent Source: Reuters EcoWin Price development for gold and silver in USD, Index 250 Index, 1 january 2010=100 225 The fact that copper prices again rose in April 200 when major producers predicted a lower 175 supply at the World Copper Conference in Index 150 Santiago is a sign of the volatility affecting the 125 economically sensitive metals market, where 100 developments in China are of major 75 importance. Although Chinese commodity jan feb mar apr maj jun jul aug sep okt nov dec jan feb mar apr 10 11 imports also rose substantially in March Gold Silver Source: Reuters EcoWin compared with the previous month, the annual growth rate is slower, in line with the lower GDP growth we predict for the Chinese Despite the recovery, the price of gold has still economy in the year ahead. We expect that the increase in metal prices in USD, which risen considerably less than silver, which is averaged slightly over 40% in 2010, will be increasingly regarded by investors as an significantly lower this year (5-10%), when last alternative to gold. At the same time silver year's global inventory build-up slows at the consumption in industrial production is growing in everything from electronics to textiles. The same time that economic policies are tightened in emerging economies and the majority of 50% price rise in just two months should serve OECD countries. Metal prices should also as a warning signal for a future silver bubble, come under pressure from a growing however. High oil prices, rising inflation, the investment inflow to precious metals (gold and sovereign debt crisis in southern Europe and silver), especially industrial metals due to continued though modest monetary austerity increased inflation concerns. Rising production suggest that gold and silver prices will remain costs owing to the high price of oil are a high going forward. On the other hand, a US counterbalance, however, which could push 3 (6)
- 4. Energy & Commodities Monthly newsletter from Swedbank’s Economic Research Department, continued No. 4 • 14 April 2011 interest rate hike significantly higher than rising purchasing power. According to a 1.50% in late 2012 and a considerably stronger forecast by the US Department of Agriculture dollar could hold precious metal prices in (USDA), the increase in global agricultural check in the longer term. production in 2011 is not expected to sufficiently compensate for the inventory Gold price trend in various currencies, 1 January 2010=100 drawdown last year. Higher oil prices also tend 145 1 January 2010=100 to drive up food prices owing to rising 140 135 EUR production costs. At the same time the 130 incentive to increase production of non-fossil 125 USD fuels such as ethanol rises in pace with oil 120 115 prices. Growing competition between food 110 production and fuel production tends to drive 105 SEK up food prices, which was also what happened 100 95 in 2008, when oil prices reached record-high jan feb mar apr maj jun 10 jul aug sep okt nov dec jan feb 11 mar apr Source: Reuters EcoWin levels. Grain prices and crude oil in USD 200 High food prices are taking a bite 175 The substantial price increase in food 150 Grains commodities since June of last year was 125 Index broken in March. The subindex fell by 3.1% in 100 USD compared with February, but still remains 75 at a significantly higher level than the same Price for Crude oil, Brent 50 period last year. Among grain products, wheat fell the most in price, by nearly 9%, while corn 25 05 06 07 08 09 10 11 prices were relatively stable in March. Sugar Källa: Reuters EcoWin and beverages also reported falling prices after Jörgen Kennemar a continuous increase since May of last year. We expect food prices to trend higher in the year ahead due to increased global growth and 4 (6)
- 5. Energy & Commodities Monthly newsletter from Swedbank’s Economic Research Department by Jörgen Kennemar No. 4 • 15 April 2011 Swedbank Commodity Index - US$ - Swedbank Commodity Index - SKr - Basis 2000 = 1oo 15-04-11 Basis 2000 = 1oo 15-04-11 1.2011 2.2011 3.2011 1.2011 2.2011 3.2011 Total index 327,1 341,3 365,8 Total index 237,1 238,6 252,1 Per cent change month ago 4,1 4,4 7,2 Per cent change month ago 1,5 0,6 5,7 Per cent change year ago 25,5 35,8 38,3 Per cent change year ago 17,2 20,3 22,4 Total index exclusive energy 308,7 318,9 314,5 Total index exclusive energy 223,8 222,9 216,7 Per cent change month ago 5,5 3,3 -1,4 Per cent change month ago 2,8 -0,4 -2,8 Per cent change year ago 37,5 47,6 40,8 Per cent change year ago 28,4 30,7 24,7 Food, tropical beverages 302,5 317,6 307,9 Food, tropical beverages 219,3 222,0 212,2 Per cent change month ago 5,7 5,0 -3,1 Per cent change month ago 3,1 1,2 -4,4 Per cent change year ago 32,2 45,6 48,0 Per cent change year ago 23,5 29,0 31,0 Cereals 294,7 314,5 313,8 Cereals 213,7 219,8 216,2 Per cent change month ago 5,7 6,7 -0,2 Per cent change month ago 3,0 2,9 -1,6 Per cent change year ago 49,4 67,6 69,1 Per cent change year ago 39,5 48,4 49,7 Tropical beverages and tobacco 317,0 337,8 326,3 Tropical beverages and tobacco 229,8 236,1 224,9 Per cent change month ago 5,1 6,6 -3,4 Per cent change month ago 2,5 2,7 -4,8 Per cent change year ago 24,0 38,8 44,6 Per cent change year ago 15,8 23,0 28,1 Coffee 196,8 215,2 223,6 Coffee 142,7 150,4 154,1 Per cent change month ago 7,1 9,3 3,9 Per cent change month ago 4,4 5,4 2,4 Per cent change year ago 55,1 74,4 78,5 Per cent change year ago 44,9 54,5 58,0 Oilseeds and oil 276,4 276,1 264,1 Oilseeds and oil 200,4 193,0 182,0 Per cent change month ago 7,1 -0,1 -4,3 Per cent change month ago 4,5 -3,7 -5,7 Per cent change year ago 44,4 50,2 42,8 Per cent change year ago 34,9 33,0 26,5 Industrial raw materials 310,5 319,3 316,4 Industrial raw materials 225,1 223,2 218,0 Per cent change month ago 5,4 2,8 -0,9 Per cent change month ago 2,8 -0,9 -2,3 Per cent change year ago 39,0 48,2 39,0 Per cent change year ago 29,9 31,2 23,0 Agricultural raw materials 200,8 207,0 202,9 Agricultural raw materials 145,6 144,7 139,8 Per cent change month ago 3,9 3,1 -2,0 Per cent change month ago 1,4 -0,6 -3,4 Per cent change year ago 26,5 31,3 23,5 Per cent change year ago 18,2 16,3 9,4 Cotton 151,6 185,8 201,0 Cotton 109,9 129,9 138,5 Per cent change month ago 7,7 22,6 8,2 Per cent change month ago 5,0 18,1 6,7 Per cent change year ago 110,8 149,4 147,2 Per cent change year ago 97,0 120,9 118,9 Softwood 144,2 144,6 146,8 Softwood 104,5 101,1 101,2 Per cent change month ago -0,3 0,3 1,5 Per cent change month ago -2,8 -3,3 0,1 Per cent change year ago 4,0 6,0 4,3 Per cent change year ago -2,8 -6,1 -7,7 Woodpulp 949,0 949,1 964,6 Woodpulp 688,0 663,3 664,7 Per cent change month ago -0,1 0,0 1,6 Per cent change month ago -2,6 -3,6 0,2 Per cent change year ago 16,5 13,0 9,9 Per cent change year ago 8,9 0,0 -2,7 Non-ferrous metals 288,3 300,3 296,4 Non-ferrous metals 209,0 209,9 204,3 Per cent change month ago 4,6 4,2 -1,3 Per cent change month ago 2,0 0,4 -2,7 Per cent change year ago 21,6 36,7 23,6 Per cent change year ago 13,6 21,1 9,4 Copper 9563,7 9867,2 9530,1 Copper 6933,7 6896,3 6567,5 Per cent change month ago 4,7 3,2 -3,4 Per cent change month ago 2,1 -0,5 -4,8 Per cent change year ago 29,5 44,4 27,7 Per cent change year ago 21,0 27,9 13,1 Aluminium 2440,2 2507,8 2552,2 Aluminium 1769,1 1752,7 1758,8 Per cent change month ago 4,0 2,8 1,8 Per cent change month ago 1,4 -0,9 0,3 Per cent change year ago 9,1 22,7 15,7 Per cent change year ago 1,9 8,7 2,5 Lead 2600,2 2586,2 2623,3 Lead 1885,1 1807,5 1807,8 Per cent change month ago 8,1 -0,5 1,4 Per cent change month ago 5,4 -4,1 0,0 Per cent change year ago 9,8 21,3 20,8 Per cent change year ago 2,6 7,5 7,0 Zinc 2373,9 2464,7 2348,9 Zinc 1721,1 1722,6 1618,7 Per cent change month ago 4,5 3,8 -4,7 Per cent change month ago 1,9 0,1 -6,0 Per cent change year ago -2,5 14,4 3,3 Per cent change year ago -8,9 1,3 -8,6 Nickel 25609,4 28250,1 26807,4 Nickel 18566,8 19744,4 18473,8 Per cent change month ago 6,5 10,3 -5,1 Per cent change month ago 3,8 6,3 -6,4 Per cent change year ago 38,9 49,7 19,4 Per cent change year ago 29,8 32,6 5,7 Iron ore, steel scrap 653,3 660,0 662,8 Iron ore, steel scrap 473,6 461,3 456,8 Per cent change month ago 7,6 1,0 0,4 Per cent change month ago 5,0 -2,6 -1,0 Per cent change year ago 86,6 87,8 86,4 Per cent change year ago 74,3 66,3 65,1 Energy raw materials 335,2 351,3 388,6 Energy raw materials 243,0 245,5 267,8 Per cent change month ago 3,5 4,8 10,6 Per cent change month ago 1,0 1,0 9,1 Per cent change year ago 21,2 31,6 37,3 Per cent change year ago 13,2 16,6 21,6 Coking coal 490,5 479,3 478,9 Coking coal 355,6 335,0 330,0 Per cent change month ago 7,9 -2,3 -0,1 Per cent change month ago 5,2 -5,8 -1,5 Per cent change year ago 34,2 37,8 36,0 Per cent change year ago 25,4 22,0 20,4 Crude oil 328,1 345,4 384,5 Crude oil 237,9 241,4 265,0 Per cent change month ago 3,2 5,3 11,3 Per cent change month ago 0,7 1,5 9,8 Per cent change year ago 20,4 31,2 37,4 Per cent change year ago 12,5 16,2 21,7 Source : SWEDBANK and HWWA-Institute for Economic Research Hamburg Source : SWEDBANK and HWWA-Institute for Economic Research Hamburg Swedbank Economic Research Department Swedbank’s monthly Energy & Commodities newsletter is published as a service to our customers. We believe that we have used reliable sources and methods in the preparation SE-105 34 Stockholm, Sweden of the analyses reported in this publication. However, we cannot guarantee the accuracy or Phone +46-8-5859 7740 completeness of the report and cannot be held responsible for any error or omission in the ek.sekr@swedbank.se underlying material or its use. Readers are encouraged to base any (investment) decisions www.swedbank.se on other material as well. Neither Swedbank nor its employees may be held responsible for Legally responsible publisher losses or damages, direct or indirect, owing to any errors or omissions in Swedbank’s Cecilia Hermansson, +46-88-5859 7720 monthly Energy & Commodities newsletter. Magnus Alvesson, +46-8-5859 3341 Jörgen Kennemar, +46-8-5859 7730 Economic Research Department. Swedbank AB. SE-105 34 Stockholm. Phone +46-8-5859 1000. E-mail: ek.sekr@swedbank.se www.swedbank.se Legally responsible publisher: Cecilia Hermansson. +46-8-5859 7720. Magnus Alvesson. +46-8-5859 3341. Jörgen Kennemar. +46-8-5859 7730.