SlideShare una empresa de Scribd logo
1 de 4
Descargar para leer sin conexión
The Estonian Economy
Monthly newsletter from Swedbank’s Economic Research Department
by Annika Paabut                                                                                         No. 1 • 21 June 2012


        More stable growth ahead
         The economic growth in the first quarter was supported by strengthening
          domestic demand, especially investments growth. As export growth
          continued to slow, the main contribution to value added shifted from
          manufacturing to more domestically oriented sectors like construction and
          retail.

         Despite falling consumer confidence, private consumption has shown strong
          growth rates, supported by continuously improving labour market conditions.
          Expenditures on durables have grown the most, while that on necessities has
          been rather sluggish.

         Investment growth will be strong this year. The public sector investment
          projects are financed by increasing EU funds and CO2 quota sales revenues.
          In addition, many manufacturing companies are facing capacity constraints
          which induce their investment activity, especially at the end of the year.


GDP growth slowing expectedly                                          The main contributors to growth of value added
                                                                       were domestically oriented sectors like construction
In 1Q of 2012 GDP (seasonally adjusted)
                                                                       and ICT sectors. Since the end of 2010 the
decelerated to 3.7% y-o-y from 5.1% in 4Q 2011.
                                                                       importance of the retail sector in growth has
Domestic demand was expectedly the main
                                                                       increased as well. This all in all shows a strong
contributor to the growth – exports growth has
                                                                       recovery of the domestic demand – solid growth in
slowed and imports growth accelerated turning net
                                                                       private consumption and investments. At the same
exports contribution to the negative side. Domestic
                                                                       time, the slowdown of value added growth stems
demand is mainly fuelled by the investments growth
                                                                       very much from the manufacturing sector – the
that reached almost 17%. Private consumption
                                                                       growth of exported volumes in electronics
grew by solid 3.2% in 1Q.
                                                                       manufacturing started to increase with double-digit
Contributions to GDP annual growth
                                                                       rates already in 2010 and it continued throughout
(constant prices, seasonally adjusted)                                 2011 as well. In 1Q this year the contribution of the
  20%
                                                                       manufacturing was negative (-1 pp) and the main
                                                                       reason behind the slower growth in manufacturing
  15%
                                                                       is, again, electronics sector.
  10%
                                                                       All in all, we expect continuing growth in value
   5%
                                                                       added in construction sector, retail sector as well as
   0%                                                                  in real estate related activities. The latter is
  -5% 2008          2009        2010           2011         2012       expected as the activity in real estate market is
 -10%                                                                  expected to increase by the end of the year.
                                                                       Construction sector growth will be supported, on the
 -15%
                                                                       one hand by the governments planned investments
 -20%
                                                                       financed by EU fund and/or revenues from CO2
 -25%                                                                  quota sales and on the other hand, as shown in a
                               Net export
                               Gov ernment consumption
                               Inv estments
                               Priv ate consumption
 Source: Eurostat              GDP


                    Economic Research Department. Swedbank AB. SE-105 34 Stockholm. Phone +46-8-5859 1000.
                                       E-mail: ek.sekr@swedbank.com www.swedbank.com
                               Legally responsible publisher: Cecilia Hermansson, +46-8-5859 7720.
                                       Annika Paabut, +372 6 135 440. Elina Allikalt, +372 6 131 989.
The Estonian Economy

                                 Monthly newsletter from Swedbank’s Economic Research Department, continued

                                                            Nr 1 • 21 June 2012


                                                    1
survey of manufacturing companies , the private                                 however, positive growth rates during the first four
sector is expected to increase their investments as                             months of the 2012 compared to the same period
well (mainly in the second half of the year) as many                            last year.
of manufacturing entrepreneurs are expecting
increase in turnovers. Retail sector will continue to                           Contributions to goods export annual growth
benefit from recovering confidence of residential                               (current prices)
households and continually increasing inflow of                                  40%                                                 Other
tourists from neighbouring countries.
                                                                                 30%                                                 Vehicles
Contributions to GDP growth by economic activity
                                                                                 20%                                                 Machinery ,
    15%
                                                        Other                                                                        equipment
                                                                                 10%                                                 Base
    10%
                                                        Real estate,                                                                 metals
                                                        renting etc
                                                                                  0%                                                 Wood, -
     5%                                                 Transporta-
                                                                                         2008     2009        2010   2011   2012     products
                                                        tion, storage
                                                                                 -10%                                         4      Mineral
     0%                                                 Retail                                                              months   products
           2009        2010        2011      2012
                                                                                 -20%                                                Food
    -5%                                                 Construction

                                                                                 -30%                                                Total
    -10%                                                Manuf ac-
                                                                                 Source: Statistics Estonia
                                                        turing
    -15%                                                Agriculture
                                                                                Exports of goods and services grew slower than
    -20%                                                GDP                     imports – in 1Q 2012 exports annual growth in real
    Source: Statistics Estonia                                                  terms was 6.8% and imports 9.9%. The slowdown
                                                                                of exports volumes was expected due to the high
                                                                                comparison base as well as increasing uncertainty
                                                                                in destination countries economies. In addition, the
Mixed signals in external balance                                               overall economic environment in the world is not
Exports volumes have despite shaky external                                     supporting fast growth in exports – even though the
environment shown rapid growth during the last                                  outlook for near future of the main export partners
couple of years – in 2010 and 2011 the volume                                   has improved somewhat the short term downward
increased by more than 20% in annual terms. The                                 risks have risen. Imports growth is going hand in
first quarter of this year may describe with a                                  hand with recovery of domestic demand and
considerably lower growth rates – due to historically                           slowing exports growth; during the last couple of
high volumes seen last year, the growth cannot                                  years the exports growth determined that of imports
continue with similar rates without causing a                                   and private consumption did not affected it much.
bubble. The other explanation stems from the                                    Now, the situation has changed – thriving private
structure of the exports. The main group of                                     consumption is inducing demand for imported
exported goods is still machinery and equipment                                 goods. In the near future, as imports growth will
(see graph) that in turn is related to the fast growth                          outpace that of exports, the contribution of net
seen in the manufacturing of electronics since the                              export to growth will be negative.
middle of 2010. Mineral products exports are by
                                                                                Export growth is expected to slow during this year
nature transit – Estonia has no such natural
                                                                                and pick up again during next as the overall
resources and therefore all the needed products are
                                                                                economic activity in the neighbouring countries will
brought in, remanufactured and exported again.
                                                                                increase. In addition, in recent past the export
Other largest groups of goods that are exported
                                                                                growth was mainly determined by rapid growth of
include food industry products and wood and wood
                                                                                export sales in one sector (electronics), but this and
products manufacturing as well as production of
                                                                                next year we expect the export sales in other
furniture. Latter three branches have shown,
                                                                                sectors to contribute more. The four months
                                                                                average exports sales of the electronics sector is
                                                                                approximately 14% lower than a year ago, but
                                                                                higher than average volume sold during the whole
1
                                                                                year (in first half of the last year the foreign demand
 Conducted by Swedbank; covered more than 200 industrial                        for electronic sector was at all time highest). We
companies with turnover more than EUR 4 million.                                expect export volumes in this sector to remain at
https://www.swedbank.ee/static/pdf/toostusettevotted_eng.pdf


                                                                        2 (4)
The Estonian Economy

                      Monthly newsletter from Swedbank’s Economic Research Department, continued

                                                Nr 1 • 21 June 2012


the current level or slightly increase. The overall              decelerated    due    to     seasonal       reasons.
increase in export sales will, according to our                  Nevertheless, nominal wage bill has increased
calculation, stem from other sectors like food and               hand in hand with private consumption
wood industries as well as manufacture of                        expenditures pointing on fading fears of
machinery and equipment and electrical equipment.                unemployment and future hardship and stronger
According to the previously mentioned survey1, the               confidence in households’ financial situation in the
most of manufacturing companies is planning to                   near future.
increase their turnover during this year. Most
optimistic ones were firms in food industry – 95% of             Private consumption and consumer confidence
firms in food manufacturing are expecting higher                 (left scale: annual growth; right scale: points)
turnovers than previous year. The average                            20%                                                                    20
expectation of the annual increase amounted                          15%
according to the survey 10.3%. At the same time,                                                                                            10

all those companies are facing limitations in                        10%
                                                                                                                                            0
capacity utilisation – only 26% of enterprises                        5%
studied are ready to increase their turnover without
                                                                      0%                                                                    -10
additional investments.                                                     2007      2008       2009          2010      2011        2012
                                                                     -5%
According to our forecast, export volumes are                                                                                               -20
                                                                     -10%
expected to grow by 3.1% in 2012 and 7.1% in
                                                                                                                                            -30
2013 as the economic activity in the neighbouring                    -15%
countries (the main export destination countries) will               -20%                                                                   -40
increase. Nevertheless, overall estimation of
                                                                              Real wage                           Food prices
exports volume growth might in light of the
                                                                              Priv ate consumption                Consumer conf idence (r.s.)
mentioned survey be too conservative – we might
                                                                     Source: Statistics Estonia, DG ECFIN
need to overlook our forecast already in near future.
Shadow economy decreasing, consumption
expenditures in line with wage bill growth                       Wage bill and employment growth, and consumer
                                                                 confidence
Private consumption has showed strong growth                     (left scale: annual growth; right scale: points)
already since the last quarter of 2010. Growth                       20%                                                                    10
continued throughout the 2011 and reached the
                                                                     15%
annual rate 4.4% (consumption of residential                                                                                                0
                                                                     10%
households). In the subcategories of goods
purchased, most importantly, the fastest growth is                    5%
                                                                                                                                            -10
observed in durable goods purchases. This, all in                     0%
all, reflects the grown confidence of households and                 -5% 2008             2009          2010          2011           2012
                                                                                                                                            -20
fading fears of future hardship due to loss of a job                 -10%
of household member(s). At the same time the
                                                                     -15%
consumption expenditures on necessities have                                                                                                -30

been rather sluggish pointing on rapidly growing                     -20%

food prices (in 2011 prices of food products and                     -25%                                                                   -40
non-alcoholic beverages in Estonia grew by                                   Priv ate consumption                Nominal wage bill
9.7% y-o-y, the average CPI growth reached                                   Real wage bill                      Employ ment
                                                                             Consumer conf idence (r.s.)
5% y-o-y) and more and more households suffering
                                                                     Source: Statistics Estonia, DG ECFIN
of constrained budgets. The average real wage
continued to grow third quarter in a row – in
1Q 2012 average real wage grew by 2.4%.                          Despite the crises years, shadow economy has
                                                                 according to recently published survey conducted
However, private consumption has shown strong                    by Estonian Economic Research Institute2
growth rates despite fall in confidence at the end of            decreased during the 2011 from 9% to 8% of GDP.
last year and the quite modest increase in real                  According to this survey 13% of households
purchasing power. This phenomenon may be
explained by the favourable developments in labour
market – job creation started already at the
beginning of last year and has continuing with
surprisingly strong rates throughout the year 2011.              2
                                                                  www.ki.ee „Shadow economy 2011“ (Varimajandus 2011, in
In the beginning of 2012, employment growth                      Estonian)


                                                         3 (4)
The Estonian Economy

                         Monthly newsletter from Swedbank’s Economic Research Department, continued

                                                   Nr 1 • 21 June 2012


preferred goods and services that are cheaper and                   Investments of enterprises
they do not care whether the taxes on the goods or                  (left scale: million EUR; right scale: annual growth)
services are paid. 52% of households prefer only                     900                                                             80%
legally produced goods and services and the rest                     800
                                                                                                                                     60%
may act both ways time to time. Illegal (i.e. those,                 700
on which the taxes are not paid) or barely illegal                   600
                                                                                                                                     40%

goods are most preferred in North-East Estonia and                   500                                                             20%
the least West-Estonia. Not surprisingly, the low
                                                                     400                                                             0%
income earners tend to buy goods and services on
                                                                     300
what the taxes are not paid or buy them more                                                                                         -20%
frequently than high income earners.                                 200
                                                                                                                                     -40%
                                                                     100
Investments about to grow                                              0                                                             -60%
Investments growth started already in 1Q of 2011                         2007        2008       2009    2010        2011      2012
and continued throughout the year. In 1Q 2012 the                          Buildings                           Construction
                                                                           Vehicles                            Computers
annual growth reached only 1% and the decline in                           Other equipment, machinery          Land
                                                                           Inv estments (r.s.)
construction investments might be by and large                       Source: Statistics Estonia
seasonal. As mentioned before, manufacturers are
expecting higher turnovers, but face limitations of                 grow faster at the end of the year, as during the first
capacity utilisations – majority of firms are not able              half uncertainties are still high, on account of which
to increase their turnover without investments.                     private enterprises tend to use the wait-and-see
According to the previously mentioned survey1                       strategy. However, the study mentioned before,
more than 50% of firms in manufacturing are                         suggests that private sector is more keen to start
planning to increase their investments this year (for               investment activity than was assumed in April,
instance, 63% of food industry and 57% of heavy                     when our forecast was published. At the same time,
industry firms are planning to increase their                       the short term risks remain due to the political
investments).                                                       uncertainties in the EMU countries, which in turn
We expect investments to increase by 11.5% y-o-y                    may increase the cautiousness of firms planning
(real terms) and next year the growth will slow a bit               their investments. Therefore, we expect private
to 6.3%. This year the public sector investments are                sector investment activity to increase during the
increasing considerably – they are financed by EU                   second half of the year.
funds and/or by revenues from CO2 quota trade. In
addition, we expect private sector investments to
                                                                                                                       Annika Paabut


Swedbank
Economic Research Department            Swedbank’s monthly newsletter The Estonian Economy is published as a service to our
SE-105 34 Stockholm                     customers. We believe that we have used reliable sources and methods in the preparation
Phone +46-8-5859 1028                   of the analyses reported in this publication. However, we cannot guarantee the accuracy or
ek.sekr@swedbank.com                    completeness of the report and cannot be held responsible for any error or omission in the
www.swedbank.com                        underlying material or its use. Readers are encouraged to base any (investment) decisions
                                        on other material as well. Neither Swedbank nor its employees may be held responsible for
Legally responsible publisher
                                        losses or damages, direct or indirect, owing to any errors or omissions in Swedbank’s
Cecilia Hermansson, +46-8-5859 7720
                                        monthly newsletter The Estonian Economy.
Annika Paabut +372 6 135 440
Elina Allikalt +372 6 131 989


                                                            4 (4)

Más contenido relacionado

La actualidad más candente

Flash Comment: Lithuania - January 30, 2012
Flash Comment: Lithuania - January 30, 2012Flash Comment: Lithuania - January 30, 2012
Flash Comment: Lithuania - January 30, 2012Swedbank
 
Flash comment: Estonia - February 10, 2012
Flash comment: Estonia - February 10, 2012Flash comment: Estonia - February 10, 2012
Flash comment: Estonia - February 10, 2012Swedbank
 
Informe País principales mercados Europeos- Mayo 2016
Informe País principales mercados Europeos- Mayo 2016Informe País principales mercados Europeos- Mayo 2016
Informe País principales mercados Europeos- Mayo 2016Ignacio Jimenez
 
Impact of covid 19 on Indian Economy & Banking Sector
Impact of covid 19 on Indian Economy & Banking SectorImpact of covid 19 on Indian Economy & Banking Sector
Impact of covid 19 on Indian Economy & Banking SectorDr Praveen S
 
The Lithuanian Economy - No 8, November 15, 2011
The Lithuanian Economy - No 8, November 15,  2011The Lithuanian Economy - No 8, November 15,  2011
The Lithuanian Economy - No 8, November 15, 2011Swedbank
 
Flash comment: Estonia - September 8, 2011
Flash comment: Estonia - September 8, 2011Flash comment: Estonia - September 8, 2011
Flash comment: Estonia - September 8, 2011Swedbank
 
Monthly Newsletter 5/2013
Monthly Newsletter 5/2013Monthly Newsletter 5/2013
Monthly Newsletter 5/2013Latvijas Banka
 
Perspectives Spanish and Global Economy Q4_2020 Quarterly Report
Perspectives Spanish and Global Economy Q4_2020 Quarterly ReportPerspectives Spanish and Global Economy Q4_2020 Quarterly Report
Perspectives Spanish and Global Economy Q4_2020 Quarterly ReportCírculo de Empresarios
 
Covid 19 Impact on Indian Economy
Covid 19 Impact on Indian EconomyCovid 19 Impact on Indian Economy
Covid 19 Impact on Indian EconomyDheeraj Agarwal
 
Impact of covid 19 on global economy
Impact of covid 19 on global economyImpact of covid 19 on global economy
Impact of covid 19 on global economyM S Siddiqui
 
The Lithuanian Economy - 2010 October
The Lithuanian Economy - 2010 OctoberThe Lithuanian Economy - 2010 October
The Lithuanian Economy - 2010 OctoberSwedbank
 
US-economy-accelerating-but-not-yet-in-top-gear
US-economy-accelerating-but-not-yet-in-top-gearUS-economy-accelerating-but-not-yet-in-top-gear
US-economy-accelerating-but-not-yet-in-top-gearOECD, Economics Department
 
OECD Global Interim Economic Outlook February 2016 presentation
OECD Global Interim Economic Outlook February 2016 presentationOECD Global Interim Economic Outlook February 2016 presentation
OECD Global Interim Economic Outlook February 2016 presentationOECD, Economics Department
 
Marja Nykänen: Financial stability – timely measures to curb household indebt...
Marja Nykänen: Financial stability – timely measures to curb household indebt...Marja Nykänen: Financial stability – timely measures to curb household indebt...
Marja Nykänen: Financial stability – timely measures to curb household indebt...Suomen Pankki
 
Foreign direct investment
Foreign direct investmentForeign direct investment
Foreign direct investmentRashedul Hasan
 
Finance-growth-and-inequality-bloomberg-london-17-june-2015
Finance-growth-and-inequality-bloomberg-london-17-june-2015Finance-growth-and-inequality-bloomberg-london-17-june-2015
Finance-growth-and-inequality-bloomberg-london-17-june-2015OECD, Economics Department
 
The Lithuanian Economy
The Lithuanian EconomyThe Lithuanian Economy
The Lithuanian EconomySwedbank
 
do-pro-growth-policies-generate-economic-instability-for-households-2015
do-pro-growth-policies-generate-economic-instability-for-households-2015do-pro-growth-policies-generate-economic-instability-for-households-2015
do-pro-growth-policies-generate-economic-instability-for-households-2015OECD, Economics Department
 

La actualidad más candente (20)

Flash Comment: Lithuania - January 30, 2012
Flash Comment: Lithuania - January 30, 2012Flash Comment: Lithuania - January 30, 2012
Flash Comment: Lithuania - January 30, 2012
 
Flash comment: Estonia - February 10, 2012
Flash comment: Estonia - February 10, 2012Flash comment: Estonia - February 10, 2012
Flash comment: Estonia - February 10, 2012
 
Informe País principales mercados Europeos- Mayo 2016
Informe País principales mercados Europeos- Mayo 2016Informe País principales mercados Europeos- Mayo 2016
Informe País principales mercados Europeos- Mayo 2016
 
Impact of covid 19 on Indian Economy & Banking Sector
Impact of covid 19 on Indian Economy & Banking SectorImpact of covid 19 on Indian Economy & Banking Sector
Impact of covid 19 on Indian Economy & Banking Sector
 
The Lithuanian Economy - No 8, November 15, 2011
The Lithuanian Economy - No 8, November 15,  2011The Lithuanian Economy - No 8, November 15,  2011
The Lithuanian Economy - No 8, November 15, 2011
 
Flash comment: Estonia - September 8, 2011
Flash comment: Estonia - September 8, 2011Flash comment: Estonia - September 8, 2011
Flash comment: Estonia - September 8, 2011
 
Monthly Newsletter 5/2013
Monthly Newsletter 5/2013Monthly Newsletter 5/2013
Monthly Newsletter 5/2013
 
Perspectives Spanish and Global Economy Q4_2020 Quarterly Report
Perspectives Spanish and Global Economy Q4_2020 Quarterly ReportPerspectives Spanish and Global Economy Q4_2020 Quarterly Report
Perspectives Spanish and Global Economy Q4_2020 Quarterly Report
 
Covid 19 Impact on Indian Economy
Covid 19 Impact on Indian EconomyCovid 19 Impact on Indian Economy
Covid 19 Impact on Indian Economy
 
Investor presentation july `18
Investor presentation   july `18Investor presentation   july `18
Investor presentation july `18
 
OECD Economic Survey of Spain 2014
OECD Economic Survey of Spain 2014OECD Economic Survey of Spain 2014
OECD Economic Survey of Spain 2014
 
Impact of covid 19 on global economy
Impact of covid 19 on global economyImpact of covid 19 on global economy
Impact of covid 19 on global economy
 
The Lithuanian Economy - 2010 October
The Lithuanian Economy - 2010 OctoberThe Lithuanian Economy - 2010 October
The Lithuanian Economy - 2010 October
 
US-economy-accelerating-but-not-yet-in-top-gear
US-economy-accelerating-but-not-yet-in-top-gearUS-economy-accelerating-but-not-yet-in-top-gear
US-economy-accelerating-but-not-yet-in-top-gear
 
OECD Global Interim Economic Outlook February 2016 presentation
OECD Global Interim Economic Outlook February 2016 presentationOECD Global Interim Economic Outlook February 2016 presentation
OECD Global Interim Economic Outlook February 2016 presentation
 
Marja Nykänen: Financial stability – timely measures to curb household indebt...
Marja Nykänen: Financial stability – timely measures to curb household indebt...Marja Nykänen: Financial stability – timely measures to curb household indebt...
Marja Nykänen: Financial stability – timely measures to curb household indebt...
 
Foreign direct investment
Foreign direct investmentForeign direct investment
Foreign direct investment
 
Finance-growth-and-inequality-bloomberg-london-17-june-2015
Finance-growth-and-inequality-bloomberg-london-17-june-2015Finance-growth-and-inequality-bloomberg-london-17-june-2015
Finance-growth-and-inequality-bloomberg-london-17-june-2015
 
The Lithuanian Economy
The Lithuanian EconomyThe Lithuanian Economy
The Lithuanian Economy
 
do-pro-growth-policies-generate-economic-instability-for-households-2015
do-pro-growth-policies-generate-economic-instability-for-households-2015do-pro-growth-policies-generate-economic-instability-for-households-2015
do-pro-growth-policies-generate-economic-instability-for-households-2015
 

Destacado

Swedbank Analysis Post-election Greece: 10 questions and answers
Swedbank Analysis Post-election Greece: 10 questions and answersSwedbank Analysis Post-election Greece: 10 questions and answers
Swedbank Analysis Post-election Greece: 10 questions and answersSwedbank
 
The Global Economy No. 8 - November 30, 2011
The Global Economy No. 8 -  November 30, 2011The Global Economy No. 8 -  November 30, 2011
The Global Economy No. 8 - November 30, 2011Swedbank
 
Housing Affordability Index for Baltics - December 14, 2011
Housing Affordability Index for Baltics - December 14, 2011Housing Affordability Index for Baltics - December 14, 2011
Housing Affordability Index for Baltics - December 14, 2011Swedbank
 
Energy & Commodities, No. 10 - December 14, 2011
Energy & Commodities, No. 10 - December 14, 2011 Energy & Commodities, No. 10 - December 14, 2011
Energy & Commodities, No. 10 - December 14, 2011 Swedbank
 
Purchasing Managers' Index May 2012
Purchasing Managers' Index May 2012Purchasing Managers' Index May 2012
Purchasing Managers' Index May 2012Swedbank
 
Swedbank Analysis No.8 - June 28, 2012
Swedbank Analysis No.8 - June 28, 2012Swedbank Analysis No.8 - June 28, 2012
Swedbank Analysis No.8 - June 28, 2012Swedbank
 
Purchasing Managers' Index Services - February 2012
Purchasing Managers' Index Services - February 2012Purchasing Managers' Index Services - February 2012
Purchasing Managers' Index Services - February 2012Swedbank
 
The Swedish Economy No.9 - December 22, 2011
The Swedish Economy No.9 - December 22, 2011 The Swedish Economy No.9 - December 22, 2011
The Swedish Economy No.9 - December 22, 2011 Swedbank
 
Energy & Commodities, No. 6 - June 8, 2012
Energy & Commodities, No. 6 - June 8, 2012Energy & Commodities, No. 6 - June 8, 2012
Energy & Commodities, No. 6 - June 8, 2012Swedbank
 

Destacado (9)

Swedbank Analysis Post-election Greece: 10 questions and answers
Swedbank Analysis Post-election Greece: 10 questions and answersSwedbank Analysis Post-election Greece: 10 questions and answers
Swedbank Analysis Post-election Greece: 10 questions and answers
 
The Global Economy No. 8 - November 30, 2011
The Global Economy No. 8 -  November 30, 2011The Global Economy No. 8 -  November 30, 2011
The Global Economy No. 8 - November 30, 2011
 
Housing Affordability Index for Baltics - December 14, 2011
Housing Affordability Index for Baltics - December 14, 2011Housing Affordability Index for Baltics - December 14, 2011
Housing Affordability Index for Baltics - December 14, 2011
 
Energy & Commodities, No. 10 - December 14, 2011
Energy & Commodities, No. 10 - December 14, 2011 Energy & Commodities, No. 10 - December 14, 2011
Energy & Commodities, No. 10 - December 14, 2011
 
Purchasing Managers' Index May 2012
Purchasing Managers' Index May 2012Purchasing Managers' Index May 2012
Purchasing Managers' Index May 2012
 
Swedbank Analysis No.8 - June 28, 2012
Swedbank Analysis No.8 - June 28, 2012Swedbank Analysis No.8 - June 28, 2012
Swedbank Analysis No.8 - June 28, 2012
 
Purchasing Managers' Index Services - February 2012
Purchasing Managers' Index Services - February 2012Purchasing Managers' Index Services - February 2012
Purchasing Managers' Index Services - February 2012
 
The Swedish Economy No.9 - December 22, 2011
The Swedish Economy No.9 - December 22, 2011 The Swedish Economy No.9 - December 22, 2011
The Swedish Economy No.9 - December 22, 2011
 
Energy & Commodities, No. 6 - June 8, 2012
Energy & Commodities, No. 6 - June 8, 2012Energy & Commodities, No. 6 - June 8, 2012
Energy & Commodities, No. 6 - June 8, 2012
 

Similar a The Estonian Economy, No. 1 - June 21, 2012

Flash comment: Estonia - December 9, 2011
Flash comment: Estonia - December 9, 2011Flash comment: Estonia - December 9, 2011
Flash comment: Estonia - December 9, 2011Swedbank
 
The Estonian Economy, No. 3 - August 14, 2012
The Estonian Economy, No. 3 - August 14, 2012The Estonian Economy, No. 3 - August 14, 2012
The Estonian Economy, No. 3 - August 14, 2012Swedbank
 
Flash comment: Estonia - August 10, 2012
Flash comment: Estonia - August 10, 2012Flash comment: Estonia - August 10, 2012
Flash comment: Estonia - August 10, 2012Swedbank
 
Flash comment: Estonia - May 11, 2012
Flash comment: Estonia - May 11, 2012Flash comment: Estonia - May 11, 2012
Flash comment: Estonia - May 11, 2012Swedbank
 
Flash comment: Estonia - September 7, 2012
Flash comment: Estonia - September 7, 2012Flash comment: Estonia - September 7, 2012
Flash comment: Estonia - September 7, 2012Swedbank
 
Lithuanian Economy - No 1, January 4, 2012
Lithuanian Economy - No 1, January 4,  2012Lithuanian Economy - No 1, January 4,  2012
Lithuanian Economy - No 1, January 4, 2012Swedbank
 
The Latvian Economy - No 1, January 17, 2012
The Latvian Economy - No 1, January 17, 2012The Latvian Economy - No 1, January 17, 2012
The Latvian Economy - No 1, January 17, 2012Swedbank
 
The Lithuanian Economy - No 6, September 2, 2011
The Lithuanian Economy - No 6, September 2,  2011The Lithuanian Economy - No 6, September 2,  2011
The Lithuanian Economy - No 6, September 2, 2011Swedbank
 
Flash comment: Estonia - May 8, 2012
Flash comment: Estonia - May 8, 2012Flash comment: Estonia - May 8, 2012
Flash comment: Estonia - May 8, 2012Swedbank
 
Flash comment: Latvia - September 8, 2012
Flash comment: Latvia  - September 8, 2012Flash comment: Latvia  - September 8, 2012
Flash comment: Latvia - September 8, 2012Swedbank
 
Lithuanian Economy, No. 2 - March 9, 2012
Lithuanian Economy, No. 2 - March 9,  2012Lithuanian Economy, No. 2 - March 9,  2012
Lithuanian Economy, No. 2 - March 9, 2012Swedbank
 
Flash comment: Estonia - August 30, 2011
Flash comment: Estonia - August 30, 2011Flash comment: Estonia - August 30, 2011
Flash comment: Estonia - August 30, 2011Swedbank
 
The Estonian Economy, No 7, November 28, 2011
The Estonian Economy, No 7, November 28, 2011The Estonian Economy, No 7, November 28, 2011
The Estonian Economy, No 7, November 28, 2011Swedbank
 
Flash comment: Estonia - November 11, 2011
Flash comment: Estonia - November 11, 2011Flash comment: Estonia - November 11, 2011
Flash comment: Estonia - November 11, 2011Swedbank
 
The Lithuanian Economy
The Lithuanian Economy The Lithuanian Economy
The Lithuanian Economy Swedbank
 
Flash Comment: Latvia - September 8, 2011
Flash Comment: Latvia - September 8, 2011Flash Comment: Latvia - September 8, 2011
Flash Comment: Latvia - September 8, 2011Swedbank
 
Flash comment: Latvia - June 8, 2012
Flash comment: Latvia  - June 8, 2012Flash comment: Latvia  - June 8, 2012
Flash comment: Latvia - June 8, 2012Swedbank
 
Industrial market outlook q1 2015
Industrial market outlook q1 2015Industrial market outlook q1 2015
Industrial market outlook q1 2015Zanasipovac
 

Similar a The Estonian Economy, No. 1 - June 21, 2012 (20)

Flash comment: Estonia - December 9, 2011
Flash comment: Estonia - December 9, 2011Flash comment: Estonia - December 9, 2011
Flash comment: Estonia - December 9, 2011
 
The Estonian Economy, No. 3 - August 14, 2012
The Estonian Economy, No. 3 - August 14, 2012The Estonian Economy, No. 3 - August 14, 2012
The Estonian Economy, No. 3 - August 14, 2012
 
Flash comment: Estonia - August 10, 2012
Flash comment: Estonia - August 10, 2012Flash comment: Estonia - August 10, 2012
Flash comment: Estonia - August 10, 2012
 
Flash comment: Estonia - May 11, 2012
Flash comment: Estonia - May 11, 2012Flash comment: Estonia - May 11, 2012
Flash comment: Estonia - May 11, 2012
 
Flash comment: Estonia - September 7, 2012
Flash comment: Estonia - September 7, 2012Flash comment: Estonia - September 7, 2012
Flash comment: Estonia - September 7, 2012
 
Lithuanian Economy - No 1, January 4, 2012
Lithuanian Economy - No 1, January 4,  2012Lithuanian Economy - No 1, January 4,  2012
Lithuanian Economy - No 1, January 4, 2012
 
The Latvian Economy - No 1, January 17, 2012
The Latvian Economy - No 1, January 17, 2012The Latvian Economy - No 1, January 17, 2012
The Latvian Economy - No 1, January 17, 2012
 
The Lithuanian Economy - No 6, September 2, 2011
The Lithuanian Economy - No 6, September 2,  2011The Lithuanian Economy - No 6, September 2,  2011
The Lithuanian Economy - No 6, September 2, 2011
 
Flash comment: Estonia - May 8, 2012
Flash comment: Estonia - May 8, 2012Flash comment: Estonia - May 8, 2012
Flash comment: Estonia - May 8, 2012
 
Flash comment: Latvia - September 8, 2012
Flash comment: Latvia  - September 8, 2012Flash comment: Latvia  - September 8, 2012
Flash comment: Latvia - September 8, 2012
 
Lithuanian Economy, No. 2 - March 9, 2012
Lithuanian Economy, No. 2 - March 9,  2012Lithuanian Economy, No. 2 - March 9,  2012
Lithuanian Economy, No. 2 - March 9, 2012
 
Flash comment: Estonia - August 30, 2011
Flash comment: Estonia - August 30, 2011Flash comment: Estonia - August 30, 2011
Flash comment: Estonia - August 30, 2011
 
The Estonian Economy, No 7, November 28, 2011
The Estonian Economy, No 7, November 28, 2011The Estonian Economy, No 7, November 28, 2011
The Estonian Economy, No 7, November 28, 2011
 
Flash comment: Estonia - November 11, 2011
Flash comment: Estonia - November 11, 2011Flash comment: Estonia - November 11, 2011
Flash comment: Estonia - November 11, 2011
 
The Lithuanian Economy
The Lithuanian Economy The Lithuanian Economy
The Lithuanian Economy
 
Flash Comment: Latvia - September 8, 2011
Flash Comment: Latvia - September 8, 2011Flash Comment: Latvia - September 8, 2011
Flash Comment: Latvia - September 8, 2011
 
Business... at a glance March 2021
Business... at a glance March 2021Business... at a glance March 2021
Business... at a glance March 2021
 
Flash comment: Latvia - June 8, 2012
Flash comment: Latvia  - June 8, 2012Flash comment: Latvia  - June 8, 2012
Flash comment: Latvia - June 8, 2012
 
Ace budget bulletin 2020
Ace  budget  bulletin 2020Ace  budget  bulletin 2020
Ace budget bulletin 2020
 
Industrial market outlook q1 2015
Industrial market outlook q1 2015Industrial market outlook q1 2015
Industrial market outlook q1 2015
 

Más de Swedbank

Swedbank corporate presentation April 25 2017
Swedbank corporate presentation April 25 2017Swedbank corporate presentation April 25 2017
Swedbank corporate presentation April 25 2017Swedbank
 
Swedbank foretagspresentation 25 april 2017
Swedbank foretagspresentation 25 april 2017Swedbank foretagspresentation 25 april 2017
Swedbank foretagspresentation 25 april 2017Swedbank
 
Delårsrapport kv1 2017
Delårsrapport kv1 2017Delårsrapport kv1 2017
Delårsrapport kv1 2017Swedbank
 
Interim report q1 2017
Interim report q1 2017Interim report q1 2017
Interim report q1 2017Swedbank
 
Year end report 2016
Year end report 2016Year end report 2016
Year end report 2016Swedbank
 
Bokslutskommuniké 2016
Bokslutskommuniké 2016Bokslutskommuniké 2016
Bokslutskommuniké 2016Swedbank
 
Swedbank företagspresentation, 2 februari 2017
Swedbank företagspresentation, 2 februari 2017Swedbank företagspresentation, 2 februari 2017
Swedbank företagspresentation, 2 februari 2017Swedbank
 
Swedbank corporate presentation, February 2 2017
Swedbank corporate presentation, February 2 2017Swedbank corporate presentation, February 2 2017
Swedbank corporate presentation, February 2 2017Swedbank
 
Swedbank Corporate Presentation, October 25 2016
Swedbank Corporate Presentation, October 25 2016Swedbank Corporate Presentation, October 25 2016
Swedbank Corporate Presentation, October 25 2016Swedbank
 
Swedbank företagspresentation, 25 oktober 2016
Swedbank företagspresentation, 25 oktober 2016Swedbank företagspresentation, 25 oktober 2016
Swedbank företagspresentation, 25 oktober 2016Swedbank
 
Swedbank Corporate Presentation, June 30 2016
Swedbank Corporate Presentation, June 30 2016Swedbank Corporate Presentation, June 30 2016
Swedbank Corporate Presentation, June 30 2016Swedbank
 
Swedbank företagspresentation, 30 juni 2016
Swedbank företagspresentation, 30 juni 2016Swedbank företagspresentation, 30 juni 2016
Swedbank företagspresentation, 30 juni 2016Swedbank
 
Swedbank corporate presentation Q1, 2016
Swedbank corporate presentation Q1, 2016Swedbank corporate presentation Q1, 2016
Swedbank corporate presentation Q1, 2016Swedbank
 
Swedbank företagspresentation kvartal 1, 2016.
Swedbank företagspresentation kvartal 1, 2016.Swedbank företagspresentation kvartal 1, 2016.
Swedbank företagspresentation kvartal 1, 2016.Swedbank
 
Swedbank corporate presentation Q4, 2015
Swedbank corporate presentation Q4, 2015Swedbank corporate presentation Q4, 2015
Swedbank corporate presentation Q4, 2015Swedbank
 
Swedbank företagspresentation kvartal 4,2015
Swedbank företagspresentation kvartal 4,2015Swedbank företagspresentation kvartal 4,2015
Swedbank företagspresentation kvartal 4,2015Swedbank
 
Year end report 2015
Year end report 2015Year end report 2015
Year end report 2015Swedbank
 
Bokslutskommuniké 2015
Bokslutskommuniké 2015Bokslutskommuniké 2015
Bokslutskommuniké 2015Swedbank
 
Swedbank Företagspresentation, September 2015
Swedbank Företagspresentation, September 2015Swedbank Företagspresentation, September 2015
Swedbank Företagspresentation, September 2015Swedbank
 
Swedbank Corporate Presentation, September 2015
Swedbank Corporate Presentation, September 2015Swedbank Corporate Presentation, September 2015
Swedbank Corporate Presentation, September 2015Swedbank
 

Más de Swedbank (20)

Swedbank corporate presentation April 25 2017
Swedbank corporate presentation April 25 2017Swedbank corporate presentation April 25 2017
Swedbank corporate presentation April 25 2017
 
Swedbank foretagspresentation 25 april 2017
Swedbank foretagspresentation 25 april 2017Swedbank foretagspresentation 25 april 2017
Swedbank foretagspresentation 25 april 2017
 
Delårsrapport kv1 2017
Delårsrapport kv1 2017Delårsrapport kv1 2017
Delårsrapport kv1 2017
 
Interim report q1 2017
Interim report q1 2017Interim report q1 2017
Interim report q1 2017
 
Year end report 2016
Year end report 2016Year end report 2016
Year end report 2016
 
Bokslutskommuniké 2016
Bokslutskommuniké 2016Bokslutskommuniké 2016
Bokslutskommuniké 2016
 
Swedbank företagspresentation, 2 februari 2017
Swedbank företagspresentation, 2 februari 2017Swedbank företagspresentation, 2 februari 2017
Swedbank företagspresentation, 2 februari 2017
 
Swedbank corporate presentation, February 2 2017
Swedbank corporate presentation, February 2 2017Swedbank corporate presentation, February 2 2017
Swedbank corporate presentation, February 2 2017
 
Swedbank Corporate Presentation, October 25 2016
Swedbank Corporate Presentation, October 25 2016Swedbank Corporate Presentation, October 25 2016
Swedbank Corporate Presentation, October 25 2016
 
Swedbank företagspresentation, 25 oktober 2016
Swedbank företagspresentation, 25 oktober 2016Swedbank företagspresentation, 25 oktober 2016
Swedbank företagspresentation, 25 oktober 2016
 
Swedbank Corporate Presentation, June 30 2016
Swedbank Corporate Presentation, June 30 2016Swedbank Corporate Presentation, June 30 2016
Swedbank Corporate Presentation, June 30 2016
 
Swedbank företagspresentation, 30 juni 2016
Swedbank företagspresentation, 30 juni 2016Swedbank företagspresentation, 30 juni 2016
Swedbank företagspresentation, 30 juni 2016
 
Swedbank corporate presentation Q1, 2016
Swedbank corporate presentation Q1, 2016Swedbank corporate presentation Q1, 2016
Swedbank corporate presentation Q1, 2016
 
Swedbank företagspresentation kvartal 1, 2016.
Swedbank företagspresentation kvartal 1, 2016.Swedbank företagspresentation kvartal 1, 2016.
Swedbank företagspresentation kvartal 1, 2016.
 
Swedbank corporate presentation Q4, 2015
Swedbank corporate presentation Q4, 2015Swedbank corporate presentation Q4, 2015
Swedbank corporate presentation Q4, 2015
 
Swedbank företagspresentation kvartal 4,2015
Swedbank företagspresentation kvartal 4,2015Swedbank företagspresentation kvartal 4,2015
Swedbank företagspresentation kvartal 4,2015
 
Year end report 2015
Year end report 2015Year end report 2015
Year end report 2015
 
Bokslutskommuniké 2015
Bokslutskommuniké 2015Bokslutskommuniké 2015
Bokslutskommuniké 2015
 
Swedbank Företagspresentation, September 2015
Swedbank Företagspresentation, September 2015Swedbank Företagspresentation, September 2015
Swedbank Företagspresentation, September 2015
 
Swedbank Corporate Presentation, September 2015
Swedbank Corporate Presentation, September 2015Swedbank Corporate Presentation, September 2015
Swedbank Corporate Presentation, September 2015
 

Último

Event mailer assignment progress report .pdf
Event mailer assignment progress report .pdfEvent mailer assignment progress report .pdf
Event mailer assignment progress report .pdftbatkhuu1
 
Yaroslav Rozhankivskyy: Три складові і три передумови максимальної продуктивн...
Yaroslav Rozhankivskyy: Три складові і три передумови максимальної продуктивн...Yaroslav Rozhankivskyy: Три складові і три передумови максимальної продуктивн...
Yaroslav Rozhankivskyy: Три складові і три передумови максимальної продуктивн...Lviv Startup Club
 
Famous Olympic Siblings from the 21st Century
Famous Olympic Siblings from the 21st CenturyFamous Olympic Siblings from the 21st Century
Famous Olympic Siblings from the 21st Centuryrwgiffor
 
Call Girls in Gomti Nagar - 7388211116 - With room Service
Call Girls in Gomti Nagar - 7388211116  - With room ServiceCall Girls in Gomti Nagar - 7388211116  - With room Service
Call Girls in Gomti Nagar - 7388211116 - With room Servicediscovermytutordmt
 
Progress Report - Oracle Database Analyst Summit
Progress  Report - Oracle Database Analyst SummitProgress  Report - Oracle Database Analyst Summit
Progress Report - Oracle Database Analyst SummitHolger Mueller
 
MONA 98765-12871 CALL GIRLS IN LUDHIANA LUDHIANA CALL GIRL
MONA 98765-12871 CALL GIRLS IN LUDHIANA LUDHIANA CALL GIRLMONA 98765-12871 CALL GIRLS IN LUDHIANA LUDHIANA CALL GIRL
MONA 98765-12871 CALL GIRLS IN LUDHIANA LUDHIANA CALL GIRLSeo
 
RSA Conference Exhibitor List 2024 - Exhibitors Data
RSA Conference Exhibitor List 2024 - Exhibitors DataRSA Conference Exhibitor List 2024 - Exhibitors Data
RSA Conference Exhibitor List 2024 - Exhibitors DataExhibitors Data
 
Call Girls Navi Mumbai Just Call 9907093804 Top Class Call Girl Service Avail...
Call Girls Navi Mumbai Just Call 9907093804 Top Class Call Girl Service Avail...Call Girls Navi Mumbai Just Call 9907093804 Top Class Call Girl Service Avail...
Call Girls Navi Mumbai Just Call 9907093804 Top Class Call Girl Service Avail...Dipal Arora
 
Regression analysis: Simple Linear Regression Multiple Linear Regression
Regression analysis:  Simple Linear Regression Multiple Linear RegressionRegression analysis:  Simple Linear Regression Multiple Linear Regression
Regression analysis: Simple Linear Regression Multiple Linear RegressionRavindra Nath Shukla
 
VIP Call Girls Gandi Maisamma ( Hyderabad ) Phone 8250192130 | ₹5k To 25k Wit...
VIP Call Girls Gandi Maisamma ( Hyderabad ) Phone 8250192130 | ₹5k To 25k Wit...VIP Call Girls Gandi Maisamma ( Hyderabad ) Phone 8250192130 | ₹5k To 25k Wit...
VIP Call Girls Gandi Maisamma ( Hyderabad ) Phone 8250192130 | ₹5k To 25k Wit...Suhani Kapoor
 
Mysore Call Girls 8617370543 WhatsApp Number 24x7 Best Services
Mysore Call Girls 8617370543 WhatsApp Number 24x7 Best ServicesMysore Call Girls 8617370543 WhatsApp Number 24x7 Best Services
Mysore Call Girls 8617370543 WhatsApp Number 24x7 Best ServicesDipal Arora
 
Call Girls Jp Nagar Just Call 👗 7737669865 👗 Top Class Call Girl Service Bang...
Call Girls Jp Nagar Just Call 👗 7737669865 👗 Top Class Call Girl Service Bang...Call Girls Jp Nagar Just Call 👗 7737669865 👗 Top Class Call Girl Service Bang...
Call Girls Jp Nagar Just Call 👗 7737669865 👗 Top Class Call Girl Service Bang...amitlee9823
 
Cracking the Cultural Competence Code.pptx
Cracking the Cultural Competence Code.pptxCracking the Cultural Competence Code.pptx
Cracking the Cultural Competence Code.pptxWorkforce Group
 
7.pdf This presentation captures many uses and the significance of the number...
7.pdf This presentation captures many uses and the significance of the number...7.pdf This presentation captures many uses and the significance of the number...
7.pdf This presentation captures many uses and the significance of the number...Paul Menig
 
The Path to Product Excellence: Avoiding Common Pitfalls and Enhancing Commun...
The Path to Product Excellence: Avoiding Common Pitfalls and Enhancing Commun...The Path to Product Excellence: Avoiding Common Pitfalls and Enhancing Commun...
The Path to Product Excellence: Avoiding Common Pitfalls and Enhancing Commun...Aggregage
 
VIP Call Girls In Saharaganj ( Lucknow ) 🔝 8923113531 🔝 Cash Payment (COD) 👒
VIP Call Girls In Saharaganj ( Lucknow  ) 🔝 8923113531 🔝  Cash Payment (COD) 👒VIP Call Girls In Saharaganj ( Lucknow  ) 🔝 8923113531 🔝  Cash Payment (COD) 👒
VIP Call Girls In Saharaganj ( Lucknow ) 🔝 8923113531 🔝 Cash Payment (COD) 👒anilsa9823
 
Call Girls In DLf Gurgaon ➥99902@11544 ( Best price)100% Genuine Escort In 24...
Call Girls In DLf Gurgaon ➥99902@11544 ( Best price)100% Genuine Escort In 24...Call Girls In DLf Gurgaon ➥99902@11544 ( Best price)100% Genuine Escort In 24...
Call Girls In DLf Gurgaon ➥99902@11544 ( Best price)100% Genuine Escort In 24...lizamodels9
 
Value Proposition canvas- Customer needs and pains
Value Proposition canvas- Customer needs and painsValue Proposition canvas- Customer needs and pains
Value Proposition canvas- Customer needs and painsP&CO
 
Understanding the Pakistan Budgeting Process: Basics and Key Insights
Understanding the Pakistan Budgeting Process: Basics and Key InsightsUnderstanding the Pakistan Budgeting Process: Basics and Key Insights
Understanding the Pakistan Budgeting Process: Basics and Key Insightsseri bangash
 

Último (20)

Event mailer assignment progress report .pdf
Event mailer assignment progress report .pdfEvent mailer assignment progress report .pdf
Event mailer assignment progress report .pdf
 
Yaroslav Rozhankivskyy: Три складові і три передумови максимальної продуктивн...
Yaroslav Rozhankivskyy: Три складові і три передумови максимальної продуктивн...Yaroslav Rozhankivskyy: Три складові і три передумови максимальної продуктивн...
Yaroslav Rozhankivskyy: Три складові і три передумови максимальної продуктивн...
 
Famous Olympic Siblings from the 21st Century
Famous Olympic Siblings from the 21st CenturyFamous Olympic Siblings from the 21st Century
Famous Olympic Siblings from the 21st Century
 
Call Girls in Gomti Nagar - 7388211116 - With room Service
Call Girls in Gomti Nagar - 7388211116  - With room ServiceCall Girls in Gomti Nagar - 7388211116  - With room Service
Call Girls in Gomti Nagar - 7388211116 - With room Service
 
Progress Report - Oracle Database Analyst Summit
Progress  Report - Oracle Database Analyst SummitProgress  Report - Oracle Database Analyst Summit
Progress Report - Oracle Database Analyst Summit
 
MONA 98765-12871 CALL GIRLS IN LUDHIANA LUDHIANA CALL GIRL
MONA 98765-12871 CALL GIRLS IN LUDHIANA LUDHIANA CALL GIRLMONA 98765-12871 CALL GIRLS IN LUDHIANA LUDHIANA CALL GIRL
MONA 98765-12871 CALL GIRLS IN LUDHIANA LUDHIANA CALL GIRL
 
RSA Conference Exhibitor List 2024 - Exhibitors Data
RSA Conference Exhibitor List 2024 - Exhibitors DataRSA Conference Exhibitor List 2024 - Exhibitors Data
RSA Conference Exhibitor List 2024 - Exhibitors Data
 
Call Girls Navi Mumbai Just Call 9907093804 Top Class Call Girl Service Avail...
Call Girls Navi Mumbai Just Call 9907093804 Top Class Call Girl Service Avail...Call Girls Navi Mumbai Just Call 9907093804 Top Class Call Girl Service Avail...
Call Girls Navi Mumbai Just Call 9907093804 Top Class Call Girl Service Avail...
 
Regression analysis: Simple Linear Regression Multiple Linear Regression
Regression analysis:  Simple Linear Regression Multiple Linear RegressionRegression analysis:  Simple Linear Regression Multiple Linear Regression
Regression analysis: Simple Linear Regression Multiple Linear Regression
 
VIP Call Girls Gandi Maisamma ( Hyderabad ) Phone 8250192130 | ₹5k To 25k Wit...
VIP Call Girls Gandi Maisamma ( Hyderabad ) Phone 8250192130 | ₹5k To 25k Wit...VIP Call Girls Gandi Maisamma ( Hyderabad ) Phone 8250192130 | ₹5k To 25k Wit...
VIP Call Girls Gandi Maisamma ( Hyderabad ) Phone 8250192130 | ₹5k To 25k Wit...
 
Mysore Call Girls 8617370543 WhatsApp Number 24x7 Best Services
Mysore Call Girls 8617370543 WhatsApp Number 24x7 Best ServicesMysore Call Girls 8617370543 WhatsApp Number 24x7 Best Services
Mysore Call Girls 8617370543 WhatsApp Number 24x7 Best Services
 
Call Girls Jp Nagar Just Call 👗 7737669865 👗 Top Class Call Girl Service Bang...
Call Girls Jp Nagar Just Call 👗 7737669865 👗 Top Class Call Girl Service Bang...Call Girls Jp Nagar Just Call 👗 7737669865 👗 Top Class Call Girl Service Bang...
Call Girls Jp Nagar Just Call 👗 7737669865 👗 Top Class Call Girl Service Bang...
 
Cracking the Cultural Competence Code.pptx
Cracking the Cultural Competence Code.pptxCracking the Cultural Competence Code.pptx
Cracking the Cultural Competence Code.pptx
 
7.pdf This presentation captures many uses and the significance of the number...
7.pdf This presentation captures many uses and the significance of the number...7.pdf This presentation captures many uses and the significance of the number...
7.pdf This presentation captures many uses and the significance of the number...
 
The Path to Product Excellence: Avoiding Common Pitfalls and Enhancing Commun...
The Path to Product Excellence: Avoiding Common Pitfalls and Enhancing Commun...The Path to Product Excellence: Avoiding Common Pitfalls and Enhancing Commun...
The Path to Product Excellence: Avoiding Common Pitfalls and Enhancing Commun...
 
VVVIP Call Girls In Greater Kailash ➡️ Delhi ➡️ 9999965857 🚀 No Advance 24HRS...
VVVIP Call Girls In Greater Kailash ➡️ Delhi ➡️ 9999965857 🚀 No Advance 24HRS...VVVIP Call Girls In Greater Kailash ➡️ Delhi ➡️ 9999965857 🚀 No Advance 24HRS...
VVVIP Call Girls In Greater Kailash ➡️ Delhi ➡️ 9999965857 🚀 No Advance 24HRS...
 
VIP Call Girls In Saharaganj ( Lucknow ) 🔝 8923113531 🔝 Cash Payment (COD) 👒
VIP Call Girls In Saharaganj ( Lucknow  ) 🔝 8923113531 🔝  Cash Payment (COD) 👒VIP Call Girls In Saharaganj ( Lucknow  ) 🔝 8923113531 🔝  Cash Payment (COD) 👒
VIP Call Girls In Saharaganj ( Lucknow ) 🔝 8923113531 🔝 Cash Payment (COD) 👒
 
Call Girls In DLf Gurgaon ➥99902@11544 ( Best price)100% Genuine Escort In 24...
Call Girls In DLf Gurgaon ➥99902@11544 ( Best price)100% Genuine Escort In 24...Call Girls In DLf Gurgaon ➥99902@11544 ( Best price)100% Genuine Escort In 24...
Call Girls In DLf Gurgaon ➥99902@11544 ( Best price)100% Genuine Escort In 24...
 
Value Proposition canvas- Customer needs and pains
Value Proposition canvas- Customer needs and painsValue Proposition canvas- Customer needs and pains
Value Proposition canvas- Customer needs and pains
 
Understanding the Pakistan Budgeting Process: Basics and Key Insights
Understanding the Pakistan Budgeting Process: Basics and Key InsightsUnderstanding the Pakistan Budgeting Process: Basics and Key Insights
Understanding the Pakistan Budgeting Process: Basics and Key Insights
 

The Estonian Economy, No. 1 - June 21, 2012

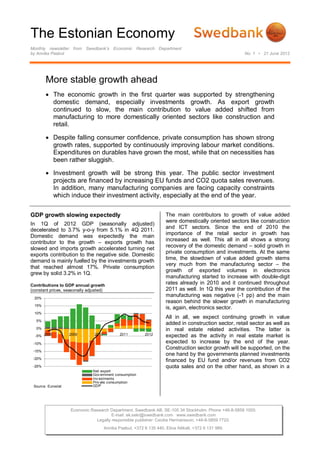
  • 1. The Estonian Economy Monthly newsletter from Swedbank’s Economic Research Department by Annika Paabut No. 1 • 21 June 2012 More stable growth ahead  The economic growth in the first quarter was supported by strengthening domestic demand, especially investments growth. As export growth continued to slow, the main contribution to value added shifted from manufacturing to more domestically oriented sectors like construction and retail.  Despite falling consumer confidence, private consumption has shown strong growth rates, supported by continuously improving labour market conditions. Expenditures on durables have grown the most, while that on necessities has been rather sluggish.  Investment growth will be strong this year. The public sector investment projects are financed by increasing EU funds and CO2 quota sales revenues. In addition, many manufacturing companies are facing capacity constraints which induce their investment activity, especially at the end of the year. GDP growth slowing expectedly The main contributors to growth of value added were domestically oriented sectors like construction In 1Q of 2012 GDP (seasonally adjusted) and ICT sectors. Since the end of 2010 the decelerated to 3.7% y-o-y from 5.1% in 4Q 2011. importance of the retail sector in growth has Domestic demand was expectedly the main increased as well. This all in all shows a strong contributor to the growth – exports growth has recovery of the domestic demand – solid growth in slowed and imports growth accelerated turning net private consumption and investments. At the same exports contribution to the negative side. Domestic time, the slowdown of value added growth stems demand is mainly fuelled by the investments growth very much from the manufacturing sector – the that reached almost 17%. Private consumption growth of exported volumes in electronics grew by solid 3.2% in 1Q. manufacturing started to increase with double-digit Contributions to GDP annual growth rates already in 2010 and it continued throughout (constant prices, seasonally adjusted) 2011 as well. In 1Q this year the contribution of the 20% manufacturing was negative (-1 pp) and the main reason behind the slower growth in manufacturing 15% is, again, electronics sector. 10% All in all, we expect continuing growth in value 5% added in construction sector, retail sector as well as 0% in real estate related activities. The latter is -5% 2008 2009 2010 2011 2012 expected as the activity in real estate market is -10% expected to increase by the end of the year. Construction sector growth will be supported, on the -15% one hand by the governments planned investments -20% financed by EU fund and/or revenues from CO2 -25% quota sales and on the other hand, as shown in a Net export Gov ernment consumption Inv estments Priv ate consumption Source: Eurostat GDP Economic Research Department. Swedbank AB. SE-105 34 Stockholm. Phone +46-8-5859 1000. E-mail: ek.sekr@swedbank.com www.swedbank.com Legally responsible publisher: Cecilia Hermansson, +46-8-5859 7720. Annika Paabut, +372 6 135 440. Elina Allikalt, +372 6 131 989.
  • 2. The Estonian Economy Monthly newsletter from Swedbank’s Economic Research Department, continued Nr 1 • 21 June 2012 1 survey of manufacturing companies , the private however, positive growth rates during the first four sector is expected to increase their investments as months of the 2012 compared to the same period well (mainly in the second half of the year) as many last year. of manufacturing entrepreneurs are expecting increase in turnovers. Retail sector will continue to Contributions to goods export annual growth benefit from recovering confidence of residential (current prices) households and continually increasing inflow of 40% Other tourists from neighbouring countries. 30% Vehicles Contributions to GDP growth by economic activity 20% Machinery , 15% Other equipment 10% Base 10% Real estate, metals renting etc 0% Wood, - 5% Transporta- 2008 2009 2010 2011 2012 products tion, storage -10% 4 Mineral 0% Retail months products 2009 2010 2011 2012 -20% Food -5% Construction -30% Total -10% Manuf ac- Source: Statistics Estonia turing -15% Agriculture Exports of goods and services grew slower than -20% GDP imports – in 1Q 2012 exports annual growth in real Source: Statistics Estonia terms was 6.8% and imports 9.9%. The slowdown of exports volumes was expected due to the high comparison base as well as increasing uncertainty in destination countries economies. In addition, the Mixed signals in external balance overall economic environment in the world is not Exports volumes have despite shaky external supporting fast growth in exports – even though the environment shown rapid growth during the last outlook for near future of the main export partners couple of years – in 2010 and 2011 the volume has improved somewhat the short term downward increased by more than 20% in annual terms. The risks have risen. Imports growth is going hand in first quarter of this year may describe with a hand with recovery of domestic demand and considerably lower growth rates – due to historically slowing exports growth; during the last couple of high volumes seen last year, the growth cannot years the exports growth determined that of imports continue with similar rates without causing a and private consumption did not affected it much. bubble. The other explanation stems from the Now, the situation has changed – thriving private structure of the exports. The main group of consumption is inducing demand for imported exported goods is still machinery and equipment goods. In the near future, as imports growth will (see graph) that in turn is related to the fast growth outpace that of exports, the contribution of net seen in the manufacturing of electronics since the export to growth will be negative. middle of 2010. Mineral products exports are by Export growth is expected to slow during this year nature transit – Estonia has no such natural and pick up again during next as the overall resources and therefore all the needed products are economic activity in the neighbouring countries will brought in, remanufactured and exported again. increase. In addition, in recent past the export Other largest groups of goods that are exported growth was mainly determined by rapid growth of include food industry products and wood and wood export sales in one sector (electronics), but this and products manufacturing as well as production of next year we expect the export sales in other furniture. Latter three branches have shown, sectors to contribute more. The four months average exports sales of the electronics sector is approximately 14% lower than a year ago, but higher than average volume sold during the whole 1 year (in first half of the last year the foreign demand Conducted by Swedbank; covered more than 200 industrial for electronic sector was at all time highest). We companies with turnover more than EUR 4 million. expect export volumes in this sector to remain at https://www.swedbank.ee/static/pdf/toostusettevotted_eng.pdf 2 (4)
  • 3. The Estonian Economy Monthly newsletter from Swedbank’s Economic Research Department, continued Nr 1 • 21 June 2012 the current level or slightly increase. The overall decelerated due to seasonal reasons. increase in export sales will, according to our Nevertheless, nominal wage bill has increased calculation, stem from other sectors like food and hand in hand with private consumption wood industries as well as manufacture of expenditures pointing on fading fears of machinery and equipment and electrical equipment. unemployment and future hardship and stronger According to the previously mentioned survey1, the confidence in households’ financial situation in the most of manufacturing companies is planning to near future. increase their turnover during this year. Most optimistic ones were firms in food industry – 95% of Private consumption and consumer confidence firms in food manufacturing are expecting higher (left scale: annual growth; right scale: points) turnovers than previous year. The average 20% 20 expectation of the annual increase amounted 15% according to the survey 10.3%. At the same time, 10 all those companies are facing limitations in 10% 0 capacity utilisation – only 26% of enterprises 5% studied are ready to increase their turnover without 0% -10 additional investments. 2007 2008 2009 2010 2011 2012 -5% According to our forecast, export volumes are -20 -10% expected to grow by 3.1% in 2012 and 7.1% in -30 2013 as the economic activity in the neighbouring -15% countries (the main export destination countries) will -20% -40 increase. Nevertheless, overall estimation of Real wage Food prices exports volume growth might in light of the Priv ate consumption Consumer conf idence (r.s.) mentioned survey be too conservative – we might Source: Statistics Estonia, DG ECFIN need to overlook our forecast already in near future. Shadow economy decreasing, consumption expenditures in line with wage bill growth Wage bill and employment growth, and consumer confidence Private consumption has showed strong growth (left scale: annual growth; right scale: points) already since the last quarter of 2010. Growth 20% 10 continued throughout the 2011 and reached the 15% annual rate 4.4% (consumption of residential 0 10% households). In the subcategories of goods purchased, most importantly, the fastest growth is 5% -10 observed in durable goods purchases. This, all in 0% all, reflects the grown confidence of households and -5% 2008 2009 2010 2011 2012 -20 fading fears of future hardship due to loss of a job -10% of household member(s). At the same time the -15% consumption expenditures on necessities have -30 been rather sluggish pointing on rapidly growing -20% food prices (in 2011 prices of food products and -25% -40 non-alcoholic beverages in Estonia grew by Priv ate consumption Nominal wage bill 9.7% y-o-y, the average CPI growth reached Real wage bill Employ ment Consumer conf idence (r.s.) 5% y-o-y) and more and more households suffering Source: Statistics Estonia, DG ECFIN of constrained budgets. The average real wage continued to grow third quarter in a row – in 1Q 2012 average real wage grew by 2.4%. Despite the crises years, shadow economy has according to recently published survey conducted However, private consumption has shown strong by Estonian Economic Research Institute2 growth rates despite fall in confidence at the end of decreased during the 2011 from 9% to 8% of GDP. last year and the quite modest increase in real According to this survey 13% of households purchasing power. This phenomenon may be explained by the favourable developments in labour market – job creation started already at the beginning of last year and has continuing with surprisingly strong rates throughout the year 2011. 2 www.ki.ee „Shadow economy 2011“ (Varimajandus 2011, in In the beginning of 2012, employment growth Estonian) 3 (4)
  • 4. The Estonian Economy Monthly newsletter from Swedbank’s Economic Research Department, continued Nr 1 • 21 June 2012 preferred goods and services that are cheaper and Investments of enterprises they do not care whether the taxes on the goods or (left scale: million EUR; right scale: annual growth) services are paid. 52% of households prefer only 900 80% legally produced goods and services and the rest 800 60% may act both ways time to time. Illegal (i.e. those, 700 on which the taxes are not paid) or barely illegal 600 40% goods are most preferred in North-East Estonia and 500 20% the least West-Estonia. Not surprisingly, the low 400 0% income earners tend to buy goods and services on 300 what the taxes are not paid or buy them more -20% frequently than high income earners. 200 -40% 100 Investments about to grow 0 -60% Investments growth started already in 1Q of 2011 2007 2008 2009 2010 2011 2012 and continued throughout the year. In 1Q 2012 the Buildings Construction Vehicles Computers annual growth reached only 1% and the decline in Other equipment, machinery Land Inv estments (r.s.) construction investments might be by and large Source: Statistics Estonia seasonal. As mentioned before, manufacturers are expecting higher turnovers, but face limitations of grow faster at the end of the year, as during the first capacity utilisations – majority of firms are not able half uncertainties are still high, on account of which to increase their turnover without investments. private enterprises tend to use the wait-and-see According to the previously mentioned survey1 strategy. However, the study mentioned before, more than 50% of firms in manufacturing are suggests that private sector is more keen to start planning to increase their investments this year (for investment activity than was assumed in April, instance, 63% of food industry and 57% of heavy when our forecast was published. At the same time, industry firms are planning to increase their the short term risks remain due to the political investments). uncertainties in the EMU countries, which in turn We expect investments to increase by 11.5% y-o-y may increase the cautiousness of firms planning (real terms) and next year the growth will slow a bit their investments. Therefore, we expect private to 6.3%. This year the public sector investments are sector investment activity to increase during the increasing considerably – they are financed by EU second half of the year. funds and/or by revenues from CO2 quota trade. In addition, we expect private sector investments to Annika Paabut Swedbank Economic Research Department Swedbank’s monthly newsletter The Estonian Economy is published as a service to our SE-105 34 Stockholm customers. We believe that we have used reliable sources and methods in the preparation Phone +46-8-5859 1028 of the analyses reported in this publication. However, we cannot guarantee the accuracy or ek.sekr@swedbank.com completeness of the report and cannot be held responsible for any error or omission in the www.swedbank.com underlying material or its use. Readers are encouraged to base any (investment) decisions on other material as well. Neither Swedbank nor its employees may be held responsible for Legally responsible publisher losses or damages, direct or indirect, owing to any errors or omissions in Swedbank’s Cecilia Hermansson, +46-8-5859 7720 monthly newsletter The Estonian Economy. Annika Paabut +372 6 135 440 Elina Allikalt +372 6 131 989 4 (4)