The Estonian Economy, No 3, 31 May 2011
•
0 recomendaciones•296 vistas

The Estonian economy grew strongly in the first quarter of 2011, reaching 8% growth driven by strong export sector performance and increased investment activity. Inflation remained high at 5.4% in April due to increasing commodity prices globally. The unemployment rate rose slightly to 14.4% in the first quarter due to rising economic activity, while employment growth was strong at 6.8%. Real wages continued to decline, allowing competitiveness to improve but weakening household purchasing power. Overall, the Estonian economy is growing further but high inflation continues to impact households.

Recomendados
Recomendados
Más contenido relacionado
La actualidad más candente
La actualidad más candente (20)
Destacado
Destacado (9)
Similar a The Estonian Economy, No 3, 31 May 2011
Similar a The Estonian Economy, No 3, 31 May 2011 (20)
Más de Swedbank
Más de Swedbank (20)
Último
Último (20)
The Estonian Economy, No 3, 31 May 2011
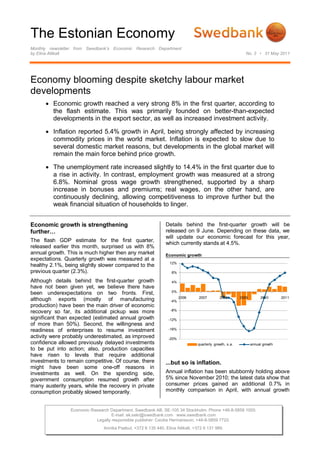
- 1. The Estonian Economy Monthly newsletter from Swedbank’s Economic Research Department by Elina Allikalt No. 3 • 31 May 2011 Economy blooming despite sketchy labour market developments Economic growth reached a very strong 8% in the first quarter, according to the flash estimate. This was primarily founded on better-than-expected developments in the export sector, as well as increased investment activity. Inflation reported 5.4% growth in April, being strongly affected by increasing commodity prices in the world market. Inflation is expected to slow due to several domestic market reasons, but developments in the global market will remain the main force behind price growth. The unemployment rate increased slightly to 14.4% in the first quarter due to a rise in activity. In contrast, employment growth was measured at a strong 6.8%. Nominal gross wage growth strengthened, supported by a sharp increase in bonuses and premiums; real wages, on the other hand, are continuously declining, allowing competitiveness to improve further but the weak financial situation of households to linger. Economic growth is strengthening Details behind the first-quarter growth will be further… released on 9 June. Depending on these data, we will update our economic forecast for this year, The flash GDP estimate for the first quarter, which currently stands at 4.5%. released earlier this month, surprised us with 8% annual growth. This is much higher then any market Economic growth expectations. Quarterly growth was measured at a 12% healthy 2.1%, being slightly slower compared to the previous quarter (2.3%). 8% Although details behind the first-quarter growth 4% have not been given yet, we believe there have 0% been underexpectations on two fronts. First, 2006 2007 2008 2009 2010 2011 although exports (mostly of manufacturing -4% production) have been the main driver of economic -8% recovery so far, its additional pickup was more significant than expected (estimated annual growth -12% of more than 50%). Second, the willingness and readiness of enterprises to resume investment -16% activity were probably underestimated, as improved -20% confidence allowed previously delayed investments quarterly growth, s.a. annual growth to be put into action; also, production capacities have risen to levels that require additional investments to remain competitive. Of course, there ...but so is inflation. might have been some one-off reasons in investments as well. On the spending side, Annual inflation has been stubbornly holding above government consumption resumed growth after 5% since November 2010; the latest data show that many austerity years, while the recovery in private consumer prices gained an additional 0.7% in consumption probably slowed temporarily. monthly comparison in April, with annual growth Economic Research Department. Swedbank AB. SE-105 34 Stockholm. Phone +46-8-5859 1000. E-mail: ek.sekr@swedbank.com www.swedbank.com Legally responsible publisher: Cecilia Hermansson, +46-8-5859 7720. Annika Paabut, +372 6 135 440. Elina Allikalt, +372 6 131 989.
- 2. The Estonian Economy Monthly newsletter from Swedbank’s Economic Research Department, continued Nr 3 • 31 May 2011 reaching 5.4%. Inflation continues to be strongly Price growth expectation founded on growing food prices, which in April 12% 80 increased 2% compared to March and 12.3% 10% compared to April last year, explaining more than 60 half of the annual inflation (see chart). Other major 8% 40 contributors were housing costs, transport, and 6% alcohol and tobacco; the first two are affected by 20 high energy commodity prices in the global market 4% and the latter by excise hikes. As most of the 0 2% inflation has been imported, the base inflation -20 remains much lower, at 2.2% in April. 0% 2007 2008 2009 2010 2011 -2% -40 Contributions to annual consumer price growth (percentage points) -4% -60 CPI, annual growth (ls) 12 other price trend expectations, retail sector (rs) transport housing price trend expectations, consumers (rs) 10 alcohol, tobacco Sources: SE, DG ECFIN f ood CPI 8 Unemployment fall pauses while employment continues to grow 6 Monthly registered unemployment figures had 4 suggested that the unemployment rate in the first quarter would remain roughly on the same level as 2 in the fourth quarter of last year. Labour Force 0 Survey results, however, reported a slight increase, 2007 2008 2009 2010 2011 from 13.6% to 14.4%. Nevertheless, this increase -2 can be fully attributed to another pickup in activity, which continues to be high (67.1% in the first -4 Source: SE, Swedbank quarter). Nonactivity declined the most among students and pensioners, who are now more willing to enter the labour market as the conditions and Looking forward, there seem to be factors in place outlook have improved. Supporting this are supporting both slowing inflation as well as further employment figures that showed a strong 6.8% price growth. On one hand, many commodities increase in annual comparison in the first quarter. In have been falling somewhat or holding steady for contrast, however, long-term unemployment is several months in the global market (including growing, making up 57% of total unemployment in food), inflation expectations have stabilised (see the first quarter, with half of these being out of work chart), the private consumption and labour market for more than two years. recovery remains rather strangled, and the high base effect will have its impact on growth rates in Labour market indicators the second half of the year – all pointing to slowing 25% 70% inflation. Also, transport costs declined in April (-0.2% in monthly comparison), and a further fall is 20% expected in coming months as fuel prices are 15% 65% decreasing. However, on the other hand, electricity prices are set to grow in August (by 6% on 10% average), in turn pressuring other prices through 5% 60% higher production costs. Also, despite some favourable trends in the global commodity markets, 0% their spillover to the local market has historically 2004 2005 2006 2007 2008 2009 2010 2011 proved to be rather slow; further developments in -5% 55% the world market pose the biggest risk to future -10% inflation. -15% 50% Our inflation forecast for this year currently points to employ ment, annual growth (ls) unemploy ment rate (ls) 3.8%; this will be revised upwards when the activ ity rate (rs) Source: SE updated forecast is released. 2 (5)
- 3. The Estonian Economy Monthly newsletter from Swedbank’s Economic Research Department, continued Nr 3 • 31 May 2011 Despite growing slightly in quarterly terms, the increases were seen in construction (23%), ICT unemployment rate has gone down substantially (40%), recreation and entertainment (39%), and from the crisis-high level of nearly 20% in the first transport and storage (7%). In contrast, a quarter a year ago to 14.4% this year. The number continuous decrease in employment was seen in of unemployed has fallen across the board, but the different services mostly related to the public sector, most among youth (-54% in annual terms), among for example education (-12%), administrative and men (-38%), in the Tallinn region (-39%), and support service activities (-19%) and public among short-term unemployed (-50%). The decline administration and defence (-3%). in the number of unemployed has been less pronounced among 50+-year-olds (-1%) and Change in employment among women (-10%; even growing in the rural (thousands; annual change) areas); this is partially explained by the fact that 60 unemployment never grew above average levels in other these categories. Nevertheless, as stated above, 40 the number of long-term unemployed is public serv ices continuously growing-- by 10% in the first quarter, 20 including by 45% of those who have been out of trade work for at least two years. This trend, together with 0 transport, the steadily rising number of discouraged people, 2007 2008 2009 2010 2011 storage emphasises once again the need to focus on labour -20 cons- market policies in order to intensify retraining, truction increase incentives for employers to hire long-term -40 manuf ac- unemployed, and avoid discouragement to rise to turing problematic levels. These developments also pose -60 total an additional risk factor to the labour market outlook, as the work force is seen to be declining -80 Source: SE due to both the aging population and emigration. Unemployment rate by duration Registered unemployment and vacancies 20% 60% 4,000 16% 18% 16% 50% 3,500 14% 14% 3,000 12% 40% 12% 10% 2,500 8% 30% 10% 6% 2,000 4% 20% 8% 1,500 2% 0% 10% 1,000 6% 2004 2005 2006 2007 2008 2009 2010 2011 > 24 months 500 4% 12-23 months 2009 2010 2011 6-11months < 6 months new unemploy ed v acancies share of long-term unemploy ment (rs) Source: SE unemploy ment rate (rs) Source: EUIF The strong employment growth, measured at 6.8% Registered unemployment and vacancy data from in the first quarter, was partially supported by the the Estonian Unemployment Insurance Fund has base effect, as employment reached its lowest level provided us with more optimism regarding the in this cycle during the first quarter of last year. second-quarter labour market outcome. Registered However, while employment growth in the fourth unemployment fell from 10.2% on average in the quarter was founded merely on the manufacturing first quarter to 9.6% in April and further to below 9% sector, figures for the first quarter are showing a (estimated) in May. The number of vacancies, at much broader employment recovery. Similar to the same time, is at the highest level in three years, economic growth structure, manufacturing is still the and the number of new unemployed has fallen to driving force of employment growth, reporting a the lowest level over the same period. Employment 22% increase in the first quarter; other notable expectations have been strongly positive this year 3 (5)
- 4. The Estonian Economy Monthly newsletter from Swedbank’s Economic Research Department, continued Nr 3 • 31 May 2011 for all sectors (see chart). However, further Wage growth differed considerably among sectors; significant improvement in the labour market, the data might also be temporarily affected by especially after the seasonal job period ends, is changes in the structure of wage earners, 1 thus not very dependent on the scale of actual structural giving a full picture of the current situation. Wage unemployment, as well as the success of the growth was the strongest in different small sectors applied labour market policies--especially like energy production (19% annual growth), mining considering that labour demand will strengthen (18%), and agriculture and forestry (9%). Wage further as more domestic-oriented sectors are growth in the manufacturing sector, which has been expected to continue recovering. Our current the main driver of economic recovery, slowed in the unemployment forecast stands at 13.5% on first quarter (from 5.9% in the fourth quarter to average for this year. 5.3%) and even turned slightly negative in real terms (-0.1%); while employment growth was very Employment expectations in coming months strong in this sector, the negative wage growth can (balance of increase/decrease answers) indicate exporters wish to continuously increase competitiveness and keep production costs low. 40 Average wages fell the most in administrative and support service activities (-4%). In an expected 20 event, the ICT sector overtook the financial activities sector in regards to the highest hourly 0 wage paid in the economy, reaching EUR 8.1, or 2006 2007 2008 2009 2010 2011 66% higher than the average in the first quarter. -20 Average gross wage -40 (annual growth) 25% -60 20% -80 industry construction 15% retail serv ices Source: DG ECFIN 10% Real wage growth continuously negative 5% Average gross wages continued to increase in the first quarter in nominal terms: monthly wages grew 0% 4.5% in annual comparison (reaching EUR 792), 2005 2006 2007 2008 2009 2010 2011 while hourly wages grew slower, by 2.3% -5% (EUR 4.87). This almost twofold difference in -10% growth rates can be explained by the pickup in Monthly wage Hourly wage irregular bonuses and premiums payments, which Monthly wage, real growth Hourly wage, real growth were up by 58%; as finances of companies improve, they find additional ways to reward and Real wage growth is expected to turn positive motivate their employees. With bonuses and during the second half of this year. This growth, premiums excluded, the monthly wage growth however, will at first be more concentrated in reached 3.2%. Despite growing nominal wages, specific sectors that are strongly export oriented inflation was high as well, resulting in a negative and/or are experiencing a wider shortage of labour. real growth rate of -0.9% for monthly wages and Wage growth will broaden to the rest of the -2.9% for hourly wages; this reflects the economy later as the more domestic-oriented continuously deteriorating financial situation of sectors recover. Much of these expectations, of households and their purchasing power as real course, are dependent on future inflation trends. wages have now been declining for more than two years in a row. 1 For example, increasing working hours and more full- time employment for those already employed. Also, the difference in wage levels of new employees vs. those who were downsized previously. 4 (5)
- 5. The Estonian Economy Monthly newsletter from Swedbank’s Economic Research Department, continued Nr 3 • 31 May 2011 Financial situation of households There are already early signs of strengthening (balance of better/worse answers) wage pressures due to high inflation, which pose a 20 risk to economic recovery and competitiveness. Also, talk of the need to raise the minimum wage 10 (currently at EUR 278.02) is intensifying; however, we believe a small increase will not significantly 0 worsen developments in the labour market and 2006 2007 2008 2009 2010 2011 economy. -10 -20 -30 -40 ov er last 12 months ov er next 12 months Source: DG ECFIN Elina Allikalt Swedbank Economic Research Department Swedbank’s monthly newsletter The Estonian Economy is published as a service to our SE-105 34 Stockholm customers. We believe that we have used reliable sources and methods in the preparation Phone +46-8-5859 1028 of the analyses reported in this publication. However, we cannot guarantee the accuracy or ek.sekr@swedbank.com completeness of the report and cannot be held responsible for any error or omission in the www.swedbank.com underlying material or its use. Readers are encouraged to base any (investment) decisions on other material as well. Neither Swedbank nor its employees may be held responsible for Legally responsible publisher losses or damages, direct or indirect, owing to any errors or omissions in Swedbank’s Cecilia Hermansson, +46-8-5859 7720 monthly newsletter The Estonian Economy. Annika Paabut +372 6 135 440 Elina Allikalt +372 6 131 989 5 (5)