SlideShare una empresa de Scribd logo
1 de 25
“CONTRIBUTION OF CITIES
IN CLIMATE CHANGE”
SYED KASHIF HUSSAIN SHAH
What is climate change?
A change in global or regional climate patterns, change apparent from the mid to late
20th century onwards and attributed largely to the increased levels of atmospheric carbon
dioxide produced by the use of fossil fuels.
Earth's average temperature has risen by 1.4°F over the past century, and is projected to rise
another 2 to 11.5°F over the next hundred years.
Figure Instrumental record of global average temperatures as compiled by National Aeronautics and
Space Administration (NASA).
THE CLEAR EVIDENCE
Rising global temperatures have been accompanied by changes in
weather and climate. Many places have seen changes in rainfall, resulting in more
floods, droughts, or intense rain, as well as more frequent and severe heat waves.
The oceans and glaciers have also experienced some big changes oceans are
warming and becoming more acidic, ice caps are melting, and sea levels are rising.
Source of graph: Wikipedia - Image created by Robert A. Rohde / Global Warming Art,
based on data from Permanent Service for Mean Sea Level (PSMSL), Douglas (1997).
Greenhouse gases act like a blanket around Earth:
INFORMATION ABOUT GREENHOUSE GASES (GHGs):-
Many GHGs, including water vapor (the most important),
ozone, carbon dioxide, methane, and nitrous oxide, are naturally present
in the atmosphere. Other GHGs are synthetic chemicals that are emitted
only as a result of human activity. Anthropogenic (human) activities are
significantly increasing atmospheric concentrations of many GHGs.
 Carbon dioxide (CO2)
Methane (CH4)
Nitrous oxide (N2O)
Hydro fluorocarbons (HFCs)
and per fluorocarbons (PFCs)
Disturbance in Atmosphere due to increase in GHG’s concentration.
The oceans absorb almost a third of the carbon dioxide we release into the
atmosphere every year and this is changing the chemistry of the sea in ways we are
just beginning to understand. This process is called ocean acidification. The acidity
of the ocean has increased 30% since the beginning of the Industrial Revolution, a
rate faster than anything previously experienced over the last 55 million years of
Earth's history.
Report by (NOAA) National Oceanic and Atmospheric Administration
International Program the State of the Ocean (IPSO)
• Effects Numerous plant and animal species in the sea have calcium carbonate skeletons or
shells and some are already being corroded by small changes in acidity.
OZONE DEPLETION:-
When CFCs and HCFCs reach the
stratosphere, the ultraviolet
radiation from the sun causes
them to break apart and release
chlorine atoms which react
with ozone, starting chemical
cycles of ozone destruction that
deplete the ozone layer. One
chlorine atom can break apart
more than 100,000 ozone
molecules.
SOURCE : https://www.eeducation.psu.edu/egee102/book/export/html/1407
WE ARE LARGELY RESPONSIBLE FOR
RECENT CLIMATE CHANGE: -
Over the past century, human
activities have released large amounts
of carbon dioxide and other greenhouse
gases (GHGs) into the atmosphere. The
majority of greenhouse gases come
from burning fossil fuels to produce
energy, although deforestation,
industrial processes, and some
agricultural practices also emit gases
into the atmosphere.
CONTRIBUITION OF CITIES IN GHGs EMISSION:
It has become common for cities to be concept for generating most of the world’s greenhouse
gas emissions. For instance, many sources claim that cities are responsible for 75–80 percent of
global greenhouse gas emissions
Examples of statements that overstate the contribution of cities to
anthropogenic greenhouse gas emissions:-
•“Large cities take up only 2 per cent of the Earth’s land mass, but they are responsible for
about 75 per cent of the heat-trapping greenhouse gases that are released into our
atmosphere” – Clinton Climate Initiative, William J Clinton Foundation
•“Urban areas are responsible for over 75 per cent of all greenhouse gas emissions in the
world” – Greater London Authority press release.
•“By some estimates, urban areas account for 78 per cent of carbon emissions from human
activities”
•“Roughly 78 per cent of carbon emissions from fossil fuel burning and cement
manufacturing and 76 percent of industrial wood use worldwide occur in urban areas”–
O’Meara, Molly (1999),
•“Cities consume 75 per cent of the world’s energy and produce 80 per cent of its
greenhouse gases” Mayor Michael Bloomberg delivers Keynote Address at the C40 Large
Cities Climate Summit, May 2007.
•“… the experts say they (cities) generate 75 per cent of the greenhouse gases
contributing to climate change” – attributed to Daniel Schrag, Director of
Harvard’s Center for the Environment.
•“….cities were responsible for 75 per cent of global energy consumption and
80 percent of greenhouse gas emissions” – Anna Kajumulo Tibaijuka, Executive
Director of the United Nations Human Settlements Programme (UN–HABITAT), in
a speech to the United Nations, 62nd General Assembly, Second Committee
•“Cities have a central role to play in tackling climate change as they are
responsible for 80 percent of international greenhouse gas emissions and
consume 75 per cent of the world’s energy” – Mayor of London website,
•“… the experts say they (cities) generate 75 per cent of the greenhouse gases
contributing to climate change” – attributed to Daniel Schrag, Director of
Harvard’s Center for the Environment
ALLOCATION OF GREENHOUSE GAS EMISSIONS TO THE PRODUCERS OR THE
CONSUMERS:
•Many large fossil fuel power stations are not located in cities – yet these are a very
significant contributor to total carbon dioxide emissions.
•Transport-generated carbon dioxide emissions (from motorcycles, automobiles,
commercial vehicles, sea freight, air travel) cannot be only assigned to cities .
•A higher proportion of greenhouse gas emissions should be assigned to cities if
emissions are assigned to the locations of persons who are the final consumers of
products or services.
•The carbon dioxide emissions from fossil fuel power stations would be assigned to
the activity and location where the electricity was consumed
•For wealthy cities where most industrial goods are imported.
Global CO2 Budget 2014
GlobalCarbonProject.org posted data for the 2014 Global Carbon Budget on September 21,
2014.
FINDINGS:
In 2013, global CO2 emissions due to fossil fuel use (and cement
production) were 36 gigatonnes (GtCO2); this is 61% higher than 1990 (the
Kyoto Protocol reference year) and 2.3% higher than 2012.
In 2014, global CO2 emissions are projected to increase by an additional
2.5% over the 2013 level.
CO2 emissions were dominated by China (28%), the USA (14%), the EU
(10%), and India (7%)--with growth in all of these states except for a 1.8%
decline in the EU (28 member states).
The 2013 carbon dioxide emissions (fossil fuel and cement production
only) breakdown is: coal (43%), oil (33%), gas (18%), cement (5.5%) and gas
flaring (0.6%).
Emissions from land use change accounts for 8% of total CO2 emissions;
the data suggests an overall decreasing trend in land use change emissions
particularly since 2000.
Year Carbon Emissions
2013 9.9 billion metric tonnes (GtC)
2012 9.7 billion metric tonnes (GtC)
2011 9.47 billion metric tonnes (GtC)
2010 9.19 billion metric tonnes (GtC)
2009 8.74 billion metric tonnes (GtC)
2008 8.77 billion of metric tonnes (GtC)
2007 8.57 billion metric tonnes (GtC)
2006 8.37 billion metric tonnes (GtC)
Data for Global Carbon Emissions
(Fossil fuels, cement, land-use change)
OVER VIEW ON CITIES EMISSION:
•Most cities in low-income nations will have far lower levels of greenhouse
gas emissions per person within their boundaries than cities in high-income
nations, from both a production perspective and a consumption perspective.
•Cities that concentrate wealthy people with high-consumption lifestyles
would probably have greenhouse gas emissions per person that were
thousands of times larger than many small cities in low-income nations.
Reasons for Addressing Climate Change at the City Level :-
•Cities are an organic form of government and often express the aspirations of their citizens
more succinctly and quicker than higher levels of government.
•Economic hub.
•In the United States, for example, 1,017 cities have signed on to meet or exceed Kyoto Protocol
targets to reduce greenhouse gas emissions (US Conference of Mayors 2008).
How Cities Affect Climate Change:-
Economic growth and urbanization move in tandem, as economic growth and
greenhouse gas emissions have for at least the last 100 years. The world is urbanizing quickly
and under the business-as-usual scenario, greenhouse gas emissions will also increase
dramatically.
Urban population is expected to double by 2030; however the global
built-up area is expected to triple during the same period
(Figure A) SOURCE: UNITED NATIONS 2007
(Figure B) Source: UN, Department of Economic & Social Affairs, Population Division.
(Figure 3)NOTE: Values in
bold are peer-reviewed
and considered
comparable. Inventory
year, source, and content
are indicated in Annex B.
All per capita national
emissions are calculated
from national inventories
submitted under the
UNFCCC and exclude
LULUCF; national
population figures are
from the World
Development Indicators,
World Bank data, and
correspond to the
inventory year.
Measuring City Emissions and their Impact:-
City greenhouse gas emissions reflect the structure of a city, its energy
sources, and its residents’ lifestyles. Resource use, water consumption,
wastewater production, toxic releases, and solid waste generation are
all linked among themselves and with greenhouse gas emissions as
well.
Defining city emissions scope and boundaries:-
The IPCC has issued guidelines to calculate national greenhouse gas
emissions that include all emissions produced within the boundaries of
a given country.
Source: Waste data from World Bank, “What a Waste” 2010; GHG data from Table C.
THE CHALLENGE:-
ENVIRONMENTAL CHALLENGES:-
Greenhouse gases emission that cause global warming comes from urban areas
unequally distributed among cities
The cities in developed countries emit more than 6 times as much carbon dioxide per capita
than the citizen of under developing world.
their impacts are disproportionally distributed the effects of climate change surf to remind us
that we are part of ecologically interdependent Human community.
DEFORESTATION:-
Interdependent worlds we cannot continue to destroy our forests at such an alarming rate this
have not only direct effects on the climate but it also leads to loss of Biodiversity. All over the
world forest has been cut down to make the land for farming, towns and cities. The biggest
tropical rain forest in the wild is Amazon in South America the huge part of forest is cut down
every year to use land for agriculture and there remaining part of Amazon is at the risk of drying.
As we know, Carbon dioxide is greenhouse, lots of
worlds carbon dioxide is absorbed by plants and
trees to make food during Photosynthesis, by
keeping lock carbon dioxide in there structure
instead into atmosphere
SOME STEPS FOR LOWERING CITIES’S GREENHOUSE GASES EMISSIONS:
In the search for the best ways to reduce total anthropogenic greenhouse
gas emissions a focus both on the producers and the consumers.
Greenhouse gas emissions from deforestation can be reduced at the production
end by better forest management and by consumption habits that reduce demand
for wood or that use wood products that are certified as having come from forests
that are sustainably managed.
There are also many ways in which both food producers and food consumers can
contribute to lower greenhouse gas emissions.
Greenhouse gas emissions from the fabrication of consumer goods are more easily
reduced at the production end, although information on the goods’ carbon footprint
(and, for appliances that use energy, their efficiency) can encourage consumer
choices that reduce emissions. For electricity generation, action is needed at the
production end (for instance, shifts away from fossil fuels, especially coal, unless
carbon capture can be achieved and applied)
The consumption end (minimizing electricity use, perhaps incorporating some
electricity generation at the consumption end through the use of photovoltaic cells,
and choices made to draw electricity from non-fossil fuel sources).
**We need to ask to our selves!
How can our cities once more replace,
where pure air clean water and unpolluted land**

Más contenido relacionado

La actualidad más candente

Climate change & its impact on our water resources_ Schools India Water Porta...
Climate change & its impact on our water resources_ Schools India Water Porta...Climate change & its impact on our water resources_ Schools India Water Porta...
Climate change & its impact on our water resources_ Schools India Water Porta...India Water Portal
 
Climate change and vulnerability assessment in agriculture
Climate change and vulnerability assessment in agricultureClimate change and vulnerability assessment in agriculture
Climate change and vulnerability assessment in agricultureDr. Rupan Raghuvanshi
 
Introduction to Climate Change
Introduction to Climate ChangeIntroduction to Climate Change
Introduction to Climate ChangeIra Tobing
 
Vulnerability and Impact Assessment climate change
Vulnerability and Impact Assessment   climate changeVulnerability and Impact Assessment   climate change
Vulnerability and Impact Assessment climate changeSai Bhaskar Reddy Nakka
 
Global Climate Change and its impact on human health
Global Climate Change and its impact on human healthGlobal Climate Change and its impact on human health
Global Climate Change and its impact on human healthProf. A.Balasubramanian
 
Negative impact of global climate change
Negative impact of global climate changeNegative impact of global climate change
Negative impact of global climate changeDiNa Kong
 
Lecture-4 Climate Change Effect and Strategic Initiatives of Bangladesh
Lecture-4 Climate Change Effect and Strategic Initiatives of BangladeshLecture-4 Climate Change Effect and Strategic Initiatives of Bangladesh
Lecture-4 Climate Change Effect and Strategic Initiatives of BangladeshShankor Paul
 
Urban environmental degradation
Urban environmental degradationUrban environmental degradation
Urban environmental degradationCarla duncan
 
The Sixth Assessment Report
The Sixth Assessment ReportThe Sixth Assessment Report
The Sixth Assessment Reportipcc-media
 
Theme 4 - Climate Change Mitigation and Adaptation
Theme 4 - Climate Change Mitigation and AdaptationTheme 4 - Climate Change Mitigation and Adaptation
Theme 4 - Climate Change Mitigation and AdaptationCIFOR-ICRAF
 
Recent Advanced on Climate change and Human Health
Recent Advanced on Climate change and Human Health Recent Advanced on Climate change and Human Health
Recent Advanced on Climate change and Human Health RAVIKANTAMISHRA
 
A Brief History of Climate Change
A Brief History of Climate Change A Brief History of Climate Change
A Brief History of Climate Change John Slifko, Ph.D
 
Impacts, Adaptation, and Vulnerability
Impacts, Adaptation, and VulnerabilityImpacts, Adaptation, and Vulnerability
Impacts, Adaptation, and Vulnerabilityipcc-media
 
Global warming-and-climate-change
Global warming-and-climate-changeGlobal warming-and-climate-change
Global warming-and-climate-changearnob293
 
Lesson 7 Basis for projection of climate change
Lesson 7   Basis for projection of climate changeLesson 7   Basis for projection of climate change
Lesson 7 Basis for projection of climate changeDr. P.B.Dharmasena
 

La actualidad más candente (20)

Climate change & its impact on our water resources_ Schools India Water Porta...
Climate change & its impact on our water resources_ Schools India Water Porta...Climate change & its impact on our water resources_ Schools India Water Porta...
Climate change & its impact on our water resources_ Schools India Water Porta...
 
Climate change and vulnerability assessment in agriculture
Climate change and vulnerability assessment in agricultureClimate change and vulnerability assessment in agriculture
Climate change and vulnerability assessment in agriculture
 
Introduction to Climate Change
Introduction to Climate ChangeIntroduction to Climate Change
Introduction to Climate Change
 
Vulnerability and Impact Assessment climate change
Vulnerability and Impact Assessment   climate changeVulnerability and Impact Assessment   climate change
Vulnerability and Impact Assessment climate change
 
Global Climate Change and its impact on human health
Global Climate Change and its impact on human healthGlobal Climate Change and its impact on human health
Global Climate Change and its impact on human health
 
Negative impact of global climate change
Negative impact of global climate changeNegative impact of global climate change
Negative impact of global climate change
 
Lecture-4 Climate Change Effect and Strategic Initiatives of Bangladesh
Lecture-4 Climate Change Effect and Strategic Initiatives of BangladeshLecture-4 Climate Change Effect and Strategic Initiatives of Bangladesh
Lecture-4 Climate Change Effect and Strategic Initiatives of Bangladesh
 
Urban environmental degradation
Urban environmental degradationUrban environmental degradation
Urban environmental degradation
 
The Sixth Assessment Report
The Sixth Assessment ReportThe Sixth Assessment Report
The Sixth Assessment Report
 
Theme 4 - Climate Change Mitigation and Adaptation
Theme 4 - Climate Change Mitigation and AdaptationTheme 4 - Climate Change Mitigation and Adaptation
Theme 4 - Climate Change Mitigation and Adaptation
 
Recent Advanced on Climate change and Human Health
Recent Advanced on Climate change and Human Health Recent Advanced on Climate change and Human Health
Recent Advanced on Climate change and Human Health
 
Climate Change UNFCCC
Climate Change UNFCCCClimate Change UNFCCC
Climate Change UNFCCC
 
Sustainable development
Sustainable developmentSustainable development
Sustainable development
 
A Brief History of Climate Change
A Brief History of Climate Change A Brief History of Climate Change
A Brief History of Climate Change
 
Impacts, Adaptation, and Vulnerability
Impacts, Adaptation, and VulnerabilityImpacts, Adaptation, and Vulnerability
Impacts, Adaptation, and Vulnerability
 
Global warming-and-climate-change
Global warming-and-climate-changeGlobal warming-and-climate-change
Global warming-and-climate-change
 
Lesson 7 Basis for projection of climate change
Lesson 7   Basis for projection of climate changeLesson 7   Basis for projection of climate change
Lesson 7 Basis for projection of climate change
 
Population and environment
Population and environmentPopulation and environment
Population and environment
 
IPCC AR6 Climate Change 2023 report
IPCC AR6 Climate Change 2023 reportIPCC AR6 Climate Change 2023 report
IPCC AR6 Climate Change 2023 report
 
Climate change awareness to communities
Climate change awareness to communitiesClimate change awareness to communities
Climate change awareness to communities
 

Similar a contribution of cities on Climate change ppt

Milwaukee Area Technical College Presentation - 2015 Green Vehicles Workshop ...
Milwaukee Area Technical College Presentation - 2015 Green Vehicles Workshop ...Milwaukee Area Technical College Presentation - 2015 Green Vehicles Workshop ...
Milwaukee Area Technical College Presentation - 2015 Green Vehicles Workshop ...Wisconsin Clean Cities
 
Mitigation under climate change.
Mitigation under climate change.Mitigation under climate change.
Mitigation under climate change.Md.Monir Hosen
 
Global warming and water resource
Global warming and water resourceGlobal warming and water resource
Global warming and water resourceAhmed Marei
 
Controlling global warming through land use planning
Controlling global warming through land use planningControlling global warming through land use planning
Controlling global warming through land use planningTareq Zarouni
 
A briefing from the Poznan Climate Change Conference
A briefing from the Poznan Climate Change ConferenceA briefing from the Poznan Climate Change Conference
A briefing from the Poznan Climate Change ConferenceLeonardo ENERGY
 
Environment and climate trends (co2)
Environment  and  climate  trends (co2)Environment  and  climate  trends (co2)
Environment and climate trends (co2)DocumentStory
 
Hybrid vehicles mini project-Sivajash Sayad
Hybrid vehicles mini project-Sivajash SayadHybrid vehicles mini project-Sivajash Sayad
Hybrid vehicles mini project-Sivajash SayadSiawash sayad
 
koyoto protocol and copenhagen summit
koyoto protocol and copenhagen summit koyoto protocol and copenhagen summit
koyoto protocol and copenhagen summit Azad Khan
 
Wdr2010 Graphics Ch0 Overview[1]
Wdr2010 Graphics Ch0 Overview[1]Wdr2010 Graphics Ch0 Overview[1]
Wdr2010 Graphics Ch0 Overview[1]wringobanker
 
Wgiar5presentation1403
Wgiar5presentation1403Wgiar5presentation1403
Wgiar5presentation1403Nicolás Stern
 
TOO4TO Module 3 / Climate Change and Sustainability: Part 1
TOO4TO Module 3 / Climate Change and Sustainability: Part 1TOO4TO Module 3 / Climate Change and Sustainability: Part 1
TOO4TO Module 3 / Climate Change and Sustainability: Part 1TOO4TO
 
Sustainabiity_Article_write_up
Sustainabiity_Article_write_upSustainabiity_Article_write_up
Sustainabiity_Article_write_upAnindita Moitra
 
Global Environmental Issues- Challenges in Cities
Global Environmental Issues- Challenges in CitiesGlobal Environmental Issues- Challenges in Cities
Global Environmental Issues- Challenges in CitiesNeha Bansal
 

Similar a contribution of cities on Climate change ppt (20)

Milwaukee Area Technical College Presentation - 2015 Green Vehicles Workshop ...
Milwaukee Area Technical College Presentation - 2015 Green Vehicles Workshop ...Milwaukee Area Technical College Presentation - 2015 Green Vehicles Workshop ...
Milwaukee Area Technical College Presentation - 2015 Green Vehicles Workshop ...
 
Mitigation under climate change.
Mitigation under climate change.Mitigation under climate change.
Mitigation under climate change.
 
Global warming and water resource
Global warming and water resourceGlobal warming and water resource
Global warming and water resource
 
Controlling global warming through land use planning
Controlling global warming through land use planningControlling global warming through land use planning
Controlling global warming through land use planning
 
A briefing from the Poznan Climate Change Conference
A briefing from the Poznan Climate Change ConferenceA briefing from the Poznan Climate Change Conference
A briefing from the Poznan Climate Change Conference
 
Environment and climate trends (co2)
Environment  and  climate  trends (co2)Environment  and  climate  trends (co2)
Environment and climate trends (co2)
 
Copenhagen Climate Summit
Copenhagen Climate SummitCopenhagen Climate Summit
Copenhagen Climate Summit
 
Hybrid vehicles mini project-Sivajash Sayad
Hybrid vehicles mini project-Sivajash SayadHybrid vehicles mini project-Sivajash Sayad
Hybrid vehicles mini project-Sivajash Sayad
 
koyoto protocol and copenhagen summit
koyoto protocol and copenhagen summit koyoto protocol and copenhagen summit
koyoto protocol and copenhagen summit
 
Wdr2010 Graphics Ch0 Overview[1]
Wdr2010 Graphics Ch0 Overview[1]Wdr2010 Graphics Ch0 Overview[1]
Wdr2010 Graphics Ch0 Overview[1]
 
Wgiar5presentation1403
Wgiar5presentation1403Wgiar5presentation1403
Wgiar5presentation1403
 
Climate Change 2013 : The Physical Science Basis
Climate Change 2013 : The Physical Science BasisClimate Change 2013 : The Physical Science Basis
Climate Change 2013 : The Physical Science Basis
 
TOO4TO Module 3 / Climate Change and Sustainability: Part 1
TOO4TO Module 3 / Climate Change and Sustainability: Part 1TOO4TO Module 3 / Climate Change and Sustainability: Part 1
TOO4TO Module 3 / Climate Change and Sustainability: Part 1
 
Bcfr April 20 2010
Bcfr April 20 2010Bcfr April 20 2010
Bcfr April 20 2010
 
development notes
development notesdevelopment notes
development notes
 
Change in climate
Change in climateChange in climate
Change in climate
 
Climate change #scichallenge2017
Climate change #scichallenge2017Climate change #scichallenge2017
Climate change #scichallenge2017
 
Sustainabiity_Article_write_up
Sustainabiity_Article_write_upSustainabiity_Article_write_up
Sustainabiity_Article_write_up
 
Climate Change Essay Topics
Climate Change Essay TopicsClimate Change Essay Topics
Climate Change Essay Topics
 
Global Environmental Issues- Challenges in Cities
Global Environmental Issues- Challenges in CitiesGlobal Environmental Issues- Challenges in Cities
Global Environmental Issues- Challenges in Cities
 

Último

Call Girls Service Pune ₹7.5k Pick Up & Drop With Cash Payment 8005736733 Cal...
Call Girls Service Pune ₹7.5k Pick Up & Drop With Cash Payment 8005736733 Cal...Call Girls Service Pune ₹7.5k Pick Up & Drop With Cash Payment 8005736733 Cal...
Call Girls Service Pune ₹7.5k Pick Up & Drop With Cash Payment 8005736733 Cal...SUHANI PANDEY
 
Call Girls Talegaon Dabhade Call Me 7737669865 Budget Friendly No Advance Boo...
Call Girls Talegaon Dabhade Call Me 7737669865 Budget Friendly No Advance Boo...Call Girls Talegaon Dabhade Call Me 7737669865 Budget Friendly No Advance Boo...
Call Girls Talegaon Dabhade Call Me 7737669865 Budget Friendly No Advance Boo...roncy bisnoi
 
Proposed Amendments to Chapter 15, Article X: Wetland Conservation Areas
Proposed Amendments to Chapter 15, Article X: Wetland Conservation AreasProposed Amendments to Chapter 15, Article X: Wetland Conservation Areas
Proposed Amendments to Chapter 15, Article X: Wetland Conservation Areas💥Victoria K. Colangelo
 
Alandi Road ( Call Girls ) Pune 6297143586 Hot Model With Sexy Bhabi Ready ...
Alandi Road ( Call Girls ) Pune  6297143586  Hot Model With Sexy Bhabi Ready ...Alandi Road ( Call Girls ) Pune  6297143586  Hot Model With Sexy Bhabi Ready ...
Alandi Road ( Call Girls ) Pune 6297143586 Hot Model With Sexy Bhabi Ready ...tanu pandey
 
VIP Model Call Girls Hadapsar ( Pune ) Call ON 8005736733 Starting From 5K to...
VIP Model Call Girls Hadapsar ( Pune ) Call ON 8005736733 Starting From 5K to...VIP Model Call Girls Hadapsar ( Pune ) Call ON 8005736733 Starting From 5K to...
VIP Model Call Girls Hadapsar ( Pune ) Call ON 8005736733 Starting From 5K to...SUHANI PANDEY
 
VIP Model Call Girls Chakan ( Pune ) Call ON 8005736733 Starting From 5K to 2...
VIP Model Call Girls Chakan ( Pune ) Call ON 8005736733 Starting From 5K to 2...VIP Model Call Girls Chakan ( Pune ) Call ON 8005736733 Starting From 5K to 2...
VIP Model Call Girls Chakan ( Pune ) Call ON 8005736733 Starting From 5K to 2...SUHANI PANDEY
 
VIP Model Call Girls Charholi Budruk ( Pune ) Call ON 8005736733 Starting Fro...
VIP Model Call Girls Charholi Budruk ( Pune ) Call ON 8005736733 Starting Fro...VIP Model Call Girls Charholi Budruk ( Pune ) Call ON 8005736733 Starting Fro...
VIP Model Call Girls Charholi Budruk ( Pune ) Call ON 8005736733 Starting Fro...SUHANI PANDEY
 
VVIP Pune Call Girls Vishal Nagar WhatSapp Number 8005736733 With Elite Staff...
VVIP Pune Call Girls Vishal Nagar WhatSapp Number 8005736733 With Elite Staff...VVIP Pune Call Girls Vishal Nagar WhatSapp Number 8005736733 With Elite Staff...
VVIP Pune Call Girls Vishal Nagar WhatSapp Number 8005736733 With Elite Staff...SUHANI PANDEY
 
VIP Model Call Girls Uruli Kanchan ( Pune ) Call ON 8005736733 Starting From ...
VIP Model Call Girls Uruli Kanchan ( Pune ) Call ON 8005736733 Starting From ...VIP Model Call Girls Uruli Kanchan ( Pune ) Call ON 8005736733 Starting From ...
VIP Model Call Girls Uruli Kanchan ( Pune ) Call ON 8005736733 Starting From ...SUHANI PANDEY
 
Book Sex Workers Available Pune Call Girls Kondhwa 6297143586 Call Hot India...
Book Sex Workers Available Pune Call Girls Kondhwa  6297143586 Call Hot India...Book Sex Workers Available Pune Call Girls Kondhwa  6297143586 Call Hot India...
Book Sex Workers Available Pune Call Girls Kondhwa 6297143586 Call Hot India...Call Girls in Nagpur High Profile
 
Sector 18, Noida Call girls :8448380779 Model Escorts | 100% verified
Sector 18, Noida Call girls :8448380779 Model Escorts | 100% verifiedSector 18, Noida Call girls :8448380779 Model Escorts | 100% verified
Sector 18, Noida Call girls :8448380779 Model Escorts | 100% verifiedDelhi Call girls
 
RA 7942:vThe Philippine Mining Act of 1995
RA 7942:vThe Philippine Mining Act of 1995RA 7942:vThe Philippine Mining Act of 1995
RA 7942:vThe Philippine Mining Act of 1995garthraymundo123
 
Booking open Available Pune Call Girls Budhwar Peth 6297143586 Call Hot Indi...
Booking open Available Pune Call Girls Budhwar Peth  6297143586 Call Hot Indi...Booking open Available Pune Call Girls Budhwar Peth  6297143586 Call Hot Indi...
Booking open Available Pune Call Girls Budhwar Peth 6297143586 Call Hot Indi...Call Girls in Nagpur High Profile
 
VIP Call Girls Valsad 7001035870 Whatsapp Number, 24/07 Booking
VIP Call Girls Valsad 7001035870 Whatsapp Number, 24/07 BookingVIP Call Girls Valsad 7001035870 Whatsapp Number, 24/07 Booking
VIP Call Girls Valsad 7001035870 Whatsapp Number, 24/07 Bookingdharasingh5698
 
GENUINE Babe,Call Girls IN Chhatarpur Delhi | +91-8377877756
GENUINE Babe,Call Girls IN Chhatarpur Delhi | +91-8377877756GENUINE Babe,Call Girls IN Chhatarpur Delhi | +91-8377877756
GENUINE Babe,Call Girls IN Chhatarpur Delhi | +91-8377877756dollysharma2066
 
VIP Model Call Girls Wagholi ( Pune ) Call ON 8005736733 Starting From 5K to ...
VIP Model Call Girls Wagholi ( Pune ) Call ON 8005736733 Starting From 5K to ...VIP Model Call Girls Wagholi ( Pune ) Call ON 8005736733 Starting From 5K to ...
VIP Model Call Girls Wagholi ( Pune ) Call ON 8005736733 Starting From 5K to ...SUHANI PANDEY
 
Call Girls in Sakinaka Agency, { 9892124323 } Mumbai Vashi Call Girls Serivce...
Call Girls in Sakinaka Agency, { 9892124323 } Mumbai Vashi Call Girls Serivce...Call Girls in Sakinaka Agency, { 9892124323 } Mumbai Vashi Call Girls Serivce...
Call Girls in Sakinaka Agency, { 9892124323 } Mumbai Vashi Call Girls Serivce...Pooja Nehwal
 
Environmental Science - Nuclear Hazards and Us.pptx
Environmental Science - Nuclear Hazards and Us.pptxEnvironmental Science - Nuclear Hazards and Us.pptx
Environmental Science - Nuclear Hazards and Us.pptxhossanmdjobayer103
 

Último (20)

Call Girls Service Pune ₹7.5k Pick Up & Drop With Cash Payment 8005736733 Cal...
Call Girls Service Pune ₹7.5k Pick Up & Drop With Cash Payment 8005736733 Cal...Call Girls Service Pune ₹7.5k Pick Up & Drop With Cash Payment 8005736733 Cal...
Call Girls Service Pune ₹7.5k Pick Up & Drop With Cash Payment 8005736733 Cal...
 
Call Girls Talegaon Dabhade Call Me 7737669865 Budget Friendly No Advance Boo...
Call Girls Talegaon Dabhade Call Me 7737669865 Budget Friendly No Advance Boo...Call Girls Talegaon Dabhade Call Me 7737669865 Budget Friendly No Advance Boo...
Call Girls Talegaon Dabhade Call Me 7737669865 Budget Friendly No Advance Boo...
 
Proposed Amendments to Chapter 15, Article X: Wetland Conservation Areas
Proposed Amendments to Chapter 15, Article X: Wetland Conservation AreasProposed Amendments to Chapter 15, Article X: Wetland Conservation Areas
Proposed Amendments to Chapter 15, Article X: Wetland Conservation Areas
 
Alandi Road ( Call Girls ) Pune 6297143586 Hot Model With Sexy Bhabi Ready ...
Alandi Road ( Call Girls ) Pune  6297143586  Hot Model With Sexy Bhabi Ready ...Alandi Road ( Call Girls ) Pune  6297143586  Hot Model With Sexy Bhabi Ready ...
Alandi Road ( Call Girls ) Pune 6297143586 Hot Model With Sexy Bhabi Ready ...
 
VIP Model Call Girls Hadapsar ( Pune ) Call ON 8005736733 Starting From 5K to...
VIP Model Call Girls Hadapsar ( Pune ) Call ON 8005736733 Starting From 5K to...VIP Model Call Girls Hadapsar ( Pune ) Call ON 8005736733 Starting From 5K to...
VIP Model Call Girls Hadapsar ( Pune ) Call ON 8005736733 Starting From 5K to...
 
VIP Model Call Girls Chakan ( Pune ) Call ON 8005736733 Starting From 5K to 2...
VIP Model Call Girls Chakan ( Pune ) Call ON 8005736733 Starting From 5K to 2...VIP Model Call Girls Chakan ( Pune ) Call ON 8005736733 Starting From 5K to 2...
VIP Model Call Girls Chakan ( Pune ) Call ON 8005736733 Starting From 5K to 2...
 
VIP Model Call Girls Charholi Budruk ( Pune ) Call ON 8005736733 Starting Fro...
VIP Model Call Girls Charholi Budruk ( Pune ) Call ON 8005736733 Starting Fro...VIP Model Call Girls Charholi Budruk ( Pune ) Call ON 8005736733 Starting Fro...
VIP Model Call Girls Charholi Budruk ( Pune ) Call ON 8005736733 Starting Fro...
 
Climate Change
Climate ChangeClimate Change
Climate Change
 
VVIP Pune Call Girls Vishal Nagar WhatSapp Number 8005736733 With Elite Staff...
VVIP Pune Call Girls Vishal Nagar WhatSapp Number 8005736733 With Elite Staff...VVIP Pune Call Girls Vishal Nagar WhatSapp Number 8005736733 With Elite Staff...
VVIP Pune Call Girls Vishal Nagar WhatSapp Number 8005736733 With Elite Staff...
 
VIP Model Call Girls Uruli Kanchan ( Pune ) Call ON 8005736733 Starting From ...
VIP Model Call Girls Uruli Kanchan ( Pune ) Call ON 8005736733 Starting From ...VIP Model Call Girls Uruli Kanchan ( Pune ) Call ON 8005736733 Starting From ...
VIP Model Call Girls Uruli Kanchan ( Pune ) Call ON 8005736733 Starting From ...
 
Book Sex Workers Available Pune Call Girls Kondhwa 6297143586 Call Hot India...
Book Sex Workers Available Pune Call Girls Kondhwa  6297143586 Call Hot India...Book Sex Workers Available Pune Call Girls Kondhwa  6297143586 Call Hot India...
Book Sex Workers Available Pune Call Girls Kondhwa 6297143586 Call Hot India...
 
Sector 18, Noida Call girls :8448380779 Model Escorts | 100% verified
Sector 18, Noida Call girls :8448380779 Model Escorts | 100% verifiedSector 18, Noida Call girls :8448380779 Model Escorts | 100% verified
Sector 18, Noida Call girls :8448380779 Model Escorts | 100% verified
 
RA 7942:vThe Philippine Mining Act of 1995
RA 7942:vThe Philippine Mining Act of 1995RA 7942:vThe Philippine Mining Act of 1995
RA 7942:vThe Philippine Mining Act of 1995
 
Booking open Available Pune Call Girls Budhwar Peth 6297143586 Call Hot Indi...
Booking open Available Pune Call Girls Budhwar Peth  6297143586 Call Hot Indi...Booking open Available Pune Call Girls Budhwar Peth  6297143586 Call Hot Indi...
Booking open Available Pune Call Girls Budhwar Peth 6297143586 Call Hot Indi...
 
VIP Call Girls Valsad 7001035870 Whatsapp Number, 24/07 Booking
VIP Call Girls Valsad 7001035870 Whatsapp Number, 24/07 BookingVIP Call Girls Valsad 7001035870 Whatsapp Number, 24/07 Booking
VIP Call Girls Valsad 7001035870 Whatsapp Number, 24/07 Booking
 
GENUINE Babe,Call Girls IN Chhatarpur Delhi | +91-8377877756
GENUINE Babe,Call Girls IN Chhatarpur Delhi | +91-8377877756GENUINE Babe,Call Girls IN Chhatarpur Delhi | +91-8377877756
GENUINE Babe,Call Girls IN Chhatarpur Delhi | +91-8377877756
 
VIP Model Call Girls Wagholi ( Pune ) Call ON 8005736733 Starting From 5K to ...
VIP Model Call Girls Wagholi ( Pune ) Call ON 8005736733 Starting From 5K to ...VIP Model Call Girls Wagholi ( Pune ) Call ON 8005736733 Starting From 5K to ...
VIP Model Call Girls Wagholi ( Pune ) Call ON 8005736733 Starting From 5K to ...
 
(NEHA) Call Girls Navi Mumbai Call Now 8250077686 Navi Mumbai Escorts 24x7
(NEHA) Call Girls Navi Mumbai Call Now 8250077686 Navi Mumbai Escorts 24x7(NEHA) Call Girls Navi Mumbai Call Now 8250077686 Navi Mumbai Escorts 24x7
(NEHA) Call Girls Navi Mumbai Call Now 8250077686 Navi Mumbai Escorts 24x7
 
Call Girls in Sakinaka Agency, { 9892124323 } Mumbai Vashi Call Girls Serivce...
Call Girls in Sakinaka Agency, { 9892124323 } Mumbai Vashi Call Girls Serivce...Call Girls in Sakinaka Agency, { 9892124323 } Mumbai Vashi Call Girls Serivce...
Call Girls in Sakinaka Agency, { 9892124323 } Mumbai Vashi Call Girls Serivce...
 
Environmental Science - Nuclear Hazards and Us.pptx
Environmental Science - Nuclear Hazards and Us.pptxEnvironmental Science - Nuclear Hazards and Us.pptx
Environmental Science - Nuclear Hazards and Us.pptx
 

contribution of cities on Climate change ppt

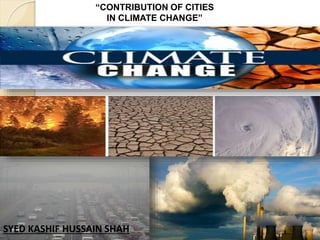
  • 1. “CONTRIBUTION OF CITIES IN CLIMATE CHANGE” SYED KASHIF HUSSAIN SHAH
  • 2. What is climate change? A change in global or regional climate patterns, change apparent from the mid to late 20th century onwards and attributed largely to the increased levels of atmospheric carbon dioxide produced by the use of fossil fuels. Earth's average temperature has risen by 1.4°F over the past century, and is projected to rise another 2 to 11.5°F over the next hundred years. Figure Instrumental record of global average temperatures as compiled by National Aeronautics and Space Administration (NASA).
  • 3. THE CLEAR EVIDENCE Rising global temperatures have been accompanied by changes in weather and climate. Many places have seen changes in rainfall, resulting in more floods, droughts, or intense rain, as well as more frequent and severe heat waves. The oceans and glaciers have also experienced some big changes oceans are warming and becoming more acidic, ice caps are melting, and sea levels are rising. Source of graph: Wikipedia - Image created by Robert A. Rohde / Global Warming Art, based on data from Permanent Service for Mean Sea Level (PSMSL), Douglas (1997).
  • 4. Greenhouse gases act like a blanket around Earth: INFORMATION ABOUT GREENHOUSE GASES (GHGs):- Many GHGs, including water vapor (the most important), ozone, carbon dioxide, methane, and nitrous oxide, are naturally present in the atmosphere. Other GHGs are synthetic chemicals that are emitted only as a result of human activity. Anthropogenic (human) activities are significantly increasing atmospheric concentrations of many GHGs.  Carbon dioxide (CO2) Methane (CH4) Nitrous oxide (N2O) Hydro fluorocarbons (HFCs) and per fluorocarbons (PFCs)
  • 5. Disturbance in Atmosphere due to increase in GHG’s concentration.
  • 6.
  • 7. The oceans absorb almost a third of the carbon dioxide we release into the atmosphere every year and this is changing the chemistry of the sea in ways we are just beginning to understand. This process is called ocean acidification. The acidity of the ocean has increased 30% since the beginning of the Industrial Revolution, a rate faster than anything previously experienced over the last 55 million years of Earth's history. Report by (NOAA) National Oceanic and Atmospheric Administration International Program the State of the Ocean (IPSO) • Effects Numerous plant and animal species in the sea have calcium carbonate skeletons or shells and some are already being corroded by small changes in acidity.
  • 8. OZONE DEPLETION:- When CFCs and HCFCs reach the stratosphere, the ultraviolet radiation from the sun causes them to break apart and release chlorine atoms which react with ozone, starting chemical cycles of ozone destruction that deplete the ozone layer. One chlorine atom can break apart more than 100,000 ozone molecules.
  • 10. WE ARE LARGELY RESPONSIBLE FOR RECENT CLIMATE CHANGE: - Over the past century, human activities have released large amounts of carbon dioxide and other greenhouse gases (GHGs) into the atmosphere. The majority of greenhouse gases come from burning fossil fuels to produce energy, although deforestation, industrial processes, and some agricultural practices also emit gases into the atmosphere.
  • 11. CONTRIBUITION OF CITIES IN GHGs EMISSION: It has become common for cities to be concept for generating most of the world’s greenhouse gas emissions. For instance, many sources claim that cities are responsible for 75–80 percent of global greenhouse gas emissions Examples of statements that overstate the contribution of cities to anthropogenic greenhouse gas emissions:- •“Large cities take up only 2 per cent of the Earth’s land mass, but they are responsible for about 75 per cent of the heat-trapping greenhouse gases that are released into our atmosphere” – Clinton Climate Initiative, William J Clinton Foundation •“Urban areas are responsible for over 75 per cent of all greenhouse gas emissions in the world” – Greater London Authority press release. •“By some estimates, urban areas account for 78 per cent of carbon emissions from human activities” •“Roughly 78 per cent of carbon emissions from fossil fuel burning and cement manufacturing and 76 percent of industrial wood use worldwide occur in urban areas”– O’Meara, Molly (1999), •“Cities consume 75 per cent of the world’s energy and produce 80 per cent of its greenhouse gases” Mayor Michael Bloomberg delivers Keynote Address at the C40 Large Cities Climate Summit, May 2007.
  • 12. •“… the experts say they (cities) generate 75 per cent of the greenhouse gases contributing to climate change” – attributed to Daniel Schrag, Director of Harvard’s Center for the Environment. •“….cities were responsible for 75 per cent of global energy consumption and 80 percent of greenhouse gas emissions” – Anna Kajumulo Tibaijuka, Executive Director of the United Nations Human Settlements Programme (UN–HABITAT), in a speech to the United Nations, 62nd General Assembly, Second Committee •“Cities have a central role to play in tackling climate change as they are responsible for 80 percent of international greenhouse gas emissions and consume 75 per cent of the world’s energy” – Mayor of London website, •“… the experts say they (cities) generate 75 per cent of the greenhouse gases contributing to climate change” – attributed to Daniel Schrag, Director of Harvard’s Center for the Environment
  • 13. ALLOCATION OF GREENHOUSE GAS EMISSIONS TO THE PRODUCERS OR THE CONSUMERS: •Many large fossil fuel power stations are not located in cities – yet these are a very significant contributor to total carbon dioxide emissions. •Transport-generated carbon dioxide emissions (from motorcycles, automobiles, commercial vehicles, sea freight, air travel) cannot be only assigned to cities . •A higher proportion of greenhouse gas emissions should be assigned to cities if emissions are assigned to the locations of persons who are the final consumers of products or services. •The carbon dioxide emissions from fossil fuel power stations would be assigned to the activity and location where the electricity was consumed •For wealthy cities where most industrial goods are imported.
  • 14.
  • 15. Global CO2 Budget 2014 GlobalCarbonProject.org posted data for the 2014 Global Carbon Budget on September 21, 2014. FINDINGS: In 2013, global CO2 emissions due to fossil fuel use (and cement production) were 36 gigatonnes (GtCO2); this is 61% higher than 1990 (the Kyoto Protocol reference year) and 2.3% higher than 2012. In 2014, global CO2 emissions are projected to increase by an additional 2.5% over the 2013 level. CO2 emissions were dominated by China (28%), the USA (14%), the EU (10%), and India (7%)--with growth in all of these states except for a 1.8% decline in the EU (28 member states). The 2013 carbon dioxide emissions (fossil fuel and cement production only) breakdown is: coal (43%), oil (33%), gas (18%), cement (5.5%) and gas flaring (0.6%). Emissions from land use change accounts for 8% of total CO2 emissions; the data suggests an overall decreasing trend in land use change emissions particularly since 2000.
  • 16. Year Carbon Emissions 2013 9.9 billion metric tonnes (GtC) 2012 9.7 billion metric tonnes (GtC) 2011 9.47 billion metric tonnes (GtC) 2010 9.19 billion metric tonnes (GtC) 2009 8.74 billion metric tonnes (GtC) 2008 8.77 billion of metric tonnes (GtC) 2007 8.57 billion metric tonnes (GtC) 2006 8.37 billion metric tonnes (GtC) Data for Global Carbon Emissions (Fossil fuels, cement, land-use change)
  • 17. OVER VIEW ON CITIES EMISSION: •Most cities in low-income nations will have far lower levels of greenhouse gas emissions per person within their boundaries than cities in high-income nations, from both a production perspective and a consumption perspective. •Cities that concentrate wealthy people with high-consumption lifestyles would probably have greenhouse gas emissions per person that were thousands of times larger than many small cities in low-income nations.
  • 18. Reasons for Addressing Climate Change at the City Level :- •Cities are an organic form of government and often express the aspirations of their citizens more succinctly and quicker than higher levels of government. •Economic hub. •In the United States, for example, 1,017 cities have signed on to meet or exceed Kyoto Protocol targets to reduce greenhouse gas emissions (US Conference of Mayors 2008). How Cities Affect Climate Change:- Economic growth and urbanization move in tandem, as economic growth and greenhouse gas emissions have for at least the last 100 years. The world is urbanizing quickly and under the business-as-usual scenario, greenhouse gas emissions will also increase dramatically.
  • 19. Urban population is expected to double by 2030; however the global built-up area is expected to triple during the same period (Figure A) SOURCE: UNITED NATIONS 2007
  • 20. (Figure B) Source: UN, Department of Economic & Social Affairs, Population Division.
  • 21. (Figure 3)NOTE: Values in bold are peer-reviewed and considered comparable. Inventory year, source, and content are indicated in Annex B. All per capita national emissions are calculated from national inventories submitted under the UNFCCC and exclude LULUCF; national population figures are from the World Development Indicators, World Bank data, and correspond to the inventory year.
  • 22. Measuring City Emissions and their Impact:- City greenhouse gas emissions reflect the structure of a city, its energy sources, and its residents’ lifestyles. Resource use, water consumption, wastewater production, toxic releases, and solid waste generation are all linked among themselves and with greenhouse gas emissions as well. Defining city emissions scope and boundaries:- The IPCC has issued guidelines to calculate national greenhouse gas emissions that include all emissions produced within the boundaries of a given country. Source: Waste data from World Bank, “What a Waste” 2010; GHG data from Table C.
  • 23. THE CHALLENGE:- ENVIRONMENTAL CHALLENGES:- Greenhouse gases emission that cause global warming comes from urban areas unequally distributed among cities The cities in developed countries emit more than 6 times as much carbon dioxide per capita than the citizen of under developing world. their impacts are disproportionally distributed the effects of climate change surf to remind us that we are part of ecologically interdependent Human community. DEFORESTATION:- Interdependent worlds we cannot continue to destroy our forests at such an alarming rate this have not only direct effects on the climate but it also leads to loss of Biodiversity. All over the world forest has been cut down to make the land for farming, towns and cities. The biggest tropical rain forest in the wild is Amazon in South America the huge part of forest is cut down every year to use land for agriculture and there remaining part of Amazon is at the risk of drying. As we know, Carbon dioxide is greenhouse, lots of worlds carbon dioxide is absorbed by plants and trees to make food during Photosynthesis, by keeping lock carbon dioxide in there structure instead into atmosphere
  • 24. SOME STEPS FOR LOWERING CITIES’S GREENHOUSE GASES EMISSIONS: In the search for the best ways to reduce total anthropogenic greenhouse gas emissions a focus both on the producers and the consumers. Greenhouse gas emissions from deforestation can be reduced at the production end by better forest management and by consumption habits that reduce demand for wood or that use wood products that are certified as having come from forests that are sustainably managed. There are also many ways in which both food producers and food consumers can contribute to lower greenhouse gas emissions. Greenhouse gas emissions from the fabrication of consumer goods are more easily reduced at the production end, although information on the goods’ carbon footprint (and, for appliances that use energy, their efficiency) can encourage consumer choices that reduce emissions. For electricity generation, action is needed at the production end (for instance, shifts away from fossil fuels, especially coal, unless carbon capture can be achieved and applied) The consumption end (minimizing electricity use, perhaps incorporating some electricity generation at the consumption end through the use of photovoltaic cells, and choices made to draw electricity from non-fossil fuel sources).
  • 25. **We need to ask to our selves! How can our cities once more replace, where pure air clean water and unpolluted land**