SlideShare una empresa de Scribd logo
1 de 1
Descargar para leer sin conexión
Data Mining Coursework B064536
Introduction
Variables
Ranking by
Likelihood to
Redeem
Total
Coupon
Redeemed
Total
Participants
in Category
(Total Coupon
Redeemed/Total
Participant)*100
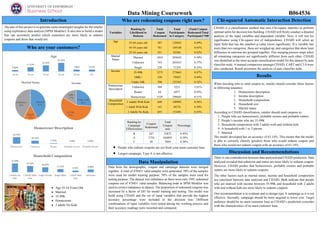
Age 35-44 years old 587 120565 0.49%
45-54 years old 761 169188 0.45%
25-34 years old 351 83584 0.42%
Marital
Status
Married 1010 203642 0.50%
Unknown 743 203455 0.37%
Single 238 71354 0.33%
Income 35-99K 1275 273663 0.47%
100K+ 320 79425 0.40%
Under 34K 396 125363 0.32%
Homeowner
Description
Unknown 304 5232 5.81%
Renter 64 6977 0.92%
Homeowner 1529 298685 0.51%
Household
Composition
2 Adults With Kids 608 108905 0.56%
1 Adult With Kids 141 28276 0.50%
2 Adults No Kids 655 153491 0.43%
Ranking by
Campaign
Effectiveness
Coupon
Redeemed
Total
Coupon
sent
Percentage
B 247 25872 0.95%
A 1724 444895 0.39%
C 20 7684 0.26%
 People who redeem coupons are not from your main customer base
 Largest campaign, Type A is not effective
Data from the demographic, coupon and campaign datasets were merged
together. A total of 478451 valid samples were generated. 50% of the samples
were used for model training purpose. 50% of the samples were used for
testing purpose. The dataset was imbalance as there were only 1991 redeemed
coupons out of 478451 valid samples. Balancing node in SPSS Modeler was
used to correct imbalance in dataset. The proportion of redeemed coupons was
increased by a factor of 245 for model training and testing. The model was
build using CHAID and the set of input variables that provide the highest
accuracy percentage were included in the decision tree. Different
combinations of input variables were tested during the working process and
their accuracy readings were recorded and compared.
CHAID is a classification method that uses Chi-square statistics to perform
optimal splits for decision tree building. CHAID will firstly conduct a detailed
analysis of the input variables and dependent variable. Next, it will test for
significance using Chi-square test of independence. CHAID will select an
input field that has the smallest p-value (most significant). If a variable has
more than two categories, these are weighed up, and categories that show least
difference in outcome are grouped together. This merging process stops when
all remaining categories are significantly different from each other. CHAID
was identified as the most accurate classification model for this dataset by auto
classifier node. A manual comparison amongst CHAID, CART and C5.0 were
also conducted. Result ascertains the analysis of auto classifier node.
When deciding who to send coupon to, retailer should consider these factors
in following sequence:
1. Homeowner description
2. Income description
3. Household composition
4. Household size
5. Marital status
According to CHAID classification, retailer should send coupons to:
1. People who are homeowners, probable owners and probable renters
2. People’s income who are 35-99K
3. Household composition with 2 adults with and without kids
4. A household with 1 to 3 person
5. Married
The model developed has an accuracy of 63.14%. This means that the model
is able to correctly classify (predict) those who would redeem coupon and
those who would not redeem coupon with an accuracy of 63.14%.
5.80%
17.47%
25.20%
35.36%
7.96% 8.21%
19-24 25-34 35-44 45-54 55-64 65+
Age
Married
43%
Single
15%
Unknown
42%
Marital Status
Under 34K
26%
35-99K
57%
100K+
17%
Income
62.43%
29.32%
5.70% 1.46% 1.09%
Homeowner Unknown Renter Probable Owner Probable Renter
Homeowner Description
32.08%
22.76%
18.04%
11.32%
5.91% 9.88%
2 Adults No
Kids
2 Adults With
Kids
Single Female Single Male 1 Adult With
Kids
Unknown
Household Composition
The aim of this project is to generate some meaningful insights for the retailer
using exploratory data analysis (SPSS Modeler). It also aim to build a model
that can accurately predict which customers are more likely to redeem
coupons and those that would not.
Who are your customers?
 Age 45-54 Years Old
 Married
 35-99K
 Homeowner
 2 adults No Kids
Who are redeeming coupons right now?
Data Manipulation
Chi-squared Automatic Interaction Detection
Results
Discussion and Recommendations
There is one contradiction between data analysed and CHAID prediction. Data
analysed revealed that unknown and renter are more likely to redeem coupon.
However, CHAID predict that homeowners, probable owners and probable
renters are more likely to redeem coupons.
The other factors such as marital status, income and household composition
are consistent between data analysed and CHAID. Both indicate that people
who are married with income between 35-99K and household with 2 adults
with and without kids are more likely to redeem coupons.
One recommendation is to evaluate and re-design type A campaign as it is not
effective. Secondly, campaign should be more targeted to lower cost. Target
audience should be its main customer base as CHAID’s prediction coincides
with the characteristics of its main customer base.

Más contenido relacionado

Similar a Data Mining Assignment Final

Compensation Best Practices Panel
Compensation Best Practices PanelCompensation Best Practices Panel
Compensation Best Practices PanelPayScale, Inc.
 
Looking for patterns in the data
Looking for patterns in the dataLooking for patterns in the data
Looking for patterns in the dataRay Poynter
 
Payments Pulse Survey: Small Business Edition
Payments Pulse Survey: Small Business EditionPayments Pulse Survey: Small Business Edition
Payments Pulse Survey: Small Business EditionPayments Canada
 
Business and Data Analytics Collaborative April Meetup
Business and Data Analytics Collaborative April MeetupBusiness and Data Analytics Collaborative April Meetup
Business and Data Analytics Collaborative April MeetupKen Tucker
 
TCS 2021 Global Leadership Study: Key Findings Report
TCS 2021 Global Leadership Study: Key Findings ReportTCS 2021 Global Leadership Study: Key Findings Report
TCS 2021 Global Leadership Study: Key Findings ReportTata Consultancy Services
 
Analysis on the US Consumer Expenditure
Analysis on the US Consumer ExpenditureAnalysis on the US Consumer Expenditure
Analysis on the US Consumer ExpenditureSetu Chokshi
 
5 Tech Megatrends And Their Impact On Medical Technology Marketing FINAL
5 Tech Megatrends And Their Impact On Medical Technology Marketing FINAL5 Tech Megatrends And Their Impact On Medical Technology Marketing FINAL
5 Tech Megatrends And Their Impact On Medical Technology Marketing FINALJoe Morris
 
Generating and Qualifying Inbound SMB Leads
Generating and Qualifying Inbound SMB LeadsGenerating and Qualifying Inbound SMB Leads
Generating and Qualifying Inbound SMB LeadsBredin, Inc.
 
VisualDNA Predictive Analytics
VisualDNA Predictive AnalyticsVisualDNA Predictive Analytics
VisualDNA Predictive AnalyticsVisualDNA
 
How life-event data can improve & protect your marketing in a post-GDPR world
How life-event data can improve & protect your marketing in a post-GDPR worldHow life-event data can improve & protect your marketing in a post-GDPR world
How life-event data can improve & protect your marketing in a post-GDPR worldPaul Laughlin
 
Generational Retirement Trends Study - 2015
Generational Retirement Trends Study - 2015Generational Retirement Trends Study - 2015
Generational Retirement Trends Study - 2015T. Rowe Price
 
Data Analysis Projectnour91318iul2024.pptx
Data Analysis Projectnour91318iul2024.pptxData Analysis Projectnour91318iul2024.pptx
Data Analysis Projectnour91318iul2024.pptxnhamze865
 
The Era of Accountability
The Era of Accountability The Era of Accountability
The Era of Accountability Dan McDade
 
Melbourne Business School - mba talk october 14 - croll - 40m - lean analytics
Melbourne Business School - mba talk october 14 - croll - 40m - lean analyticsMelbourne Business School - mba talk october 14 - croll - 40m - lean analytics
Melbourne Business School - mba talk october 14 - croll - 40m - lean analyticsLean Analytics
 
howtoturnbigdataintobetterdecisionspauwelsemac2016
howtoturnbigdataintobetterdecisionspauwelsemac2016howtoturnbigdataintobetterdecisionspauwelsemac2016
howtoturnbigdataintobetterdecisionspauwelsemac2016Koen Pauwels
 
The analysis of the data has been done using excel statistical sof.docx
The analysis of the data has been done using excel statistical sof.docxThe analysis of the data has been done using excel statistical sof.docx
The analysis of the data has been done using excel statistical sof.docxmattinsonjanel
 
2013 edelman-trust-barometer-china-deck-en
2013 edelman-trust-barometer-china-deck-en2013 edelman-trust-barometer-china-deck-en
2013 edelman-trust-barometer-china-deck-enDJECHINA
 

Similar a Data Mining Assignment Final (20)

Compensation Best Practices Panel
Compensation Best Practices PanelCompensation Best Practices Panel
Compensation Best Practices Panel
 
Looking for patterns in the data
Looking for patterns in the dataLooking for patterns in the data
Looking for patterns in the data
 
Payments Pulse Survey: Small Business Edition
Payments Pulse Survey: Small Business EditionPayments Pulse Survey: Small Business Edition
Payments Pulse Survey: Small Business Edition
 
Business and Data Analytics Collaborative April Meetup
Business and Data Analytics Collaborative April MeetupBusiness and Data Analytics Collaborative April Meetup
Business and Data Analytics Collaborative April Meetup
 
TCS 2021 Global Leadership Study: Key Findings Report
TCS 2021 Global Leadership Study: Key Findings ReportTCS 2021 Global Leadership Study: Key Findings Report
TCS 2021 Global Leadership Study: Key Findings Report
 
Analysis on the US Consumer Expenditure
Analysis on the US Consumer ExpenditureAnalysis on the US Consumer Expenditure
Analysis on the US Consumer Expenditure
 
Credit Card Usage Study
Credit Card Usage StudyCredit Card Usage Study
Credit Card Usage Study
 
5 Tech Megatrends And Their Impact On Medical Technology Marketing FINAL
5 Tech Megatrends And Their Impact On Medical Technology Marketing FINAL5 Tech Megatrends And Their Impact On Medical Technology Marketing FINAL
5 Tech Megatrends And Their Impact On Medical Technology Marketing FINAL
 
Generating and Qualifying Inbound SMB Leads
Generating and Qualifying Inbound SMB LeadsGenerating and Qualifying Inbound SMB Leads
Generating and Qualifying Inbound SMB Leads
 
VisualDNA Predictive Analytics
VisualDNA Predictive AnalyticsVisualDNA Predictive Analytics
VisualDNA Predictive Analytics
 
How life-event data can improve & protect your marketing in a post-GDPR world
How life-event data can improve & protect your marketing in a post-GDPR worldHow life-event data can improve & protect your marketing in a post-GDPR world
How life-event data can improve & protect your marketing in a post-GDPR world
 
Generational Retirement Trends Study - 2015
Generational Retirement Trends Study - 2015Generational Retirement Trends Study - 2015
Generational Retirement Trends Study - 2015
 
Customer Segmentation
Customer SegmentationCustomer Segmentation
Customer Segmentation
 
Research on Marketers
Research on MarketersResearch on Marketers
Research on Marketers
 
Data Analysis Projectnour91318iul2024.pptx
Data Analysis Projectnour91318iul2024.pptxData Analysis Projectnour91318iul2024.pptx
Data Analysis Projectnour91318iul2024.pptx
 
The Era of Accountability
The Era of Accountability The Era of Accountability
The Era of Accountability
 
Melbourne Business School - mba talk october 14 - croll - 40m - lean analytics
Melbourne Business School - mba talk october 14 - croll - 40m - lean analyticsMelbourne Business School - mba talk october 14 - croll - 40m - lean analytics
Melbourne Business School - mba talk october 14 - croll - 40m - lean analytics
 
howtoturnbigdataintobetterdecisionspauwelsemac2016
howtoturnbigdataintobetterdecisionspauwelsemac2016howtoturnbigdataintobetterdecisionspauwelsemac2016
howtoturnbigdataintobetterdecisionspauwelsemac2016
 
The analysis of the data has been done using excel statistical sof.docx
The analysis of the data has been done using excel statistical sof.docxThe analysis of the data has been done using excel statistical sof.docx
The analysis of the data has been done using excel statistical sof.docx
 
2013 edelman-trust-barometer-china-deck-en
2013 edelman-trust-barometer-china-deck-en2013 edelman-trust-barometer-china-deck-en
2013 edelman-trust-barometer-china-deck-en
 

Más de TIEZHENG YUAN

Marketing Assignment
Marketing AssignmentMarketing Assignment
Marketing AssignmentTIEZHENG YUAN
 
Cultural Semester 2 assignment
Cultural Semester 2 assignmentCultural Semester 2 assignment
Cultural Semester 2 assignmentTIEZHENG YUAN
 
Cultural Semester 1 assignment
Cultural Semester 1 assignmentCultural Semester 1 assignment
Cultural Semester 1 assignmentTIEZHENG YUAN
 
Cluster Analysis Assignment 2013-2014(2)
Cluster Analysis Assignment 2013-2014(2)Cluster Analysis Assignment 2013-2014(2)
Cluster Analysis Assignment 2013-2014(2)TIEZHENG YUAN
 
Exploratory Factor Analysis Assignment 2013-2014(1)
Exploratory Factor Analysis Assignment 2013-2014(1)Exploratory Factor Analysis Assignment 2013-2014(1)
Exploratory Factor Analysis Assignment 2013-2014(1)TIEZHENG YUAN
 

Más de TIEZHENG YUAN (6)

Marketing Assignment
Marketing AssignmentMarketing Assignment
Marketing Assignment
 
Cultural Semester 2 assignment
Cultural Semester 2 assignmentCultural Semester 2 assignment
Cultural Semester 2 assignment
 
Cultural Semester 1 assignment
Cultural Semester 1 assignmentCultural Semester 1 assignment
Cultural Semester 1 assignment
 
Cluster Analysis Assignment 2013-2014(2)
Cluster Analysis Assignment 2013-2014(2)Cluster Analysis Assignment 2013-2014(2)
Cluster Analysis Assignment 2013-2014(2)
 
Exploratory Factor Analysis Assignment 2013-2014(1)
Exploratory Factor Analysis Assignment 2013-2014(1)Exploratory Factor Analysis Assignment 2013-2014(1)
Exploratory Factor Analysis Assignment 2013-2014(1)
 
Dissertation Final
Dissertation FinalDissertation Final
Dissertation Final
 

Data Mining Assignment Final

  • 1. Data Mining Coursework B064536 Introduction Variables Ranking by Likelihood to Redeem Total Coupon Redeemed Total Participants in Category (Total Coupon Redeemed/Total Participant)*100 Age 35-44 years old 587 120565 0.49% 45-54 years old 761 169188 0.45% 25-34 years old 351 83584 0.42% Marital Status Married 1010 203642 0.50% Unknown 743 203455 0.37% Single 238 71354 0.33% Income 35-99K 1275 273663 0.47% 100K+ 320 79425 0.40% Under 34K 396 125363 0.32% Homeowner Description Unknown 304 5232 5.81% Renter 64 6977 0.92% Homeowner 1529 298685 0.51% Household Composition 2 Adults With Kids 608 108905 0.56% 1 Adult With Kids 141 28276 0.50% 2 Adults No Kids 655 153491 0.43% Ranking by Campaign Effectiveness Coupon Redeemed Total Coupon sent Percentage B 247 25872 0.95% A 1724 444895 0.39% C 20 7684 0.26%  People who redeem coupons are not from your main customer base  Largest campaign, Type A is not effective Data from the demographic, coupon and campaign datasets were merged together. A total of 478451 valid samples were generated. 50% of the samples were used for model training purpose. 50% of the samples were used for testing purpose. The dataset was imbalance as there were only 1991 redeemed coupons out of 478451 valid samples. Balancing node in SPSS Modeler was used to correct imbalance in dataset. The proportion of redeemed coupons was increased by a factor of 245 for model training and testing. The model was build using CHAID and the set of input variables that provide the highest accuracy percentage were included in the decision tree. Different combinations of input variables were tested during the working process and their accuracy readings were recorded and compared. CHAID is a classification method that uses Chi-square statistics to perform optimal splits for decision tree building. CHAID will firstly conduct a detailed analysis of the input variables and dependent variable. Next, it will test for significance using Chi-square test of independence. CHAID will select an input field that has the smallest p-value (most significant). If a variable has more than two categories, these are weighed up, and categories that show least difference in outcome are grouped together. This merging process stops when all remaining categories are significantly different from each other. CHAID was identified as the most accurate classification model for this dataset by auto classifier node. A manual comparison amongst CHAID, CART and C5.0 were also conducted. Result ascertains the analysis of auto classifier node. When deciding who to send coupon to, retailer should consider these factors in following sequence: 1. Homeowner description 2. Income description 3. Household composition 4. Household size 5. Marital status According to CHAID classification, retailer should send coupons to: 1. People who are homeowners, probable owners and probable renters 2. People’s income who are 35-99K 3. Household composition with 2 adults with and without kids 4. A household with 1 to 3 person 5. Married The model developed has an accuracy of 63.14%. This means that the model is able to correctly classify (predict) those who would redeem coupon and those who would not redeem coupon with an accuracy of 63.14%. 5.80% 17.47% 25.20% 35.36% 7.96% 8.21% 19-24 25-34 35-44 45-54 55-64 65+ Age Married 43% Single 15% Unknown 42% Marital Status Under 34K 26% 35-99K 57% 100K+ 17% Income 62.43% 29.32% 5.70% 1.46% 1.09% Homeowner Unknown Renter Probable Owner Probable Renter Homeowner Description 32.08% 22.76% 18.04% 11.32% 5.91% 9.88% 2 Adults No Kids 2 Adults With Kids Single Female Single Male 1 Adult With Kids Unknown Household Composition The aim of this project is to generate some meaningful insights for the retailer using exploratory data analysis (SPSS Modeler). It also aim to build a model that can accurately predict which customers are more likely to redeem coupons and those that would not. Who are your customers?  Age 45-54 Years Old  Married  35-99K  Homeowner  2 adults No Kids Who are redeeming coupons right now? Data Manipulation Chi-squared Automatic Interaction Detection Results Discussion and Recommendations There is one contradiction between data analysed and CHAID prediction. Data analysed revealed that unknown and renter are more likely to redeem coupon. However, CHAID predict that homeowners, probable owners and probable renters are more likely to redeem coupons. The other factors such as marital status, income and household composition are consistent between data analysed and CHAID. Both indicate that people who are married with income between 35-99K and household with 2 adults with and without kids are more likely to redeem coupons. One recommendation is to evaluate and re-design type A campaign as it is not effective. Secondly, campaign should be more targeted to lower cost. Target audience should be its main customer base as CHAID’s prediction coincides with the characteristics of its main customer base.