Development of a Flood Warning Tool Set for Bandera, Texas - Doug Schnoebelen
•Descargar como PPTX, PDF•
1 recomendación•93 vistas

TWCA Mid-Year Conference 2018

Recomendados
Recomendados
Más contenido relacionado
La actualidad más candente
La actualidad más candente (20)
Similar a Development of a Flood Warning Tool Set for Bandera, Texas - Doug Schnoebelen
Similar a Development of a Flood Warning Tool Set for Bandera, Texas - Doug Schnoebelen (20)
Más de TWCA
Más de TWCA (20)
Último
Último (20)
Development of a Flood Warning Tool Set for Bandera, Texas - Doug Schnoebelen
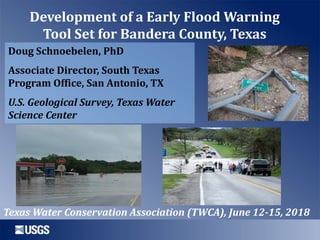
- 1. Development of a Early Flood Warning Tool Set for Bandera County, Texas Doug Schnoebelen, PhD Associate Director, South Texas Program Office, San Antonio, TX U.S. Geological Survey, Texas Water Science Center Texas Water Conservation Association (TWCA), June 12-15, 2018
- 2. USGS real-time streamgage information is used across the Nation for both flood and drought assessments Floods and Drought
- 3. South Texas Program Office Coverage • 208 Stream/Lake sites • 18 Water quality sites • 8 Groundwater sites Real time sites
- 4. Developing integrated systems of stream gages, rain gages, modeling and cameras for complex issues Flood Warning— An Integrated Systems Approach
- 5. Flooding in the Texas Hill Country “Flash Flood Alley” Examples from Blanco Basin and Bandera County, TX “New Tools”
- 6. Physical Characteristics Texas Hill Country Spring fed Stony hills and steep canyons Thin layer of topsoil
- 7. Wimberley
- 11. Blanco River @ FM165
- 12. Planning for a Flood—Three key points to consider • What areas will be flooded? • How deep will the waters get? • When will the flood arrive?
- 16. Stream Selection (flood areas)
- 17. Modeling Flood Heights (flood depths)
- 18. Geospatial Processing (flood extent)
- 19. Creation of Flood Inundation Maps Hydraulic Modeling Geospatial Processing Series of sequential maps showing probable areas of flooding (Flood Atlas)
- 20. FIM Web Mapping Application FIM—”Flood Inundation Mapping”
- 21. Early Model Results--Bandera Flood Categories (in feet) USGS 1% Annual Exceedance Flood Major Flood Stage: 24 Moderate Flood Stage: 14 Flood Stage: 13 Action Stage: 10
- 22. Flood Categories (in feet) FEMA FIRM 1% Annual Exceedance Flood USGS 1% Annual Exceedance Flood Major Flood Stage: 24 Moderate Flood Stage: 14 Flood Stage: 13 Action Stage: 10
- 23. y = 0.9956x + 5.2527 R² = 0.9947 WSE RMS = 0.48 ft (Rating - Model) 1195 1200 1205 1210 1215 1220 1225 1230 1195 1200 1205 1210 1215 1220 1225 1230 Modeledwatersurfaceelevationat Bandera,inNGVD29feet Rated water surface elevation at Bandera, in NGVD29 feet Modelled Calibrated 1 to 1 Linear (Calibrated) Flood Categories (in feet) Major Flood Stage: 24 Moderate Flood Stage: 14 Flood Stage: 13 Action Stage: 10 Early Model Results
- 24. New Tools and Technology--Bandera LSPIV Calculates 2D velocity for the viewable scene. Instantaneous or averaged. Grid of vectors for a ROI. Discrete measurements. Foam, surface patterns, no standing waves IMAGE Velocimetry (Large Scale Particle Image VelocimetryDOPPLER RADAR Velocimetry RADAR Calculates 1D velocity time. Spectra of return signal amplitudes give velocity (Doppler shift) and SNR. X X X Moving surface waves > 3 mm, no standing waves SENSE PROCESS DERIVE VELOCITIES
- 25. Video Cameras & LSPIV—Hurricane Harvey Examples • Collected daily videos during the drawdown releases from the reservoirs from Sept 5–12, 2017 • Analysis estimated velocities “on demand” for USACE Preliminary Information-Subject to Revision. Not for Citation or Distribution.
- 26. Drone-Based Mapping Plan and fly, then make maps, DEMs, and more…
- 27. Drone-Based Mapping Go from photos3D Point CloudsDEMs / LASextractions/classification
- 28. Early Flood Warning Tools—New Technology, Equipment & Modeling – Preparedness • “What-if” scenarios – Response • Tied to gage & forecast data • Road/Bridge Closures – Recovery • Damage Assessment – Flood Atlas • Working with Emergency Managers and Planners Photo Courtesy of Jerry Sides Medina Lake - 2002
- 29. Questions? USGS “Best in Science Best in Service” Doug Schnoebelen, PhD USGS, San Antonio, TX 210-691-9262 dschnoebelen@usgs.gov tx.usgs.gov