SlideShare una empresa de Scribd logo
1 de 20
Blake Taylor                                                                                                                                                                         Austin Board of REALTORS
                                                                             Median Sold Price by Month
                                                                        Dec-08 vs. Dec-10: The median sold price is up 6%


                                                                                  Dec-08 vs. Dec-10
                   Dec-08                                           Dec-10                                         Change                                              %
                   377,500                                          400,000                                        22,500                                             +6%


MLS: ACTRIS        Period:   2 years (monthly)           Price:   All                        Construction Type:    All            Bedrooms:    All             Bathrooms:      All         Lot Size: All
Property Types:    Residential: (House, Condo, Townhouse, Manufactured, Half Duplex, Mobile Home, Loft, Residential - Unknown)                                                             Sq Ft:    All
MLS Areas:         RN


Clarus MarketMetrics®                                                                                     1 of 2                                                                                           01/18/2011
                                                 Information not guaranteed. © 2009-2010 Terradatum and its suppliers and licensors (www.terradatum.com/about/licensors.td).


                  www.TaylorRealEstateAustin.com | www.EarlyBirdAustin.com | Direct: 512.796.4447 | Fax: 512.628.7720 | 1701 Spyglass Dr. Ste. 8 Austin, TX 78746
                                                                                                         1 of 20
Blake Taylor                                                                                                                                                         Austin Board of REALTORS
                                                                   Median Sold Price by Month
                                                          Dec-08 vs. Dec-10: The median sold price is up 6%


Time Period             Median Price            # Units       Average DOM
Dec-10                      400,000                  37                    99
Nov-10                      279,000                  25                    92
Oct-10                      375,000                  31                    87
Sep-10                      422,000                  41                    75
Aug-10                      372,000                  43                    84
Jul-10                      429,000                  53                    64
Jun-10                      412,000                  51                    78
May-10                      408,500                  46                    63
Apr-10                      385,500                  32                    93
Mar-10                      372,250                  42                    89
Feb-10                      300,000                  25                    84
Jan-10                      369,000                  18                    80
Dec-09                      357,000                  40                    96
Nov-09                      440,000                  32                   107
Oct-09                      364,000                  30                    99
Sep-09                      369,500                  36                   102
Aug-09                      343,000                  57                    79
Jul-09                      390,000                  57                   103
Jun-09                      444,000                  51                   113
May-09                      379,750                  42                    70
Apr-09                      312,000                  23                    99
Mar-09                      488,735                  28                    96
Feb-09                      355,000                  23                   122
Jan-09                      440,000                  23                   134
Dec-08                      377,500                  40                    81


Clarus MarketMetrics®                                                                           2 of 2                                                                                01/18/2011
                                       Information not guaranteed. © 2009-2010 Terradatum and its suppliers and licensors (www.terradatum.com/about/licensors.td).


              www.TaylorRealEstateAustin.com | www.EarlyBirdAustin.com | Direct: 512.796.4447 | Fax: 512.628.7720 | 1701 Spyglass Dr. Ste. 8 Austin, TX 78746
                                                                                                     2 of 20
Blake Taylor                                                                                                                                                                          Austin Board of REALTORS
                                                                          Median For Sale vs. Median Sold
              Dec-08 vs. Dec-10: The median price of for sale properties is up 10% and the median price of sold properties is up 6%


                             Dec-08 vs. Dec-10                                                                                                                       Dec-08 vs. Dec-10
    Dec-08              Dec-10                Change                      %                                                                     Dec-08             Dec-10                Change              %
    492,450             539,900               47,450                     +10%                                                                   377,500            400,000               22,500             +6%


MLS: ACTRIS        Period:    2 years (monthly)           Price:   All                        Construction Type:    All             Bedrooms:    All            Bathrooms:      All         Lot Size: All
Property Types:    Residential: (House, Condo, Townhouse, Manufactured, Half Duplex, Mobile Home, Loft, Residential - Unknown)                                                              Sq Ft:    All
MLS Areas:         RN


Clarus MarketMetrics®                                                                                      1 of 2                                                                                            01/18/2011
                                                  Information not guaranteed. © 2009-2010 Terradatum and its suppliers and licensors (www.terradatum.com/about/licensors.td).


                  www.TaylorRealEstateAustin.com | www.EarlyBirdAustin.com | Direct: 512.796.4447 | Fax: 512.628.7720 | 1701 Spyglass Dr. Ste. 8 Austin, TX 78746
                                                                                                         3 of 20
Blake Taylor                                                                                                                                                           Austin Board of REALTORS
                                                               Median For Sale vs. Median Sold
              Dec-08 vs. Dec-10: The median price of for sale properties is up 10% and the median price of sold properties is up 6%

                              For Sale                # Properties                         Sold                 # Properties                        Price
Time Period                    Median                     For Sale                       Median                        Sold                    Difference
Dec-10                        539,900                            293                    400,000                            37                    -139,900
Nov-10                        499,900                            341                    279,000                            25                    -220,900
Oct-10                        515,000                            373                    375,000                            31                    -140,000
Sep-10                        499,900                            393                    422,000                            41                     -77,900
Aug-10                        488,900                            445                    372,000                            43                    -116,900
Jul-10                        495,000                            483                    429,000                            53                     -66,000
Jun-10                        509,900                            477                    412,000                            51                     -97,900
May-10                        495,000                            450                    408,500                            46                     -86,500
Apr-10                        499,000                            438                    385,500                            32                    -113,500
Mar-10                        489,000                            385                    372,250                            42                    -116,750
Feb-10                        472,750                            326                    300,000                            25                    -172,750
Jan-10                        459,562                            330                    369,000                            18                     -90,561
Dec-09                        475,000                            332                    357,000                            40                    -118,000
Nov-09                        488,950                            372                    440,000                            32                     -48,950
Oct-09                        499,000                            401                    364,000                            30                    -135,000
Sep-09                        499,950                            414                    369,500                            36                    -130,450
Aug-09                        507,500                            434                    343,000                            57                    -164,500
Jul-09                        486,750                            475                    390,000                            57                     -96,750
Jun-09                        479,450                            494                    444,000                            51                     -35,450
May-09                        479,000                            519                    379,750                            42                     -99,250
Apr-09                        469,700                            510                    312,000                            23                    -157,700
Mar-09                        479,000                            477                    488,735                            28                       9,735
Feb-09                        482,500                            409                    355,000                            23                    -127,500
Jan-09                        479,000                            393                    440,000                            23                     -39,000
Dec-08                        492,450                            398                    377,500                            40                    -114,950


Clarus MarketMetrics®                                                                             2 of 2                                                                                01/18/2011
                                         Information not guaranteed. © 2009-2010 Terradatum and its suppliers and licensors (www.terradatum.com/about/licensors.td).


               www.TaylorRealEstateAustin.com | www.EarlyBirdAustin.com | Direct: 512.796.4447 | Fax: 512.628.7720 | 1701 Spyglass Dr. Ste. 8 Austin, TX 78746
                                                                                                      4 of 20
Blake Taylor                                                                                                                                                                         Austin Board of REALTORS
                                                                                 Sold Properties by Month
                                                            Dec-08 vs. Dec-10: The number of Sold properties is down 8%


                                                                                  Dec-08 vs. Dec-10
                   Dec-08                                               Dec-10                                     Change                                              %
                     40                                                   37                                         -3                                               -8%


MLS: ACTRIS        Period:   2 years (monthly)           Price:   All                        Construction Type:    All             Bedrooms:    All            Bathrooms:      All         Lot Size: All
Property Types:    Residential: (House, Condo, Townhouse, Manufactured, Half Duplex, Mobile Home, Loft, Residential - Unknown)                                                             Sq Ft:    All
MLS Areas:         RN


Clarus MarketMetrics®                                                                                     1 of 2                                                                                           01/18/2011
                                                 Information not guaranteed. © 2009-2010 Terradatum and its suppliers and licensors (www.terradatum.com/about/licensors.td).


                  www.TaylorRealEstateAustin.com | www.EarlyBirdAustin.com | Direct: 512.796.4447 | Fax: 512.628.7720 | 1701 Spyglass Dr. Ste. 8 Austin, TX 78746
                                                                                                         5 of 20
Blake Taylor                                                                                                                                                          Austin Board of REALTORS
                                                                       Sold Properties by Month
                                                   Dec-08 vs. Dec-10: The number of Sold properties is down 8%


                                       Full Market                                                Bank Properties                                            Non-Bank Properties
Time Period             # Properties      Median Price         Average DOM              # Properties         % Bank            Median Price           # Properties    % Non-Bank   Median Price
Dec-10                           37             400,000                     99                      6            16.2               207,000                      31         83.8       417,000
Nov-10                           25             279,000                     92                      3            12.0               435,000                      22         88.0       277,000
Oct-10                           31             375,000                     87                      2             6.5               304,750                      29         93.5       375,000
Sep-10                           41             422,000                     75                      4             9.8               286,348                      37         90.2       422,000
Aug-10                           43             372,000                     84                      3             7.0               270,500                      40         93.0       392,500
Jul-10                           53             429,000                     64                      4             7.5               355,000                      49         92.5       433,600
Jun-10                           51             412,000                     78                      4             7.8               229,750                      47         92.2       435,000
May-10                           46             408,500                     63                      2             4.3               323,450                      44         95.7       411,500
Apr-10                           32             385,500                     93                      4            12.5               411,250                      28         87.5       385,500
Mar-10                           42             372,250                     89                      5            11.9               280,000                      37         88.1       388,500
Feb-10                           25             300,000                     84                      6            24.0               255,748                      19         76.0       340,000
Jan-10                           18             369,000                     80                      1             5.6               182,175                      17         94.4       378,000
Dec-09                           40             357,000                     96                      5            12.5               330,000                      35         87.5       363,000
Nov-09                           32             440,000                    107                      3             9.4               635,350                      29         90.6       435,000
Oct-09                           30             364,000                     99                      2             6.7               254,950                      28         93.3       391,000
Sep-09                           36             369,500                    102                      6            16.7               287,400                      30         83.3       421,000
Aug-09                           57             343,000                     79                      7            12.3               350,000                      50         87.7       340,900
Jul-09                           57             390,000                    103                      2             3.5               620,500                      55         96.5       370,000
Jun-09                           51             444,000                    113                      1             2.0               245,000                      50         98.0       444,495
May-09                           42             379,750                     70                      5            11.9               400,000                      37         88.1       379,500
Apr-09                           23             312,000                     99                      0                                                            23        100.0       312,000
Mar-09                           28             488,735                     96                      2             7.1               356,450                      26         92.9       501,410
Feb-09                           23             355,000                    122                      4            17.4               260,101                      19         82.6       435,000
Jan-09                           23             440,000                    134                      1             4.3               575,000                      22         95.7       420,500
Dec-08                           40             377,500                     81                      2             5.0               751,250                      38         95.0       377,500


Clarus MarketMetrics®                                                                            2 of 2                                                                                  01/18/2011
                                        Information not guaranteed. © 2009-2010 Terradatum and its suppliers and licensors (www.terradatum.com/about/licensors.td).


              www.TaylorRealEstateAustin.com | www.EarlyBirdAustin.com | Direct: 512.796.4447 | Fax: 512.628.7720 | 1701 Spyglass Dr. Ste. 8 Austin, TX 78746
                                                                                                     6 of 20
Blake Taylor                                                                                                                                                                         Austin Board of REALTORS
                                                                    Under Contract Properties by Month
                                                    Dec-08 vs. Dec-10: The number of Under Contract properties is up 23%


                                                                                  Dec-08 vs. Dec-10
                   Dec-08                                               Dec-10                                     Change                                             %
                     31                                                   38                                         7                                               +23%


MLS: ACTRIS        Period:   2 years (monthly)           Price:   All                        Construction Type:    All             Bedrooms:    All            Bathrooms:      All         Lot Size: All
Property Types:    Residential: (House, Condo, Townhouse, Manufactured, Half Duplex, Mobile Home, Loft, Residential - Unknown)                                                             Sq Ft:    All
MLS Areas:         RN


Clarus MarketMetrics®                                                                                     1 of 2                                                                                           01/18/2011
                                                 Information not guaranteed. © 2009-2010 Terradatum and its suppliers and licensors (www.terradatum.com/about/licensors.td).


                  www.TaylorRealEstateAustin.com | www.EarlyBirdAustin.com | Direct: 512.796.4447 | Fax: 512.628.7720 | 1701 Spyglass Dr. Ste. 8 Austin, TX 78746
                                                                                                         7 of 20
Blake Taylor                                                                                                                                                          Austin Board of REALTORS
                                                          Under Contract Properties by Month
                                           Dec-08 vs. Dec-10: The number of Under Contract properties is up 23%


                                       Full Market                                                Bank Properties                                            Non-Bank Properties
Time Period             # Properties      Median Price         Average DOM              # Properties         % Bank            Median Price           # Properties    % Non-Bank   Median Price
Dec-10                           38             525,000                     91                      7            18.4               594,000                      31         81.6       525,000
Nov-10                           31             369,900                    101                      4            12.9               284,900                      27         87.1       389,000
Oct-10                           39             416,565                     99                      3             7.7               594,900                      36         92.3       408,282
Sep-10                           31             419,000                     78                      5            16.1               400,000                      26         83.9       438,610
Aug-10                           39             339,500                     85                      3             7.7               143,000                      36         92.3       359,250
Jul-10                           51             436,000                     77                      3             5.9               293,600                      48         94.1       467,450
Jun-10                           49             429,000                     68                      3             6.1               385,000                      46         93.9       436,995
May-10                           34             424,482                     67                      2             5.9               375,750                      32         94.1       460,732
Apr-10                           57             425,058                     77                      3             5.3               247,500                      54         94.7       430,000
Mar-10                           38             411,292                     66                      3             7.9               269,900                      35         92.1       417,585
Feb-10                           32             338,255                    103                      4            12.5               372,900                      28         87.5       334,805
Jan-10                           32             349,356                     82                      8            25.0               255,000                      24         75.0       417,964
Dec-09                           21             349,000                    114                      3            14.3               259,900                      18         85.7       366,500
Nov-09                           35             479,000                     93                      6            17.1               500,000                      29         82.9       414,900
Oct-09                           37             352,793                     81                      2             5.4               572,450                      35         94.6       352,793
Sep-09                           27             469,900                    105                      2             7.4               484,900                      25         92.6       469,900
Aug-09                           49             369,900                    105                      6            12.2               332,405                      43         87.8       374,000
Jul-09                           55             349,900                     88                      4             7.3               248,750                      51         92.7       369,900
Jun-09                           47             389,900                    113                      5            10.6               680,000                      42         89.4       389,450
May-09                           54             417,500                     91                      3             5.6               477,900                      51         94.4       410,000
Apr-09                           35             429,500                     70                      3             8.6               251,900                      32         91.4       434,700
Mar-09                           29             425,000                     97                      1             3.5               417,900                      28         96.5       434,501
Feb-09                           24             554,350                     85                      1             4.2               248,900                      23         95.8       560,000
Jan-09                           30             362,400                    139                      4            13.3               279,900                      26         86.7       383,737
Dec-08                           31             433,226                    110                      1             3.2               271,900                      30         96.8       441,563


Clarus MarketMetrics®                                                                            2 of 2                                                                                  01/18/2011
                                        Information not guaranteed. © 2009-2010 Terradatum and its suppliers and licensors (www.terradatum.com/about/licensors.td).


              www.TaylorRealEstateAustin.com | www.EarlyBirdAustin.com | Direct: 512.796.4447 | Fax: 512.628.7720 | 1701 Spyglass Dr. Ste. 8 Austin, TX 78746
                                                                                                     8 of 20
Blake Taylor                                                                                                                                                                         Austin Board of REALTORS
                                                                                 New Properties by Month
                                                           Dec-08 vs. Dec-10: The number of New properties is down 46%


                                                                                  Dec-08 vs. Dec-10
                   Dec-08                                               Dec-10                                     Change                                               %
                     57                                                   31                                         -26                                              -46%


MLS: ACTRIS        Period:   2 years (monthly)           Price:   All                        Construction Type:    All             Bedrooms:    All            Bathrooms:      All         Lot Size: All
Property Types:    Residential: (House, Condo, Townhouse, Manufactured, Half Duplex, Mobile Home, Loft, Residential - Unknown)                                                             Sq Ft:    All
MLS Areas:         RN


Clarus MarketMetrics®                                                                                     1 of 2                                                                                           01/18/2011
                                                 Information not guaranteed. © 2009-2010 Terradatum and its suppliers and licensors (www.terradatum.com/about/licensors.td).


                  www.TaylorRealEstateAustin.com | www.EarlyBirdAustin.com | Direct: 512.796.4447 | Fax: 512.628.7720 | 1701 Spyglass Dr. Ste. 8 Austin, TX 78746
                                                                                                         9 of 20
Blake Taylor                                                                                                                                                         Austin Board of REALTORS
                                                                      New Properties by Month
                                                 Dec-08 vs. Dec-10: The number of New properties is down 46%


                            Full Market                                   Bank Properties                                             Non-Bank Properties
Time Period             # Properties     Median Price            # Properties         % Bank              Median Price         # Properties       % Non-Bank          Median Price
Dec-10                           31            419,000                       8            25.8                365,450                     23               74.2           489,900
Nov-10                           65            419,990                       4             6.2                667,400                     61               93.8           419,990
Oct-10                           60            437,495                       4             6.7                239,900                     56               93.3           453,000
Sep-10                           48            463,060                       8            16.7                259,950                     40               83.3           481,650
Aug-10                           69            436,000                       5             7.2                400,000                     64               92.8           436,815
Jul-10                           85            375,000                       6             7.1                524,500                     79               92.9           375,000
Jun-10                           95            525,000                       9             9.5                293,600                     86               90.5           534,900
May-10                           96            399,500                       5             5.2                153,000                     91               94.8           400,000
Apr-10                          135            437,500                       7             5.2                385,000                   128                94.8           443,700
Mar-10                          112            479,000                       8             7.1                246,250                   104                92.9           495,000
Feb-10                           56            492,450                       4             7.1                352,450                     52               92.9           562,000
Jan-10                           73            396,927                       7             9.6                376,900                     66               90.4           407,256
Dec-09                           46            462,400                       8            17.4                274,900                     38               82.6           478,695
Nov-09                           61            450,000                       8            13.1                317,450                     53               86.9           460,000
Oct-09                           62            419,000                       6             9.7                344,450                     56               90.3           422,000
Sep-09                           78            442,400                       4             5.1                402,700                     74               94.9           442,400
Aug-09                           71            499,000                       2             2.8                270,950                     69               97.2           530,000
Jul-09                           75            375,000                     11             14.7                254,900                     64               85.3           403,250
Jun-09                           65            435,000                       1             1.5                540,000                     64               98.5           430,000
May-09                          101            425,000                       9             8.9                348,300                     92               91.1           449,970
Apr-09                           98            408,500                       6             6.1                390,405                     92               93.9           408,500
Mar-09                          127            459,900                       8             6.3                265,000                   119                93.7           463,000
Feb-09                           89            425,000                       2             2.2                311,950                     87               97.8           429,500
Jan-09                           88            425,000                       6             6.8                426,900                     82               93.2           425,000
Dec-08                           57            547,500                       1             1.8                484,900                     56               98.2           548,250


Clarus MarketMetrics®                                                                            2 of 2                                                                               01/18/2011
                                       Information not guaranteed. © 2009-2010 Terradatum and its suppliers and licensors (www.terradatum.com/about/licensors.td).


              www.TaylorRealEstateAustin.com | www.EarlyBirdAustin.com | Direct: 512.796.4447 | Fax: 512.628.7720 | 1701 Spyglass Dr. Ste. 8 Austin, TX 78746
                                                                                                     10 of 20
Blake Taylor                                                                                                                                                                         Austin Board of REALTORS
                                                                            For Sale Properties by Month
                                                        Dec-08 vs. Dec-10: The number of For Sale properties is down 26%


                                                                                  Dec-08 vs. Dec-10
                   Dec-08                                               Dec-10                                     Change                                               %
                    398                                                  293                                        -105                                              -26%


MLS: ACTRIS        Period:   2 years (monthly)           Price:   All                        Construction Type:    All             Bedrooms:    All            Bathrooms:      All         Lot Size: All
Property Types:    Residential: (House, Condo, Townhouse, Manufactured, Half Duplex, Mobile Home, Loft, Residential - Unknown)                                                             Sq Ft:    All
MLS Areas:         RN


Clarus MarketMetrics®                                                                                     1 of 2                                                                                           01/18/2011
                                                 Information not guaranteed. © 2009-2010 Terradatum and its suppliers and licensors (www.terradatum.com/about/licensors.td).


                  www.TaylorRealEstateAustin.com | www.EarlyBirdAustin.com | Direct: 512.796.4447 | Fax: 512.628.7720 | 1701 Spyglass Dr. Ste. 8 Austin, TX 78746
                                                                                                         11 of 20
Blake Taylor                                                                                                                                                          Austin Board of REALTORS
                                                                  For Sale Properties by Month
                                               Dec-08 vs. Dec-10: The number of For Sale properties is down 26%


                                       Full Market                                                Bank Properties                                            Non-Bank Properties
Time Period             # Properties      Median Price         Average DOM              # Properties         % Bank            Median Price           # Properties    % Non-Bank   Median Price
Dec-10                          293             539,900                    162                     31            10.6               348,300                     262         89.4       558,900
Nov-10                          341             499,900                    165                     29             8.5               344,900                     312         91.5       525,000
Oct-10                          373             515,000                    175                     31             8.3               348,300                     342         91.7       539,450
Sep-10                          393             499,900                    182                     34             8.7               354,550                     359         91.3       525,000
Aug-10                          445             488,900                    178                     31             7.0               359,100                     414         93.0       492,450
Jul-10                          483             495,000                    175                     32             6.6               349,150                     451         93.4       499,900
Jun-10                          477             509,900                    176                     31             6.5               348,300                     446         93.5       525,000
May-10                          450             495,000                    184                     25             5.6               348,300                     425         94.4       509,000
Apr-10                          438             499,000                    187                     27             6.2               348,300                     411         93.8       520,000
Mar-10                          385             489,000                    196                     28             7.3               299,450                     357         92.7       499,900
Feb-10                          326             472,750                    210                     25             7.7               348,300                     301         92.3       495,000
Jan-10                          330             459,562                    213                     29             8.8               339,900                     301         91.2       475,000
Dec-09                          332             475,000                    222                     27             8.1               339,900                     305         91.9       499,000
Nov-09                          372             488,950                    210                     29             7.8               348,300                     343         92.2       499,000
Oct-09                          401             499,000                    207                     25             6.2               349,000                     376         93.8       500,000
Sep-09                          414             499,950                    212                     24             5.8               353,700                     390         94.2       522,450
Aug-09                          434             507,500                    211                     26             6.0               349,105                     408         94.0       527,000
Jul-09                          475             486,750                    201                     28             5.9               348,300                     447         94.1       499,000
Jun-09                          494             479,450                    202                     22             4.5               354,505                     472         95.5       492,000
May-09                          519             479,000                    193                     25             4.8               349,910                     494         95.2       488,396
Apr-09                          510             469,700                    192                     21             4.1               349,910                     489         95.9       475,000
Mar-09                          477             479,000                    203                     17             3.6               375,000                     460         96.4       483,375
Feb-09                          409             482,500                    213                     13             3.2               375,000                     396         96.8       497,500
Jan-09                          393             479,000                    224                     16             4.1               376,450                     377         95.9       490,000
Dec-08                          398             492,450                    219                     12             3.0               282,450                     386         97.0       497,450


Clarus MarketMetrics®                                                                            2 of 2                                                                                  01/18/2011
                                        Information not guaranteed. © 2009-2010 Terradatum and its suppliers and licensors (www.terradatum.com/about/licensors.td).


              www.TaylorRealEstateAustin.com | www.EarlyBirdAustin.com | Direct: 512.796.4447 | Fax: 512.628.7720 | 1701 Spyglass Dr. Ste. 8 Austin, TX 78746
                                                                                                     12 of 20
Blake Taylor                                                                                                                                                                         Austin Board of REALTORS
                                                                            Expired Properties by Month
                                                        Dec-08 vs. Dec-10: The number of Expired properties is down 42%


                                                                                  Dec-08 vs. Dec-10
                   Dec-08                                               Dec-10                                     Change                                               %
                     62                                                   36                                         -26                                              -42%


MLS: ACTRIS        Period:   2 years (monthly)           Price:   All                        Construction Type:    All             Bedrooms:    All            Bathrooms:      All         Lot Size: All
Property Types:    Residential: (House, Condo, Townhouse, Manufactured, Half Duplex, Mobile Home, Loft, Residential - Unknown)                                                             Sq Ft:    All
MLS Areas:         RN


Clarus MarketMetrics®                                                                                     1 of 2                                                                                           01/18/2011
                                                 Information not guaranteed. © 2009-2010 Terradatum and its suppliers and licensors (www.terradatum.com/about/licensors.td).


                  www.TaylorRealEstateAustin.com | www.EarlyBirdAustin.com | Direct: 512.796.4447 | Fax: 512.628.7720 | 1701 Spyglass Dr. Ste. 8 Austin, TX 78746
                                                                                                         13 of 20
Blake Taylor                                                                                                                                                          Austin Board of REALTORS
                                                                   Expired Properties by Month
                                               Dec-08 vs. Dec-10: The number of Expired properties is down 42%


                                       Full Market                                                Bank Properties                                            Non-Bank Properties
Time Period             # Properties      Median Price         Average DOM             # Properties          % Bank           Median Price           # Properties     % Non-Bank   Median Price
Dec-10                           36             549,450                    186                      2             5.6               334,950                      34         94.4       578,950
Nov-10                           48             437,200                    141                      2             4.2               232,450                      46         95.8       456,750
Oct-10                           58             492,450                    142                      3             5.2               495,000                      55         94.8       489,900
Sep-10                           49             475,000                    162                      2             4.1               972,500                      47         95.9       449,000
Aug-10                           61             419,000                    132                      2             3.3               449,000                      59         96.7       419,000
Jul-10                           56             524,950                    130                      3             5.4               945,000                      53         94.6       524,900
Jun-10                           30             433,250                    116                      2             6.7               224,900                      28         93.3       448,700
May-10                           34             430,000                    177                      1             2.9               119,900                      33         97.1       470,000
Apr-10                           27             419,000                    163                      4            14.8               187,450                      23         85.2       435,000
Mar-10                           44             377,000                    147                      5            11.4               245,000                      39         88.6       419,000
Feb-10                           21             650,000                    131                      1             4.8               470,500                      20         95.2       662,500
Jan-10                           28             374,479                    172                      0                                                            28        100.0       374,479
Dec-09                           54             579,000                    161                      2             3.7               529,500                      52         96.3       581,950
Nov-09                           51             579,000                    149                      4             7.8               397,001                      47         92.2       625,000
Oct-09                           53             589,900                    159                      2             3.8               443,000                      51         96.2       589,900
Sep-09                           48             466,000                    165                      3             6.2               335,000                      45         93.8       499,000
Aug-09                           49             515,000                    155                      0                                                            49        100.0       515,000
Jul-09                           57             480,000                    156                      0                                                            57        100.0       480,000
Jun-09                           47             290,000                    137                      0                                                            47        100.0       290,000
May-09                           36             499,500                    121                      1             2.8               265,000                      35         97.2       500,000
Apr-09                           57             355,000                    140                      2             3.5               357,900                      55         96.5       355,000
Mar-09                           36             520,750                    172                      1             2.8               517,500                      35         97.2       524,000
Feb-09                           35             387,712                    117                      3             8.6               285,000                      32         91.4       391,356
Jan-09                           43             457,000                    174                      1             2.3               484,900                      42         97.7       453,500
Dec-08                           62             448,250                    127                      1             1.6               279,900                      61         98.4       449,000


Clarus MarketMetrics®                                                                            2 of 2                                                                                   01/18/2011
                                        Information not guaranteed. © 2009-2010 Terradatum and its suppliers and licensors (www.terradatum.com/about/licensors.td).


              www.TaylorRealEstateAustin.com | www.EarlyBirdAustin.com | Direct: 512.796.4447 | Fax: 512.628.7720 | 1701 Spyglass Dr. Ste. 8 Austin, TX 78746
                                                                                                     14 of 20
Blake Taylor                                                                                                                                                                          Austin Board of REALTORS
                                                                                Supply & Demand by Month
                  Dec-08 vs. Dec-10: The number of for sale properties is down 26% and the number of sold properties is down 8%


                             Dec-08 vs. Dec-10                                                                                                                       Dec-08 vs. Dec-10
     Dec-08             Dec-10                Change                       %                                                                    Dec-08              Dec-10               Change              %
      398                293                   -105                      -26%                                                                     40                  37                   -3               -8%


MLS: ACTRIS        Period:    2 years (monthly)           Price:   All                        Construction Type:    All             Bedrooms:    All            Bathrooms:      All         Lot Size: All
Property Types:    Residential: (House, Condo, Townhouse, Manufactured, Half Duplex, Mobile Home, Loft, Residential - Unknown)                                                              Sq Ft:    All
MLS Areas:         RN


Clarus MarketMetrics®                                                                                      1 of 2                                                                                            01/18/2011
                                                  Information not guaranteed. © 2009-2010 Terradatum and its suppliers and licensors (www.terradatum.com/about/licensors.td).


                  www.TaylorRealEstateAustin.com | www.EarlyBirdAustin.com | Direct: 512.796.4447 | Fax: 512.628.7720 | 1701 Spyglass Dr. Ste. 8 Austin, TX 78746
                                                                                                         15 of 20
Blake Taylor                                                                                                                                                           Austin Board of REALTORS
                                                                     Supply & Demand by Month
               Dec-08 vs. Dec-10: The number of for sale properties is down 26% and the number of sold properties is down 8%

                          # Properties              Average DOM                    # Properties               Average DOM
Time Period                   For Sale                   For Sale                         Sold                        Sold
Dec-10                            293                            162                           37                          99
Nov-10                            341                            165                           25                          92
Oct-10                            373                            175                           31                          87
Sep-10                            393                            182                           41                          75
Aug-10                            445                            178                           43                          84
Jul-10                            483                            175                           53                          64
Jun-10                            477                            176                           51                          78
May-10                            450                            184                           46                          63
Apr-10                            438                            187                           32                          93
Mar-10                            385                            196                           42                          89
Feb-10                            326                            210                           25                          84
Jan-10                            330                            213                           18                          80
Dec-09                            332                            222                           40                          96
Nov-09                            372                            210                           32                         107
Oct-09                            401                            207                           30                          99
Sep-09                            414                            212                           36                         102
Aug-09                            434                            211                           57                          79
Jul-09                            475                            201                           57                         103
Jun-09                            494                            202                           51                         113
May-09                            519                            193                           42                          70
Apr-09                            510                            192                           23                          99
Mar-09                            477                            203                           28                          96
Feb-09                            409                            213                           23                         122
Jan-09                            393                            224                           23                         134
Dec-08                            398                            219                           40                          81


Clarus MarketMetrics®                                                                               2 of 2                                                                              01/18/2011
                                         Information not guaranteed. © 2009-2010 Terradatum and its suppliers and licensors (www.terradatum.com/about/licensors.td).


              www.TaylorRealEstateAustin.com | www.EarlyBirdAustin.com | Direct: 512.796.4447 | Fax: 512.628.7720 | 1701 Spyglass Dr. Ste. 8 Austin, TX 78746
                                                                                                     16 of 20
Blake Taylor                                                                                                                                                                         Austin Board of REALTORS
                                                                  The Average Days on Market by Month
                                                            Dec-08 vs. Dec-10: The average days on market is down 17%


                                                                                  Dec-08 vs. Dec-10
                   Dec-08                                               Dec-10                                     Change                                               %
                    110                                                   91                                         -19                                              -17%


MLS: ACTRIS        Period:   2 years (monthly)           Price:   All                        Construction Type:    All             Bedrooms:    All            Bathrooms:      All         Lot Size: All
Property Types:    Residential: (House, Condo, Townhouse, Manufactured, Half Duplex, Mobile Home, Loft, Residential - Unknown)                                                             Sq Ft:    All
MLS Areas:         RN


Clarus MarketMetrics®                                                                                     1 of 2                                                                                           01/18/2011
                                                 Information not guaranteed. © 2009-2010 Terradatum and its suppliers and licensors (www.terradatum.com/about/licensors.td).


                  www.TaylorRealEstateAustin.com | www.EarlyBirdAustin.com | Direct: 512.796.4447 | Fax: 512.628.7720 | 1701 Spyglass Dr. Ste. 8 Austin, TX 78746
                                                                                                         17 of 20
Blake Taylor                                                                                                                                                        Austin Board of REALTORS
                                                     The Average Days on Market by Month
                                                 Dec-08 vs. Dec-10: The average days on market is down 17%


Time Period             Average DOM      # UC Units
Dec-10                           91                38
Nov-10                          101                31
Oct-10                           99                39
Sep-10                           78                31
Aug-10                           85                39
Jul-10                           77                51
Jun-10                           68                49
May-10                           67                34
Apr-10                           77                57
Mar-10                           66                38
Feb-10                          103                32
Jan-10                           82                32
Dec-09                          114                21
Nov-09                           93                35
Oct-09                           81                37
Sep-09                          105                27
Aug-09                          105                49
Jul-09                           88                55
Jun-09                          113                47
May-09                           91                54
Apr-09                           70                35
Mar-09                           97                29
Feb-09                           85                24
Jan-09                          139                30
Dec-08                          110                31


Clarus MarketMetrics®                                                                          2 of 2                                                                                01/18/2011
                                      Information not guaranteed. © 2009-2010 Terradatum and its suppliers and licensors (www.terradatum.com/about/licensors.td).


              www.TaylorRealEstateAustin.com | www.EarlyBirdAustin.com | Direct: 512.796.4447 | Fax: 512.628.7720 | 1701 Spyglass Dr. Ste. 8 Austin, TX 78746
                                                                                                     18 of 20
Blake Taylor                                                                                                                                                                         Austin Board of REALTORS
                                                                             Months Supply of Inventory
                                                  Dec-08 vs. Dec-10: The average months supply of inventory is down 41%


                                                                                  Dec-08 vs. Dec-10
                   Dec-08                                               Dec-10                                     Change                                              %
                    9.8                                                  5.8                                        -4.1                                             -41%


MLS: ACTRIS        Period:   2 years (monthly)           Price:   All                        Construction Type:    All            Bedrooms:    All             Bathrooms:      All         Lot Size: All
Property Types:    Residential: (House, Condo, Townhouse, Manufactured, Half Duplex, Mobile Home, Loft, Residential - Unknown)                                                             Sq Ft:    All
MLS Areas:         RN


Clarus MarketMetrics®                                                                                     1 of 2                                                                                           01/18/2011
                                                 Information not guaranteed. © 2009-2010 Terradatum and its suppliers and licensors (www.terradatum.com/about/licensors.td).


                  www.TaylorRealEstateAustin.com | www.EarlyBirdAustin.com | Direct: 512.796.4447 | Fax: 512.628.7720 | 1701 Spyglass Dr. Ste. 8 Austin, TX 78746
                                                                                                         19 of 20
Blake Taylor                                                                                                                                                               Austin Board of REALTORS
                                                                         Months Supply of Inventory
                                              Dec-08 vs. Dec-10: The average months supply of inventory is down 41%

                          # Units For Sale          # UC Units                                   UC Average
Time Period             Last Day of Month         During Month                      MSI                DOM
Dec-10                      219                                 38                   5.8                       91
Nov-10                      262                                 31                   8.5                   101
Oct-10                      276                                 39                   7.1                       99
Sep-10                      313                                 31                  10.1                       78
Aug-10                      345                                 39                   8.8                       85
Jul-10                      376                                 51                   7.4                       77
Jun-10                      398                                 49                   8.1                       68
May-10                      382                                 34                  11.2                       67
Apr-10                      354                                 57                   6.2                       77
Mar-10                      303                                 38                   8.0                       66
Feb-10                      273                                 32                   8.5                   103
Jan-10                      270                                 32                   8.4                       82
Dec-09                      257                                 21                  12.2                   114
Nov-09                      286                                 35                   8.2                       93
Oct-09                      311                                 37                   8.4                       81
Sep-09                      339                                 27                  12.6                   105
Aug-09                      336                                 49                   6.9                   105
Jul-09                      363                                 55                   6.6                       88
Jun-09                      400                                 47                   8.5                   113
May-09                      429                                 54                   7.9                       91
Apr-09                      418                                 35                  11.9                       70
Mar-09                      412                                 29                  14.2                       97
Feb-09                      350                                 24                  14.6                       85
Jan-09                      320                                 30                  10.7                   139
Dec-08                      305                                 31                   9.8                   110


Clarus MarketMetrics®                                                                                 2 of 2                                                                                01/18/2011
                                             Information not guaranteed. © 2009-2010 Terradatum and its suppliers and licensors (www.terradatum.com/about/licensors.td).


              www.TaylorRealEstateAustin.com | www.EarlyBirdAustin.com | Direct: 512.796.4447 | Fax: 512.628.7720 | 1701 Spyglass Dr. Ste. 8 Austin, TX 78746
                                                                                                     20 of 20

Más contenido relacionado

La actualidad más candente

Sww, circle c, western oaks, meridian, avana
Sww, circle c, western oaks, meridian, avanaSww, circle c, western oaks, meridian, avana
Sww, circle c, western oaks, meridian, avanaTaylor Real Estate
 
Heartland TX - Feb/March 2011 - Housing Market Report
Heartland TX - Feb/March 2011 - Housing Market ReportHeartland TX - Feb/March 2011 - Housing Market Report
Heartland TX - Feb/March 2011 - Housing Market ReportValarie Littles
 
2 n, scofield farms, gracy farms, quail creek, lamplight village metrics
2 n, scofield farms, gracy farms, quail creek, lamplight village metrics2 n, scofield farms, gracy farms, quail creek, lamplight village metrics
2 n, scofield farms, gracy farms, quail creek, lamplight village metricsTaylor Real Estate
 
6,7, 78704, travis heights, bouldin creek, barton hills
6,7, 78704, travis heights, bouldin creek, barton hills6,7, 78704, travis heights, bouldin creek, barton hills
6,7, 78704, travis heights, bouldin creek, barton hillsTaylor Real Estate
 
Heartland TX - January 2011 - Housing Market Report
Heartland TX - January 2011 - Housing Market ReportHeartland TX - January 2011 - Housing Market Report
Heartland TX - January 2011 - Housing Market ReportValarie Littles
 
4, hyde park, rosedale metrics
4, hyde park, rosedale metrics4, hyde park, rosedale metrics
4, hyde park, rosedale metricsTaylor Real Estate
 
2, allandale, crestview, brentwood metrics
2, allandale, crestview, brentwood metrics2, allandale, crestview, brentwood metrics
2, allandale, crestview, brentwood metricsTaylor Real Estate
 
Heartland TX - Housing Market Report - August 2010
Heartland TX - Housing Market Report - August 2010Heartland TX - Housing Market Report - August 2010
Heartland TX - Housing Market Report - August 2010Valarie Littles
 
Frisco TX - Feb/March 2011 - Housing Market Report
Frisco TX - Feb/March 2011 - Housing Market ReportFrisco TX - Feb/March 2011 - Housing Market Report
Frisco TX - Feb/March 2011 - Housing Market ReportValarie Littles
 

La actualidad más candente (20)

DT Downtown
DT   DowntownDT   Downtown
DT Downtown
 
Condos Only
Condos OnlyCondos Only
Condos Only
 
Sww, circle c, western oaks, meridian, avana
Sww, circle c, western oaks, meridian, avanaSww, circle c, western oaks, meridian, avana
Sww, circle c, western oaks, meridian, avana
 
Central Austin Metrics
Central Austin MetricsCentral Austin Metrics
Central Austin Metrics
 
Heartland TX - Feb/March 2011 - Housing Market Report
Heartland TX - Feb/March 2011 - Housing Market ReportHeartland TX - Feb/March 2011 - Housing Market Report
Heartland TX - Feb/March 2011 - Housing Market Report
 
1 b, old west austin metrics
1 b, old west austin metrics1 b, old west austin metrics
1 b, old west austin metrics
 
Ls, lakeway, bee cave metrics
Ls, lakeway, bee cave metricsLs, lakeway, bee cave metrics
Ls, lakeway, bee cave metrics
 
8 e, 8w, westlake metrics
8 e, 8w, westlake metrics8 e, 8w, westlake metrics
8 e, 8w, westlake metrics
 
2 n, scofield farms, gracy farms, quail creek, lamplight village metrics
2 n, scofield farms, gracy farms, quail creek, lamplight village metrics2 n, scofield farms, gracy farms, quail creek, lamplight village metrics
2 n, scofield farms, gracy farms, quail creek, lamplight village metrics
 
W Metrics
W MetricsW Metrics
W Metrics
 
6,7, 78704, travis heights, bouldin creek, barton hills
6,7, 78704, travis heights, bouldin creek, barton hills6,7, 78704, travis heights, bouldin creek, barton hills
6,7, 78704, travis heights, bouldin creek, barton hills
 
Heartland TX - January 2011 - Housing Market Report
Heartland TX - January 2011 - Housing Market ReportHeartland TX - January 2011 - Housing Market Report
Heartland TX - January 2011 - Housing Market Report
 
1 n, jester, lakewood metrics
1 n, jester, lakewood metrics1 n, jester, lakewood metrics
1 n, jester, lakewood metrics
 
Condos only metrics
Condos only metricsCondos only metrics
Condos only metrics
 
4, hyde park, rosedale metrics
4, hyde park, rosedale metrics4, hyde park, rosedale metrics
4, hyde park, rosedale metrics
 
Central austin metrics
Central austin metricsCentral austin metrics
Central austin metrics
 
Westlake Metrics
Westlake MetricsWestlake Metrics
Westlake Metrics
 
2, allandale, crestview, brentwood metrics
2, allandale, crestview, brentwood metrics2, allandale, crestview, brentwood metrics
2, allandale, crestview, brentwood metrics
 
Heartland TX - Housing Market Report - August 2010
Heartland TX - Housing Market Report - August 2010Heartland TX - Housing Market Report - August 2010
Heartland TX - Housing Market Report - August 2010
 
Frisco TX - Feb/March 2011 - Housing Market Report
Frisco TX - Feb/March 2011 - Housing Market ReportFrisco TX - Feb/March 2011 - Housing Market Report
Frisco TX - Feb/March 2011 - Housing Market Report
 

Similar a Area rn steiner, river place

Area 2 allandale, brentwood, crestview
Area 2   allandale, brentwood, crestviewArea 2   allandale, brentwood, crestview
Area 2 allandale, brentwood, crestviewTaylor Real Estate
 
Area 3 windsor park, delwood, mueller
Area 3   windsor park, delwood, muellerArea 3   windsor park, delwood, mueller
Area 3 windsor park, delwood, muellerTaylor Real Estate
 
NW Hills, Highland Park Metrics
NW Hills, Highland Park MetricsNW Hills, Highland Park Metrics
NW Hills, Highland Park MetricsTaylor Real Estate
 
10 n, 10s, south austin metrics
10 n, 10s, south austin metrics10 n, 10s, south austin metrics
10 n, 10s, south austin metricsTaylor Real Estate
 
Rn, steiner ranch, river place metrics
Rn, steiner ranch, river place metricsRn, steiner ranch, river place metrics
Rn, steiner ranch, river place metricsTaylor Real Estate
 
Windsor Park, Delwood, Mueller
Windsor Park, Delwood, MuellerWindsor Park, Delwood, Mueller
Windsor Park, Delwood, MuellerTaylor Real Estate
 
3, windsor park, delwood, mueller
3, windsor park, delwood, mueller3, windsor park, delwood, mueller
3, windsor park, delwood, muellerTaylor Real Estate
 
1 a, nw hills, highland park, cat mountain
1 a, nw hills, highland park, cat mountain1 a, nw hills, highland park, cat mountain
1 a, nw hills, highland park, cat mountainTaylor Real Estate
 
Heath TX - January 2011 - Housing Market Report
Heath TX - January 2011 - Housing Market ReportHeath TX - January 2011 - Housing Market Report
Heath TX - January 2011 - Housing Market ReportValarie Littles
 
Heath TX - Housing Market Report - November 2010
Heath TX - Housing Market Report - November 2010Heath TX - Housing Market Report - November 2010
Heath TX - Housing Market Report - November 2010Valarie Littles
 
Frisco TX - Housing Market Report - November 2010
Frisco TX - Housing Market Report - November 2010Frisco TX - Housing Market Report - November 2010
Frisco TX - Housing Market Report - November 2010Valarie Littles
 

Similar a Area rn steiner, river place (15)

Area 2 allandale, brentwood, crestview
Area 2   allandale, brentwood, crestviewArea 2   allandale, brentwood, crestview
Area 2 allandale, brentwood, crestview
 
Area 5 east austin
Area 5   east austinArea 5   east austin
Area 5 east austin
 
Area 3 windsor park, delwood, mueller
Area 3   windsor park, delwood, muellerArea 3   windsor park, delwood, mueller
Area 3 windsor park, delwood, mueller
 
NW Hills, Highland Park Metrics
NW Hills, Highland Park MetricsNW Hills, Highland Park Metrics
NW Hills, Highland Park Metrics
 
10 n, 10s, south austin metrics
10 n, 10s, south austin metrics10 n, 10s, south austin metrics
10 n, 10s, south austin metrics
 
Rn, steiner ranch, river place metrics
Rn, steiner ranch, river place metricsRn, steiner ranch, river place metrics
Rn, steiner ranch, river place metrics
 
Ut metrics
Ut metricsUt metrics
Ut metrics
 
Windsor Park, Delwood, Mueller
Windsor Park, Delwood, MuellerWindsor Park, Delwood, Mueller
Windsor Park, Delwood, Mueller
 
Dt, downtown austin metrics
Dt, downtown austin metricsDt, downtown austin metrics
Dt, downtown austin metrics
 
3, windsor park, delwood, mueller
3, windsor park, delwood, mueller3, windsor park, delwood, mueller
3, windsor park, delwood, mueller
 
1 a, nw hills, highland park, cat mountain
1 a, nw hills, highland park, cat mountain1 a, nw hills, highland park, cat mountain
1 a, nw hills, highland park, cat mountain
 
5, east austin metrics
5, east austin metrics5, east austin metrics
5, east austin metrics
 
Heath TX - January 2011 - Housing Market Report
Heath TX - January 2011 - Housing Market ReportHeath TX - January 2011 - Housing Market Report
Heath TX - January 2011 - Housing Market Report
 
Heath TX - Housing Market Report - November 2010
Heath TX - Housing Market Report - November 2010Heath TX - Housing Market Report - November 2010
Heath TX - Housing Market Report - November 2010
 
Frisco TX - Housing Market Report - November 2010
Frisco TX - Housing Market Report - November 2010Frisco TX - Housing Market Report - November 2010
Frisco TX - Housing Market Report - November 2010
 

Area rn steiner, river place

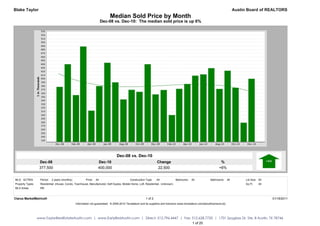
  • 1. Blake Taylor Austin Board of REALTORS Median Sold Price by Month Dec-08 vs. Dec-10: The median sold price is up 6% Dec-08 vs. Dec-10 Dec-08 Dec-10 Change % 377,500 400,000 22,500 +6% MLS: ACTRIS Period: 2 years (monthly) Price: All Construction Type: All Bedrooms: All Bathrooms: All Lot Size: All Property Types: Residential: (House, Condo, Townhouse, Manufactured, Half Duplex, Mobile Home, Loft, Residential - Unknown) Sq Ft: All MLS Areas: RN Clarus MarketMetrics® 1 of 2 01/18/2011 Information not guaranteed. © 2009-2010 Terradatum and its suppliers and licensors (www.terradatum.com/about/licensors.td). www.TaylorRealEstateAustin.com | www.EarlyBirdAustin.com | Direct: 512.796.4447 | Fax: 512.628.7720 | 1701 Spyglass Dr. Ste. 8 Austin, TX 78746 1 of 20
  • 2. Blake Taylor Austin Board of REALTORS Median Sold Price by Month Dec-08 vs. Dec-10: The median sold price is up 6% Time Period Median Price # Units Average DOM Dec-10 400,000 37 99 Nov-10 279,000 25 92 Oct-10 375,000 31 87 Sep-10 422,000 41 75 Aug-10 372,000 43 84 Jul-10 429,000 53 64 Jun-10 412,000 51 78 May-10 408,500 46 63 Apr-10 385,500 32 93 Mar-10 372,250 42 89 Feb-10 300,000 25 84 Jan-10 369,000 18 80 Dec-09 357,000 40 96 Nov-09 440,000 32 107 Oct-09 364,000 30 99 Sep-09 369,500 36 102 Aug-09 343,000 57 79 Jul-09 390,000 57 103 Jun-09 444,000 51 113 May-09 379,750 42 70 Apr-09 312,000 23 99 Mar-09 488,735 28 96 Feb-09 355,000 23 122 Jan-09 440,000 23 134 Dec-08 377,500 40 81 Clarus MarketMetrics® 2 of 2 01/18/2011 Information not guaranteed. © 2009-2010 Terradatum and its suppliers and licensors (www.terradatum.com/about/licensors.td). www.TaylorRealEstateAustin.com | www.EarlyBirdAustin.com | Direct: 512.796.4447 | Fax: 512.628.7720 | 1701 Spyglass Dr. Ste. 8 Austin, TX 78746 2 of 20
  • 3. Blake Taylor Austin Board of REALTORS Median For Sale vs. Median Sold Dec-08 vs. Dec-10: The median price of for sale properties is up 10% and the median price of sold properties is up 6% Dec-08 vs. Dec-10 Dec-08 vs. Dec-10 Dec-08 Dec-10 Change % Dec-08 Dec-10 Change % 492,450 539,900 47,450 +10% 377,500 400,000 22,500 +6% MLS: ACTRIS Period: 2 years (monthly) Price: All Construction Type: All Bedrooms: All Bathrooms: All Lot Size: All Property Types: Residential: (House, Condo, Townhouse, Manufactured, Half Duplex, Mobile Home, Loft, Residential - Unknown) Sq Ft: All MLS Areas: RN Clarus MarketMetrics® 1 of 2 01/18/2011 Information not guaranteed. © 2009-2010 Terradatum and its suppliers and licensors (www.terradatum.com/about/licensors.td). www.TaylorRealEstateAustin.com | www.EarlyBirdAustin.com | Direct: 512.796.4447 | Fax: 512.628.7720 | 1701 Spyglass Dr. Ste. 8 Austin, TX 78746 3 of 20
  • 4. Blake Taylor Austin Board of REALTORS Median For Sale vs. Median Sold Dec-08 vs. Dec-10: The median price of for sale properties is up 10% and the median price of sold properties is up 6% For Sale # Properties Sold # Properties Price Time Period Median For Sale Median Sold Difference Dec-10 539,900 293 400,000 37 -139,900 Nov-10 499,900 341 279,000 25 -220,900 Oct-10 515,000 373 375,000 31 -140,000 Sep-10 499,900 393 422,000 41 -77,900 Aug-10 488,900 445 372,000 43 -116,900 Jul-10 495,000 483 429,000 53 -66,000 Jun-10 509,900 477 412,000 51 -97,900 May-10 495,000 450 408,500 46 -86,500 Apr-10 499,000 438 385,500 32 -113,500 Mar-10 489,000 385 372,250 42 -116,750 Feb-10 472,750 326 300,000 25 -172,750 Jan-10 459,562 330 369,000 18 -90,561 Dec-09 475,000 332 357,000 40 -118,000 Nov-09 488,950 372 440,000 32 -48,950 Oct-09 499,000 401 364,000 30 -135,000 Sep-09 499,950 414 369,500 36 -130,450 Aug-09 507,500 434 343,000 57 -164,500 Jul-09 486,750 475 390,000 57 -96,750 Jun-09 479,450 494 444,000 51 -35,450 May-09 479,000 519 379,750 42 -99,250 Apr-09 469,700 510 312,000 23 -157,700 Mar-09 479,000 477 488,735 28 9,735 Feb-09 482,500 409 355,000 23 -127,500 Jan-09 479,000 393 440,000 23 -39,000 Dec-08 492,450 398 377,500 40 -114,950 Clarus MarketMetrics® 2 of 2 01/18/2011 Information not guaranteed. © 2009-2010 Terradatum and its suppliers and licensors (www.terradatum.com/about/licensors.td). www.TaylorRealEstateAustin.com | www.EarlyBirdAustin.com | Direct: 512.796.4447 | Fax: 512.628.7720 | 1701 Spyglass Dr. Ste. 8 Austin, TX 78746 4 of 20
  • 5. Blake Taylor Austin Board of REALTORS Sold Properties by Month Dec-08 vs. Dec-10: The number of Sold properties is down 8% Dec-08 vs. Dec-10 Dec-08 Dec-10 Change % 40 37 -3 -8% MLS: ACTRIS Period: 2 years (monthly) Price: All Construction Type: All Bedrooms: All Bathrooms: All Lot Size: All Property Types: Residential: (House, Condo, Townhouse, Manufactured, Half Duplex, Mobile Home, Loft, Residential - Unknown) Sq Ft: All MLS Areas: RN Clarus MarketMetrics® 1 of 2 01/18/2011 Information not guaranteed. © 2009-2010 Terradatum and its suppliers and licensors (www.terradatum.com/about/licensors.td). www.TaylorRealEstateAustin.com | www.EarlyBirdAustin.com | Direct: 512.796.4447 | Fax: 512.628.7720 | 1701 Spyglass Dr. Ste. 8 Austin, TX 78746 5 of 20
  • 6. Blake Taylor Austin Board of REALTORS Sold Properties by Month Dec-08 vs. Dec-10: The number of Sold properties is down 8% Full Market Bank Properties Non-Bank Properties Time Period # Properties Median Price Average DOM # Properties % Bank Median Price # Properties % Non-Bank Median Price Dec-10 37 400,000 99 6 16.2 207,000 31 83.8 417,000 Nov-10 25 279,000 92 3 12.0 435,000 22 88.0 277,000 Oct-10 31 375,000 87 2 6.5 304,750 29 93.5 375,000 Sep-10 41 422,000 75 4 9.8 286,348 37 90.2 422,000 Aug-10 43 372,000 84 3 7.0 270,500 40 93.0 392,500 Jul-10 53 429,000 64 4 7.5 355,000 49 92.5 433,600 Jun-10 51 412,000 78 4 7.8 229,750 47 92.2 435,000 May-10 46 408,500 63 2 4.3 323,450 44 95.7 411,500 Apr-10 32 385,500 93 4 12.5 411,250 28 87.5 385,500 Mar-10 42 372,250 89 5 11.9 280,000 37 88.1 388,500 Feb-10 25 300,000 84 6 24.0 255,748 19 76.0 340,000 Jan-10 18 369,000 80 1 5.6 182,175 17 94.4 378,000 Dec-09 40 357,000 96 5 12.5 330,000 35 87.5 363,000 Nov-09 32 440,000 107 3 9.4 635,350 29 90.6 435,000 Oct-09 30 364,000 99 2 6.7 254,950 28 93.3 391,000 Sep-09 36 369,500 102 6 16.7 287,400 30 83.3 421,000 Aug-09 57 343,000 79 7 12.3 350,000 50 87.7 340,900 Jul-09 57 390,000 103 2 3.5 620,500 55 96.5 370,000 Jun-09 51 444,000 113 1 2.0 245,000 50 98.0 444,495 May-09 42 379,750 70 5 11.9 400,000 37 88.1 379,500 Apr-09 23 312,000 99 0 23 100.0 312,000 Mar-09 28 488,735 96 2 7.1 356,450 26 92.9 501,410 Feb-09 23 355,000 122 4 17.4 260,101 19 82.6 435,000 Jan-09 23 440,000 134 1 4.3 575,000 22 95.7 420,500 Dec-08 40 377,500 81 2 5.0 751,250 38 95.0 377,500 Clarus MarketMetrics® 2 of 2 01/18/2011 Information not guaranteed. © 2009-2010 Terradatum and its suppliers and licensors (www.terradatum.com/about/licensors.td). www.TaylorRealEstateAustin.com | www.EarlyBirdAustin.com | Direct: 512.796.4447 | Fax: 512.628.7720 | 1701 Spyglass Dr. Ste. 8 Austin, TX 78746 6 of 20
  • 7. Blake Taylor Austin Board of REALTORS Under Contract Properties by Month Dec-08 vs. Dec-10: The number of Under Contract properties is up 23% Dec-08 vs. Dec-10 Dec-08 Dec-10 Change % 31 38 7 +23% MLS: ACTRIS Period: 2 years (monthly) Price: All Construction Type: All Bedrooms: All Bathrooms: All Lot Size: All Property Types: Residential: (House, Condo, Townhouse, Manufactured, Half Duplex, Mobile Home, Loft, Residential - Unknown) Sq Ft: All MLS Areas: RN Clarus MarketMetrics® 1 of 2 01/18/2011 Information not guaranteed. © 2009-2010 Terradatum and its suppliers and licensors (www.terradatum.com/about/licensors.td). www.TaylorRealEstateAustin.com | www.EarlyBirdAustin.com | Direct: 512.796.4447 | Fax: 512.628.7720 | 1701 Spyglass Dr. Ste. 8 Austin, TX 78746 7 of 20
  • 8. Blake Taylor Austin Board of REALTORS Under Contract Properties by Month Dec-08 vs. Dec-10: The number of Under Contract properties is up 23% Full Market Bank Properties Non-Bank Properties Time Period # Properties Median Price Average DOM # Properties % Bank Median Price # Properties % Non-Bank Median Price Dec-10 38 525,000 91 7 18.4 594,000 31 81.6 525,000 Nov-10 31 369,900 101 4 12.9 284,900 27 87.1 389,000 Oct-10 39 416,565 99 3 7.7 594,900 36 92.3 408,282 Sep-10 31 419,000 78 5 16.1 400,000 26 83.9 438,610 Aug-10 39 339,500 85 3 7.7 143,000 36 92.3 359,250 Jul-10 51 436,000 77 3 5.9 293,600 48 94.1 467,450 Jun-10 49 429,000 68 3 6.1 385,000 46 93.9 436,995 May-10 34 424,482 67 2 5.9 375,750 32 94.1 460,732 Apr-10 57 425,058 77 3 5.3 247,500 54 94.7 430,000 Mar-10 38 411,292 66 3 7.9 269,900 35 92.1 417,585 Feb-10 32 338,255 103 4 12.5 372,900 28 87.5 334,805 Jan-10 32 349,356 82 8 25.0 255,000 24 75.0 417,964 Dec-09 21 349,000 114 3 14.3 259,900 18 85.7 366,500 Nov-09 35 479,000 93 6 17.1 500,000 29 82.9 414,900 Oct-09 37 352,793 81 2 5.4 572,450 35 94.6 352,793 Sep-09 27 469,900 105 2 7.4 484,900 25 92.6 469,900 Aug-09 49 369,900 105 6 12.2 332,405 43 87.8 374,000 Jul-09 55 349,900 88 4 7.3 248,750 51 92.7 369,900 Jun-09 47 389,900 113 5 10.6 680,000 42 89.4 389,450 May-09 54 417,500 91 3 5.6 477,900 51 94.4 410,000 Apr-09 35 429,500 70 3 8.6 251,900 32 91.4 434,700 Mar-09 29 425,000 97 1 3.5 417,900 28 96.5 434,501 Feb-09 24 554,350 85 1 4.2 248,900 23 95.8 560,000 Jan-09 30 362,400 139 4 13.3 279,900 26 86.7 383,737 Dec-08 31 433,226 110 1 3.2 271,900 30 96.8 441,563 Clarus MarketMetrics® 2 of 2 01/18/2011 Information not guaranteed. © 2009-2010 Terradatum and its suppliers and licensors (www.terradatum.com/about/licensors.td). www.TaylorRealEstateAustin.com | www.EarlyBirdAustin.com | Direct: 512.796.4447 | Fax: 512.628.7720 | 1701 Spyglass Dr. Ste. 8 Austin, TX 78746 8 of 20
  • 9. Blake Taylor Austin Board of REALTORS New Properties by Month Dec-08 vs. Dec-10: The number of New properties is down 46% Dec-08 vs. Dec-10 Dec-08 Dec-10 Change % 57 31 -26 -46% MLS: ACTRIS Period: 2 years (monthly) Price: All Construction Type: All Bedrooms: All Bathrooms: All Lot Size: All Property Types: Residential: (House, Condo, Townhouse, Manufactured, Half Duplex, Mobile Home, Loft, Residential - Unknown) Sq Ft: All MLS Areas: RN Clarus MarketMetrics® 1 of 2 01/18/2011 Information not guaranteed. © 2009-2010 Terradatum and its suppliers and licensors (www.terradatum.com/about/licensors.td). www.TaylorRealEstateAustin.com | www.EarlyBirdAustin.com | Direct: 512.796.4447 | Fax: 512.628.7720 | 1701 Spyglass Dr. Ste. 8 Austin, TX 78746 9 of 20
  • 10. Blake Taylor Austin Board of REALTORS New Properties by Month Dec-08 vs. Dec-10: The number of New properties is down 46% Full Market Bank Properties Non-Bank Properties Time Period # Properties Median Price # Properties % Bank Median Price # Properties % Non-Bank Median Price Dec-10 31 419,000 8 25.8 365,450 23 74.2 489,900 Nov-10 65 419,990 4 6.2 667,400 61 93.8 419,990 Oct-10 60 437,495 4 6.7 239,900 56 93.3 453,000 Sep-10 48 463,060 8 16.7 259,950 40 83.3 481,650 Aug-10 69 436,000 5 7.2 400,000 64 92.8 436,815 Jul-10 85 375,000 6 7.1 524,500 79 92.9 375,000 Jun-10 95 525,000 9 9.5 293,600 86 90.5 534,900 May-10 96 399,500 5 5.2 153,000 91 94.8 400,000 Apr-10 135 437,500 7 5.2 385,000 128 94.8 443,700 Mar-10 112 479,000 8 7.1 246,250 104 92.9 495,000 Feb-10 56 492,450 4 7.1 352,450 52 92.9 562,000 Jan-10 73 396,927 7 9.6 376,900 66 90.4 407,256 Dec-09 46 462,400 8 17.4 274,900 38 82.6 478,695 Nov-09 61 450,000 8 13.1 317,450 53 86.9 460,000 Oct-09 62 419,000 6 9.7 344,450 56 90.3 422,000 Sep-09 78 442,400 4 5.1 402,700 74 94.9 442,400 Aug-09 71 499,000 2 2.8 270,950 69 97.2 530,000 Jul-09 75 375,000 11 14.7 254,900 64 85.3 403,250 Jun-09 65 435,000 1 1.5 540,000 64 98.5 430,000 May-09 101 425,000 9 8.9 348,300 92 91.1 449,970 Apr-09 98 408,500 6 6.1 390,405 92 93.9 408,500 Mar-09 127 459,900 8 6.3 265,000 119 93.7 463,000 Feb-09 89 425,000 2 2.2 311,950 87 97.8 429,500 Jan-09 88 425,000 6 6.8 426,900 82 93.2 425,000 Dec-08 57 547,500 1 1.8 484,900 56 98.2 548,250 Clarus MarketMetrics® 2 of 2 01/18/2011 Information not guaranteed. © 2009-2010 Terradatum and its suppliers and licensors (www.terradatum.com/about/licensors.td). www.TaylorRealEstateAustin.com | www.EarlyBirdAustin.com | Direct: 512.796.4447 | Fax: 512.628.7720 | 1701 Spyglass Dr. Ste. 8 Austin, TX 78746 10 of 20
  • 11. Blake Taylor Austin Board of REALTORS For Sale Properties by Month Dec-08 vs. Dec-10: The number of For Sale properties is down 26% Dec-08 vs. Dec-10 Dec-08 Dec-10 Change % 398 293 -105 -26% MLS: ACTRIS Period: 2 years (monthly) Price: All Construction Type: All Bedrooms: All Bathrooms: All Lot Size: All Property Types: Residential: (House, Condo, Townhouse, Manufactured, Half Duplex, Mobile Home, Loft, Residential - Unknown) Sq Ft: All MLS Areas: RN Clarus MarketMetrics® 1 of 2 01/18/2011 Information not guaranteed. © 2009-2010 Terradatum and its suppliers and licensors (www.terradatum.com/about/licensors.td). www.TaylorRealEstateAustin.com | www.EarlyBirdAustin.com | Direct: 512.796.4447 | Fax: 512.628.7720 | 1701 Spyglass Dr. Ste. 8 Austin, TX 78746 11 of 20
  • 12. Blake Taylor Austin Board of REALTORS For Sale Properties by Month Dec-08 vs. Dec-10: The number of For Sale properties is down 26% Full Market Bank Properties Non-Bank Properties Time Period # Properties Median Price Average DOM # Properties % Bank Median Price # Properties % Non-Bank Median Price Dec-10 293 539,900 162 31 10.6 348,300 262 89.4 558,900 Nov-10 341 499,900 165 29 8.5 344,900 312 91.5 525,000 Oct-10 373 515,000 175 31 8.3 348,300 342 91.7 539,450 Sep-10 393 499,900 182 34 8.7 354,550 359 91.3 525,000 Aug-10 445 488,900 178 31 7.0 359,100 414 93.0 492,450 Jul-10 483 495,000 175 32 6.6 349,150 451 93.4 499,900 Jun-10 477 509,900 176 31 6.5 348,300 446 93.5 525,000 May-10 450 495,000 184 25 5.6 348,300 425 94.4 509,000 Apr-10 438 499,000 187 27 6.2 348,300 411 93.8 520,000 Mar-10 385 489,000 196 28 7.3 299,450 357 92.7 499,900 Feb-10 326 472,750 210 25 7.7 348,300 301 92.3 495,000 Jan-10 330 459,562 213 29 8.8 339,900 301 91.2 475,000 Dec-09 332 475,000 222 27 8.1 339,900 305 91.9 499,000 Nov-09 372 488,950 210 29 7.8 348,300 343 92.2 499,000 Oct-09 401 499,000 207 25 6.2 349,000 376 93.8 500,000 Sep-09 414 499,950 212 24 5.8 353,700 390 94.2 522,450 Aug-09 434 507,500 211 26 6.0 349,105 408 94.0 527,000 Jul-09 475 486,750 201 28 5.9 348,300 447 94.1 499,000 Jun-09 494 479,450 202 22 4.5 354,505 472 95.5 492,000 May-09 519 479,000 193 25 4.8 349,910 494 95.2 488,396 Apr-09 510 469,700 192 21 4.1 349,910 489 95.9 475,000 Mar-09 477 479,000 203 17 3.6 375,000 460 96.4 483,375 Feb-09 409 482,500 213 13 3.2 375,000 396 96.8 497,500 Jan-09 393 479,000 224 16 4.1 376,450 377 95.9 490,000 Dec-08 398 492,450 219 12 3.0 282,450 386 97.0 497,450 Clarus MarketMetrics® 2 of 2 01/18/2011 Information not guaranteed. © 2009-2010 Terradatum and its suppliers and licensors (www.terradatum.com/about/licensors.td). www.TaylorRealEstateAustin.com | www.EarlyBirdAustin.com | Direct: 512.796.4447 | Fax: 512.628.7720 | 1701 Spyglass Dr. Ste. 8 Austin, TX 78746 12 of 20
  • 13. Blake Taylor Austin Board of REALTORS Expired Properties by Month Dec-08 vs. Dec-10: The number of Expired properties is down 42% Dec-08 vs. Dec-10 Dec-08 Dec-10 Change % 62 36 -26 -42% MLS: ACTRIS Period: 2 years (monthly) Price: All Construction Type: All Bedrooms: All Bathrooms: All Lot Size: All Property Types: Residential: (House, Condo, Townhouse, Manufactured, Half Duplex, Mobile Home, Loft, Residential - Unknown) Sq Ft: All MLS Areas: RN Clarus MarketMetrics® 1 of 2 01/18/2011 Information not guaranteed. © 2009-2010 Terradatum and its suppliers and licensors (www.terradatum.com/about/licensors.td). www.TaylorRealEstateAustin.com | www.EarlyBirdAustin.com | Direct: 512.796.4447 | Fax: 512.628.7720 | 1701 Spyglass Dr. Ste. 8 Austin, TX 78746 13 of 20
  • 14. Blake Taylor Austin Board of REALTORS Expired Properties by Month Dec-08 vs. Dec-10: The number of Expired properties is down 42% Full Market Bank Properties Non-Bank Properties Time Period # Properties Median Price Average DOM # Properties % Bank Median Price # Properties % Non-Bank Median Price Dec-10 36 549,450 186 2 5.6 334,950 34 94.4 578,950 Nov-10 48 437,200 141 2 4.2 232,450 46 95.8 456,750 Oct-10 58 492,450 142 3 5.2 495,000 55 94.8 489,900 Sep-10 49 475,000 162 2 4.1 972,500 47 95.9 449,000 Aug-10 61 419,000 132 2 3.3 449,000 59 96.7 419,000 Jul-10 56 524,950 130 3 5.4 945,000 53 94.6 524,900 Jun-10 30 433,250 116 2 6.7 224,900 28 93.3 448,700 May-10 34 430,000 177 1 2.9 119,900 33 97.1 470,000 Apr-10 27 419,000 163 4 14.8 187,450 23 85.2 435,000 Mar-10 44 377,000 147 5 11.4 245,000 39 88.6 419,000 Feb-10 21 650,000 131 1 4.8 470,500 20 95.2 662,500 Jan-10 28 374,479 172 0 28 100.0 374,479 Dec-09 54 579,000 161 2 3.7 529,500 52 96.3 581,950 Nov-09 51 579,000 149 4 7.8 397,001 47 92.2 625,000 Oct-09 53 589,900 159 2 3.8 443,000 51 96.2 589,900 Sep-09 48 466,000 165 3 6.2 335,000 45 93.8 499,000 Aug-09 49 515,000 155 0 49 100.0 515,000 Jul-09 57 480,000 156 0 57 100.0 480,000 Jun-09 47 290,000 137 0 47 100.0 290,000 May-09 36 499,500 121 1 2.8 265,000 35 97.2 500,000 Apr-09 57 355,000 140 2 3.5 357,900 55 96.5 355,000 Mar-09 36 520,750 172 1 2.8 517,500 35 97.2 524,000 Feb-09 35 387,712 117 3 8.6 285,000 32 91.4 391,356 Jan-09 43 457,000 174 1 2.3 484,900 42 97.7 453,500 Dec-08 62 448,250 127 1 1.6 279,900 61 98.4 449,000 Clarus MarketMetrics® 2 of 2 01/18/2011 Information not guaranteed. © 2009-2010 Terradatum and its suppliers and licensors (www.terradatum.com/about/licensors.td). www.TaylorRealEstateAustin.com | www.EarlyBirdAustin.com | Direct: 512.796.4447 | Fax: 512.628.7720 | 1701 Spyglass Dr. Ste. 8 Austin, TX 78746 14 of 20
  • 15. Blake Taylor Austin Board of REALTORS Supply & Demand by Month Dec-08 vs. Dec-10: The number of for sale properties is down 26% and the number of sold properties is down 8% Dec-08 vs. Dec-10 Dec-08 vs. Dec-10 Dec-08 Dec-10 Change % Dec-08 Dec-10 Change % 398 293 -105 -26% 40 37 -3 -8% MLS: ACTRIS Period: 2 years (monthly) Price: All Construction Type: All Bedrooms: All Bathrooms: All Lot Size: All Property Types: Residential: (House, Condo, Townhouse, Manufactured, Half Duplex, Mobile Home, Loft, Residential - Unknown) Sq Ft: All MLS Areas: RN Clarus MarketMetrics® 1 of 2 01/18/2011 Information not guaranteed. © 2009-2010 Terradatum and its suppliers and licensors (www.terradatum.com/about/licensors.td). www.TaylorRealEstateAustin.com | www.EarlyBirdAustin.com | Direct: 512.796.4447 | Fax: 512.628.7720 | 1701 Spyglass Dr. Ste. 8 Austin, TX 78746 15 of 20
  • 16. Blake Taylor Austin Board of REALTORS Supply & Demand by Month Dec-08 vs. Dec-10: The number of for sale properties is down 26% and the number of sold properties is down 8% # Properties Average DOM # Properties Average DOM Time Period For Sale For Sale Sold Sold Dec-10 293 162 37 99 Nov-10 341 165 25 92 Oct-10 373 175 31 87 Sep-10 393 182 41 75 Aug-10 445 178 43 84 Jul-10 483 175 53 64 Jun-10 477 176 51 78 May-10 450 184 46 63 Apr-10 438 187 32 93 Mar-10 385 196 42 89 Feb-10 326 210 25 84 Jan-10 330 213 18 80 Dec-09 332 222 40 96 Nov-09 372 210 32 107 Oct-09 401 207 30 99 Sep-09 414 212 36 102 Aug-09 434 211 57 79 Jul-09 475 201 57 103 Jun-09 494 202 51 113 May-09 519 193 42 70 Apr-09 510 192 23 99 Mar-09 477 203 28 96 Feb-09 409 213 23 122 Jan-09 393 224 23 134 Dec-08 398 219 40 81 Clarus MarketMetrics® 2 of 2 01/18/2011 Information not guaranteed. © 2009-2010 Terradatum and its suppliers and licensors (www.terradatum.com/about/licensors.td). www.TaylorRealEstateAustin.com | www.EarlyBirdAustin.com | Direct: 512.796.4447 | Fax: 512.628.7720 | 1701 Spyglass Dr. Ste. 8 Austin, TX 78746 16 of 20
  • 17. Blake Taylor Austin Board of REALTORS The Average Days on Market by Month Dec-08 vs. Dec-10: The average days on market is down 17% Dec-08 vs. Dec-10 Dec-08 Dec-10 Change % 110 91 -19 -17% MLS: ACTRIS Period: 2 years (monthly) Price: All Construction Type: All Bedrooms: All Bathrooms: All Lot Size: All Property Types: Residential: (House, Condo, Townhouse, Manufactured, Half Duplex, Mobile Home, Loft, Residential - Unknown) Sq Ft: All MLS Areas: RN Clarus MarketMetrics® 1 of 2 01/18/2011 Information not guaranteed. © 2009-2010 Terradatum and its suppliers and licensors (www.terradatum.com/about/licensors.td). www.TaylorRealEstateAustin.com | www.EarlyBirdAustin.com | Direct: 512.796.4447 | Fax: 512.628.7720 | 1701 Spyglass Dr. Ste. 8 Austin, TX 78746 17 of 20
  • 18. Blake Taylor Austin Board of REALTORS The Average Days on Market by Month Dec-08 vs. Dec-10: The average days on market is down 17% Time Period Average DOM # UC Units Dec-10 91 38 Nov-10 101 31 Oct-10 99 39 Sep-10 78 31 Aug-10 85 39 Jul-10 77 51 Jun-10 68 49 May-10 67 34 Apr-10 77 57 Mar-10 66 38 Feb-10 103 32 Jan-10 82 32 Dec-09 114 21 Nov-09 93 35 Oct-09 81 37 Sep-09 105 27 Aug-09 105 49 Jul-09 88 55 Jun-09 113 47 May-09 91 54 Apr-09 70 35 Mar-09 97 29 Feb-09 85 24 Jan-09 139 30 Dec-08 110 31 Clarus MarketMetrics® 2 of 2 01/18/2011 Information not guaranteed. © 2009-2010 Terradatum and its suppliers and licensors (www.terradatum.com/about/licensors.td). www.TaylorRealEstateAustin.com | www.EarlyBirdAustin.com | Direct: 512.796.4447 | Fax: 512.628.7720 | 1701 Spyglass Dr. Ste. 8 Austin, TX 78746 18 of 20
  • 19. Blake Taylor Austin Board of REALTORS Months Supply of Inventory Dec-08 vs. Dec-10: The average months supply of inventory is down 41% Dec-08 vs. Dec-10 Dec-08 Dec-10 Change % 9.8 5.8 -4.1 -41% MLS: ACTRIS Period: 2 years (monthly) Price: All Construction Type: All Bedrooms: All Bathrooms: All Lot Size: All Property Types: Residential: (House, Condo, Townhouse, Manufactured, Half Duplex, Mobile Home, Loft, Residential - Unknown) Sq Ft: All MLS Areas: RN Clarus MarketMetrics® 1 of 2 01/18/2011 Information not guaranteed. © 2009-2010 Terradatum and its suppliers and licensors (www.terradatum.com/about/licensors.td). www.TaylorRealEstateAustin.com | www.EarlyBirdAustin.com | Direct: 512.796.4447 | Fax: 512.628.7720 | 1701 Spyglass Dr. Ste. 8 Austin, TX 78746 19 of 20
  • 20. Blake Taylor Austin Board of REALTORS Months Supply of Inventory Dec-08 vs. Dec-10: The average months supply of inventory is down 41% # Units For Sale # UC Units UC Average Time Period Last Day of Month During Month MSI DOM Dec-10 219 38 5.8 91 Nov-10 262 31 8.5 101 Oct-10 276 39 7.1 99 Sep-10 313 31 10.1 78 Aug-10 345 39 8.8 85 Jul-10 376 51 7.4 77 Jun-10 398 49 8.1 68 May-10 382 34 11.2 67 Apr-10 354 57 6.2 77 Mar-10 303 38 8.0 66 Feb-10 273 32 8.5 103 Jan-10 270 32 8.4 82 Dec-09 257 21 12.2 114 Nov-09 286 35 8.2 93 Oct-09 311 37 8.4 81 Sep-09 339 27 12.6 105 Aug-09 336 49 6.9 105 Jul-09 363 55 6.6 88 Jun-09 400 47 8.5 113 May-09 429 54 7.9 91 Apr-09 418 35 11.9 70 Mar-09 412 29 14.2 97 Feb-09 350 24 14.6 85 Jan-09 320 30 10.7 139 Dec-08 305 31 9.8 110 Clarus MarketMetrics® 2 of 2 01/18/2011 Information not guaranteed. © 2009-2010 Terradatum and its suppliers and licensors (www.terradatum.com/about/licensors.td). www.TaylorRealEstateAustin.com | www.EarlyBirdAustin.com | Direct: 512.796.4447 | Fax: 512.628.7720 | 1701 Spyglass Dr. Ste. 8 Austin, TX 78746 20 of 20