SlideShare una empresa de Scribd logo
1 de 17
Descargar para leer sin conexión
THINKING SPATIALLY IN THE SOCIAL SCIENCES
Michael F. Goodchild and Donald G. Janelle

INTRODUCTION
The table of numbers or statistics is such a common way to organize information that we
scarcely if ever think about its significance. Tables are used to organize information
about states from the decennial census; to report the comparative performance of national
economies; to summarize the performance of individual schools in a state; and for a host
of other purposes. In most cases a simple convention will have been followed in
preparing the table (Nicol and Pexman, 1999). The rows of the table will represent the
instances, objects, or cases whose attributes are being reported, and all such objects will
be drawn from a homogeneous class, such as counties, states, or nations. Each column of
the table represents one of the attributes, allowing the reader to make comparisons by
running the eye up or down a column, or by computing statistics such as column means.
In all of the instances just listed the objects happen to be geographic, in the sense that
they occupy distinct locations on the Earth's surface; in the case of the census these
objects might range from regions to states, counties, municipalities, census tracts, or
block groups.
Tables succeed in organizing information for easy comparison, and for analysis in
spreadsheets or statistical packages, but they do so by largely ignoring one particular
property of each object: its geographic location. A table of U.S. states ordered
alphabetically, for example, places Alabama at the top and Wyoming at the bottom, and
in only two instances (Florida and Georgia, Illinois and Indiana) do states that are
adjacent geographically appear in adjacent rows in the table. In effect, the table discards
any importance that one might attach to geographic location: do states that are near each
other geographically tend share common properties, and do such tendencies contribute
greater insight into the processes at work on the landscape; or are there instances of states
whose attributes are out of line with those of neighboring states? The Census Bureau
often addresses this issue by ordering tables by region, so that all states in New England
occur together in the table, for example, with each region's states ordered alphabetically
within region. But while this allows for easy comparison within regions, and serves to
link the contents of the table to whatever else the reader happens to know about New
England, it still allows neighboring states to appear far apart in the table, if they happen
to lie in different regions; and it can place states that are in the same region next to each
other, although they are far apart in space. Clearly it is impossible to order states such
that proximity in the table fully captures relative geographic proximity, or a state's
geographic context (Abel and Mark, 1990).
At another level, one might ask whether states are actually the appropriate units for
reporting statistics. Of course one can use larger units that are aggregations of states, such
as regions or nations, or smaller units that themselves aggregate to states, such as
counties, but the larger question is whether any of the standard reporting units are optimal
–whether some quite different way of dividing the U.S. might lead to greater insight. For
example, metropolitan regions frequently cross the state boundaries that were drawn
somewhat arbitrarily many years ago, and yet are much less than the aggregations of their
respective states (e.g., the New York or Kansas City metropolitan regions). States also
vary vastly in area, from the more than 1.5m sq km of Alaska to the 3,144 sq km of
Rhode Island, confusing any effort to link state-level analysis with processes operating on
the landscape over particular ranges of distances. Perhaps the geographic world is better
seen as continuous, with reporting zone boundaries somewhat arbitrarily imposed on it.
But does this matter, or are geographic location and context irrelevant? Clearly
geographic location is important for many purposes, such as wayfinding, but is it
important for the purposes of social science, which is the focus of this book? Social
science addresses a multitude of domains, using a wide range of methods, but in essence
its purposes boil down to three:
•
•
•

understanding and explanation of human behavior, and processes involving
humans and their actions;
prediction of such behaviors and processes, for purposes of planning or
commerce;
solution of problems that face society, and can be alleviated through knowledge
of human behavior.

This book is about the role of space, geographic location, and related concepts in such
tasks. It rests on two related assertions, which will be addressed in detail in subsequent
sections of this introduction, and exemplified in the studies that are described by the
book's contributors. First, location (and more generally space) is important, and can
contribute substantially to all three of the objectives identified above. Second, location
(and space) provide a powerful mechanism for integrating the efforts of the various social
sciences. Multidisciplinary efforts are increasingly important in pursuing the objectives
of social science, and in understanding the coupling of social and physical processes on
the landscape. We argue in the third section of this introduction that space provides one
of the few, and perhaps the only basis for such integration.
These are the arguments that we made in our successful proposal to the National Science
Foundation that led to the establishment in 1999 of the Center for Spatially Integrated
Social Science (CSISS) within the National Center for Geographic Information and
Analysis at the University of California, Santa Barbara (see http://CSISS.org). In the
fourth section of this introduction we briefly review CSISS, and expand on our purposes
in putting together this book.
Although the focus of this book is on the role of space, many of the points made here can
equally well be made about time, or the combination of space and time (Peuquet, 2002).
For many purposes spatial should be read as shorthand for spatiotemporal, especially for
dynamic phenomena.
THE IMPORTANCE OF SPACE
In this section we present three arguments for the importance of space as a source of
insight and understanding, and as a basis for prediction and the solution of problems. We
do not suggest that the set of three is exhaustive– rather, it seems likely that other
arguments can also be made. The discussion expands on the arguments presented by
Goodchild et al. (1999). It is followed by a short introduction to geographic information
systems (GIS), and their impacts on the social sciences.
SPATIAL ANALYSIS
The terms spatial analysis or spatial data analysis suggest an emphasis on location in the
conduct of analysis, or more formally, that results of analysis using any of the techniques
falling into this category are dependent in some way on the locations of the objects being
analyzed– if the locations change, the results change. Spatial analysis examines data in
cross-section, as opposed to longitudinal analysis, or the analysis of temporal series. The
decennial snapshots provided by the census are a prominent example of cross-sectional
data, because each snapshot provides a picture of the nation's population at one specific
date in time. Successive snapshots can in principle be assembled to provide longitudinal
series, but the long time intervals between census years and the tendency for the
definitions of variables and reporting zones to change makes this a challenging task.
Nevertheless, the National Historic GIS project at the University of Minnesota is
attempting to build a Web-based resource that will make this possible for the entire
period since the first U.S. census (see http://www.nhgis.org).
Despite such efforts, however, social scientists must face the fact that cross-sectional data
of relevance to social science are much easier to acquire than longitudinal data. Yet the
processes that social scientists study occur in time, and reveal their effects in changes on
the landscape. How can the study or analysis of data in cross-section lead to insights into
behavioral processes– or more broadly, how can spatial analysis lead to scientific
understanding in social science? This theme is explored in detail in many chapters of this
book; in Chapter 16, for example, Sweeney and Feser discuss our ability to understand
business processes from cross-sectional data.
The techniques of spatial analysis address the issue that opened this chapter: the loss of
spatial context when cross-sectional information is displayed in the form of tables.
Suppose, for example, that the same information on comparative performance of national
economies, or percentage of home ownership by state, were displayed in the form of a
map rather than as a table. In this form it is easy to compare each state's level of home
ownership to those of its neighbors, to identify anomalies in the form of states whose
levels are out of line with those of their neighbors, and to compare the patterns seen in the
map with prior knowledge of each state's characteristics, and those if its neighbors. In
essence, the creation of a map is a very simple and intuitive form of spatial analysis; or
perhaps more correctly, a way of empowering the human eye and brain to perform
intuitive spatial analysis. Just as with any form of information presentation it is subject to
manipulation by the map designer, through the inappropriate choice of colors and class
intervals (see, for example, Monmonier, 1991); and by insisting on planimetric accuracy
maps tend to overemphasize large states, and may make small states almost impossible to
see (though cartograms provide an interesting way of adjusting visual emphasis; Dorling,
1995).
A multitude of more elaborate forms of spatial analysis have been described in the past
few decades, and several excellent texts provide surveys. Bailey and Gatrell (1995)
organize their review by data type, providing surveys of techniques suited for the analysis
of data based on (1) point observations, such as records of crime locations; (2)
aggregations by reporting zones, such as the summary data produced by the census; and
(3) interactions between reporting zones, such as data on migrations, trade flows, or
commuting patterns. The survey by Fotheringham et al. (2000) is one of the most recent,
and includes many techniques developed in the past decade for place-based analysis (see
the next section). Mitchell (1999) provides an intuitive survey that is most helpful as a
key to understanding the role of GIS in spatial analysis.
Spatial analysis can play important roles in both inductive and deductive approaches to
science. In an inductive context, the display of data in spatial context may reveal patterns
and anomalies, and suggest processes that might account for them. The story of John
Snow's use of a map to reinforce the notion that drinking water from a pump in London
might have been the cause of an outbreak of cholera in 1854 remains one of the most
compelling instances of inference from data viewed in cross-section (Gilbert, 1958;
Goodchild, 1992; Tufte, 1983). The map clearly shows a clustering of cholera cases
around the pump, reflecting the tendency for people to draw water from the nearest
available source (Figure 1). Since then, many other potential causes of disease have been
investigated as a result of similar observations of anomalous clustering in cross-sectional
data, suggesting causal mechanisms associated with residential or workplace locations
that are in turn reflected in georeferenced mortality or morbidity records. Clustering is
also the focus of Chapter 6, in which Logan and Zhang examine the varying character of
ethnic neighborhoods in contemporary Los Angeles, and of Chapter 19, where Weeks
describes the role of clustering in understanding demographic processes. In Chapter 18,
Gatrell and Rigby review the role of spatial perspectives in many areas of public health,
from epidemiology to health care service delivery.
[Figure 1 about here]
Cross-sectional data can also be used to test existing theories and principles, in an
approach that is more deductive than inductive. But here one must confront an important
principle: that the same spatial pattern can be produced by a range of different processes–
in other words, that there is no 1:1 correspondence between process through time and
pattern in space. For example, even Snow's simple symmetrical clustering of cholera
cases around the Broad Street pump could have been caused by contagion, the popular
hypothesis for cholera transmission at the time, if the original carrier had also been
located in Broad Street, given the tendency for social networks to cluster in space. The
principle of Occam's Razor might be invoked to justify adopting the simpler drinking
water hypothesis, but although this is amply justified by scientific practice it seems a
weak argument in the circumstances. Snow himself was able to have the pump handle
removed, and to observe the consequent effect on the outbreak, but today few social
scientists can enjoy the luxury of such a controlled experiment on a human population.
Thus spatial pattern, and spatial analysis, can rarely if ever be used to confirm theories,
though they can certainly be used to deny false ones, and to justify controlled
experiments or longitudinal analysis where these are possible.
In summary, spatial analysis is perhaps best seen as an exploratory technique, more
suitable for the generation of hypotheses and insights than to strict confirmation of theory
(a process ably illustrated by Kantner in Chapter 12 in his efforts to reconstruct past
behavior from the evidence of prehistoric roadways). As such, however, its presentation
of data in visual form, its use of spatial context, and the power of the eye and brain to
detect patterns and anomalies and to recall other information about places from memory
forms a potent environment for scientific understanding, as the authors demonstrate in
several of the chapters of this book.
Recently, much technical progress has been made in taking advantage of the capabilities
of modern computing environments to go well beyond what has traditionally been
possible with data displayed in the form of maps, and the application of routine and
somewhat mechanical methods of spatial analysis. In Chapter 3, Kwan and Lee use GISbased tools to visualize individual behavior in space and time, using the capabilities of
software to generate dynamic, three-dimensional displays of vast amounts of data. Such
methods can reveal patterns and anomalies in behavior that might never be evident in
more conventional two-dimensional mapping. Exploratory spatial data analysis (ESDA)
builds on the broad success of exploratory data analysis (EDA), a trend towards a more
interactive and visual approach to statistical analysis initiated by Tukey and others in
statistics in the 1970s (Tukey, 1977). ESDA research has explored several distinct
avenues that are variously unique to spatial data. Anselin (1999) emphasizes the
importance of spatial autocorrelation, or the tendency for observations that are near
eachother in space to have similar values– for "locational similarity (observations in
spatial proximity) (to be) matched by value similarity (correlation)". In Chapter 9,
Messner and Anselin demonstrate the use of the concept in understanding patterns of
homicide. Others have pursued the idea of linked windows. In this approach, several
distinct views of a data set are presented to the observer simultaneously in a series of
windows, with dynamic linkages between them. For example, a data set might be
displayed as a map, a table, a histogram of one variable, and a scatterplot of two
variables. Pointing to an observation or group of observations in one window
automatically causes the corresponding observations to be highlighted in other windows.
Thus one can highlight the outliers from the main trend in a scatterplot, and observe their
locations on a map.
PLACE-BASED ANALYSIS
Generalization is a cornerstone of the scientific method, and there is much greater interest
in discovering things that are generally true than things that are true only at certain times,
or in certain places. This nomothetic approach to science has obvious value in such
disciplines as physics and chemistry, where scientific truths, such as chemical reactions
and the laws of motion, have an absolute validity. But in the social sciences there is no
realistic prospect of discovering such absolute truths about human behavior; as the
nuclear physicist Sir Ernest Rutherford is reputed1 to have said or written, "The only
possible conclusion the social sciences can draw is: some do, some don't". One might
dream of a model of human behavior that accounts for all variance (R2=1), but in reality
rejection of the null hypothesis that the model accounts for no variance is more often the
basis for claims of progress.
If a model fits imperfectly, then it is reasonable to expect that its residuals will show
geographic patterns, and perhaps that the model will fit better (residual variation will be
smaller) in some areas than others– in other words, it will exhibit spatial nonstationarity.
If so, then the results obtained from an analysis over any limited study area will depend
explicitly on the bounds of the study area, and will be different if the study area is
changed. It is common when analyzing cross-sectional data to make maps of residuals,
hoping that spatial context will suggest factors that might explain the residual variation,
and improve the model's fit. One might observe, for example, that residuals were
uncommonly high in certain parts of a city, or in certain states, and prior knowledge of
those areas, or maps of other factors, might suggest modifications to the model. But these
arguments lie firmly within the nomothetic tradition: the purpose of analysis is to
discover universal truths.
By contrast, the idiographic approach seeks to identify and record the unique properties
of places. The effort may still be scientific, in the sense that results are reproducible and
described in terms whose meanings are widely understood, but generalization is much
less important as a motivation. A follower of the idiographic approach might become an
expert in some particular area of the Earth's surface, and his or her students might
become experts in parts of that area, in a potentially infinite regress. The debate between
nomothetic and idiographic approaches to the discipline of geography peaked in the
1950s (Johnston, 1991), and remains an important dimension of the discipline's
methodological tensions.
Recently, however, a middle position has emerged that adds a new stimulus to the debate.
Place-based or local analysis (Fotheringham and Brunsdon, 1999) attempts to identify
the properties that distinguish places, within the context provided by a general
framework. Consider, for example, the technique of geographically weighted regression
(GWR) developed by Fotheringham and his group at the University of Newcastle
(Brunsdon et al., 1999; Fotheringham et al., 1998, 2000). Suppose a simple linear model
is to be fitted to data from geographically dispersed observations. Normally one would
use ordinary least squares, maximum likelihood, or some other suitable criterion to obtain
a single set of estimates of the universal parameters of the model. Suppose instead that
observations are weighted, using weights that are inversely related to distance from some
chosen location. The fitted parameters of the model will now be dependent on the
location chosen, and will vary as the regression is recentered on different locations. By
recentering the regression many times one can build up a complete map of the spatial
1

Although it is frequently cited, I have been unable to find a documented source of this comment.
variation of the parameter estimates, which can now be interpreted based on spatial
context, and known characteristics of the study area.
Many other methods of local analysis have been developed in the past few years.
Anselin's Local Indicators of Spatial Association (LISA; Anselin, 1995) decompose
universal measures of pattern into local measures, allowing much more detailed and
insightful interpretation (Cohen and Tita apply these methods in Chapter 10). For
example, measures of spatial autocorrelation such as Moran's I can be decomposed into
local Moran scatterplots, a useful means of detecting local anomalies (in Chapter 14,
Câmara et al. apply these techniques to analyze social exclusion in São Paulo). Getis and
Ord (1992) describe locally centered measures of clustering in point patterns.
In essence, place-based analysis relies on a simple expectation: that any model or theory
in the social sciences will fail to account perfectly for the phenomena that it describes;
and that in such circumstances phenomena will almost certainly exhibit non-stationarity.
If this is the case, then more will be learned by exploring patterns of non-stationarity than
by averaging them within a universal model or analytic technique. As in the previous
section, space provides the necessary link to other potentially interesting factors, and to
the context of observations.
SPATIALLY EXPLICIT MODELS AND THEORY
A model is said to be spatially explicit when it differentiates behaviors and predictions
according to spatial location. Consider a model that attempts to predict the behavior of
the U.S. economy. If the model lumps all aspects of the economy together without
respect to location, assuming in effect that there is perfect communication between all
regions of the U.S., then its predictions similarly apply uniformly to the entire country.
But the model would acquire some degree of spatial explicitness if it regarded the
economy as a system of regional economies, with processes coupling the different
regional parts together, and if it predicted distinct outcomes in each region. Regions
could be broken down into constituent states; states might be broken down into counties;
and progressively the number of spatial components of the economy might be increased
to a very large number. In the limit, the economy might be modeled as a collection of
actors moving across continuous space, rather than confined to lumped geographic areas.
This same continuum from one, to a few lumps, to a continuum underlies the models that
are increasingly used to predict the behavior of large systems, in disciplines ranging from
economics to communications, hydrology, ecology, and even physics. The field of
geocomputation (Atkinson and Martin, 2000; Longley et al., 1998; Openshaw and
Abrahart, 2000) specializes in spatially explicit models that make use of high-speed
computation to simulate future outcomes on the Earth's surface. Such models have been
developed for the behavior of individuals in crowds (Haklay et al., 2001); for the impacts
of human decisions on land use (Chapter 21; Clarke et al., 1997;
http://www.cipec.org/research/biocomplexity/); and for many other spatially distributed
social phenomena. In Chapter 4, Benenson shows how a spatially explicit model of agent
behavior can be used to gain insights into processes of residential segregation. In Chapter
5, O'Sullivan examines broader issues of agent-based modeling, including data
requirements and model validation.
A spatially explicit theory might be defined as a theory whose outcomes depend on the
locations of the objects that are the focus of the theory. It follows that one or more spatial
concepts, such as distance, location, connectivity, adjacency, or direction, must appear in
the theory. A good example is the spatial interaction model, a basis for predicting
migration, communication, or travel between places over space (Fotheringham and
O'Kelly, 1989; Haynes and Fotheringham, 1984) that has several theoretical roots. The
quantity of interaction is modeled as the product of an origin factor or tendency to
generate interaction, such as population; a destination factor or tendency to attract
interaction, such as the number of job opportunities; and a factor that is a decreasing
function of the spatial separation between origin and destination.
One of the significant attractions of space as a basis for modeling stems from the means
used to assess a model's success. Consider, for example, the use of a spatially explicit
model to predict the evolution of land use in an area, as a result of urban growth. The
model will make use of spatially explicit starting conditions, such as the existing state of
urbanization at the beginning of the modeled period, the availability of developable land,
and proximity to existing transportation infrastructure. Included in the model's algorithm
are random components, designed to produce a range of outcomes in the form of future
patterns of development. None of these outcomes can be reasonably expected to match
the actual future pattern of land use, raising the question of how the model can be
validated. Typically, success is measured by the degree to which the gross spatial
characteristics of the outcome match actual patterns– in terms of the degree of
fragmentation of urban land use, or the degree of dispersion around urban centers and
infrastructure.
In summary, space is important in modeling and theory because it accounts for the effects
of separation and imperfect communication between parts of a social system; because it
allows the modeler to include the impact of heterogeneous spaces on model outcomes;
and because the spatial properties of predictions are an important basis for assessment of
model success. But although space is important, it is not at all clear that space can
actually explain, or whether the spatial concepts that appear in a spatially explicit theory
are not merely surrogates for something else (Harvey, 1969; Sack, 1972). For example,
the distance term that appears in the spatial interaction model can be interpreted as
measuring the costs of transportation that ultimately account for decreasing interaction
with distance, or as reflecting the correlation that exists between distance and human
communication (this issue of the relationship between social interaction and space is the
focus of Chapter 7, where Eagles et al. examine the spatial structure of political
networks, and of Chapter 20, where Guldmann describes models of international
telecommunication flows). The information-theoretic basis for the spatial interaction
model popularized by Wilson (1970) ascribes a rather different role to distance, arguing
that the model represents merely the most likely allocation of trips given knowledge of
the average or total distance traveled; but again, this can hardly be interpreted as using
distance to explain interaction.
GEOGRAPHIC INFORMATION SYSTEMS
At least some of the current interest in space in social science, and in other areas of
science that deal with the Earth's surface, has to do with the emergence over the past
three decades of a class of software known as geographic information systems (GIS).
Like many other classes of software, this one owes its success in part to the economies of
scale that result from integrating computer functions that operate on a particular class of
information, in this case geographic information. Similar scale-economies obtain for
word-processing software (functions operating on digital text) or spreadsheets (functions
operating on digital tables). Although geographic information seems particularly well
defined, as information about phenomena on the Earth's surface, the large number of
ways of creating digital representations of such information has ensured that GIS is a
particularly complex computer application. Nevertheless it has become popular, in areas
ranging from resource management to marketing, and from academic research to the
operations of utility companies. Longley et al. (2001) provide an introductory text, and
Longley et al. (1999) a comprehensive review of the state of the GIS art. Social science
applications are reviewed in many of the major texts, and particularly in the text by
Martin (1996).
A modern GIS contains functions for the creation, acquisition, editing, and storage of
geographic information; for query, analysis, and modeling; and for visual display, report
generation, and other forms of output. It supports geographic features represented as
points, lines, or areas, defining their locations with the use of coordinates in so-called
vector representations; and also continuous geographic variation over regular grids
known as rasters. It supports the easy integration of tabular data with representations of
reporting zone boundaries, and thus the preparation of maps and other more sophisticated
forms of data display, such as ESDA.
GIS is grounded in geographic space, and treats the boundaries of reporting zones as
features superimposed on the geographic continuum. Standard tools allow data from
neighboring zones to be compared and aggregated, and areal interpolation tools allow
statistics for one set of reporting zones to be estimated from known values for a second,
incompatible set of reporting zones (Goodchild et al., 1993). Openshaw (1983) and
others have explored the importance of reporting zone boundaries in conditioning what
can be learned about social processes, a theme that is explored further by Sampson and
Morenoff in Chapter 8 and by Rey in Chapter 15.
GIS has made tools for mapping and many of the methods of spatial analysis readily
accessible to researchers. GIS courses and programs are now taught on almost all
university campuses, in community colleges, and even in high schools; and courses and
programs are readily available over the WWW. In effect, a GIS is to spatial social science
as a word processor is to writing, or a statistics package is to statistical analysis– an
indispensable modern tool for working with a particular type of information. Some of the
reasons for the popularity of GIS are explored in the next section, on the role of space in
the integration of data, processes, and disciplines.
SPACE AS A BASIS FOR INTEGRATION
A neophyte's first view of GIS is often of some version of the layer-cake model, a
representation of phenomena on the Earth's surface as a series of layers, each layer
representing a distinct variable or class of phenomena. The model graces the cover of
several introductory GIS texts (e.g., Star and Estes, 1990), and its roots extend back
several centuries. McHarg (1969) was influential in promoting the model as a basis for
landscape architecture and other design disciplines, arguing that one could represent the
factors impacting a development, or impacted by it, as a series of transparent layers, with
the strongest impact corresponding to the greatest opaqueness; by overlaying the layers,
one could visualize the locations of least total impact.
McHarg's concept received a massive boost with the advent of GIS, since the tools to
perform the necessary redrafting of maps onto transparencies, reclassification into
measures of impact, registration of layers to a common base, and if necessary
transformation to a common projection, could all be handled easily by standard functions.
The layer-cake thus became an important icon of the ability of GIS to integrate data on
different topics from different sources, and to support the investigation of spatial
correlations and spatial context. Users could easily compare one layer to another,
combining information on environmental pollution with the ethnicity of neighborhoods,
or rates of disease. Today, it is possible to use standard interfaces between GIS software
and the Internet (e.g., the Geography Network, http://www.geographynetwork.com),
along with the resources of massive public archives of geographic information (e.g.,
http://www.fgdc.gov/clearinghouse/, http://www.alexandria.ucsb.edu) to integrate,
visualize, and analyze data about virtually any location on the planet, at spatial
resolutions ranging down to 1m.
The role of space as a mechanism of integration appears to be unique; although one might
imagine integrating information based on time, it makes much more sense to integrate
data about a historic period specifically for some geographic location, than for all
locations. For example, there would be much more interest in all information about 15th
Century Paris than about the 15th Century anywhere; but someone researching
contemporary Paris might well be interested in information about Paris in earlier periods.
In essence, we argue that space trumps time alone as a basis for integration, but space and
time trump space.
Recently, the idea of using space to integrate information has been extended beyond
digital maps and images to any information that can be related to the Earth's surface– in
other words, information with a geographic footprint. The traditional library has relied on
author, title, and subject as the keys to its catalog. Although one might imagine using
geographic location as a key, the technical difficulties associated with doing so in a
traditional library are profound. But they are comparatively trivial in a digital library, and
several WWW sites now support search of their information archives using geographic
location as a primary key. One can, for example, search the site of the Environmental
Protection Agency (http://www.epa.gov) for all information related to a particular area,
such as a ZIP code. A geolibrary (NRC, 1999) is defined as a digital library that is
searchable by geographic location, returning maps, images, reports, photographs, and
even pieces of music identified with a particular location.
But the integration argument can be extended further. The behavior of human societies is
best understood in terms of distinct processes– economic, political, or social– that are
studied somewhat in isolation by different disciplines (economics, political science, and
sociology respectively). Although researchers pursue knowledge that is general, the
implications of that knowledge are felt locally, in the particular circumstances of specific
locations. In the development of local policy, the reductionist approach that allocates
processes to different disciplines is counter-productive, since it encourages social policies
that ignore economics, and economic policies that ignore politics. Just as space provides
an integrating mechanism for data, then, we argue that space can provide an integrating
mechanism for the social sciences, and a mechanism for linking science to policy. In
Chapter 2, Boucek and Moran show the importance of this principle in their studies of
land cover changes in Brazil and Thailand, where a spatially explicit landscape proves to
be the essential key to unraveling and understanding the complex interactions of social
and physical processes. And in a very different context, Shen in Chapter 13 shows the
value of space as an integrating mechanism for research on urban transportation and
communication.
This concept is aptly captured in the design of GIS. Essentially a GIS consists of two
components: the database, representing the conditions on the Earth's surface in the
studied area; and the functions, algorithms, methods, models, and database design that are
largely independent of location, in the sense that they could potentially be applied to data
from anywhere. The database is thus idiographic and specific to the studied area; while
the other components of the system are nomothetic, representing general procedures and
scientific knowledge. Thus the GIS is a potential key to linking science to local policy–
both a tool for scientific discovery, and a means for delivering discovered scientific
knowledge in local areas.
TOWARDS SPATIALLY INTEGRATED SOCIAL SCIENCE
The previous two sections outlined the arguments for space as important in social
science, and as a basis for integrating the work of social science disciplines, and
delivering that work in practical contexts. As we noted earlier, these are the arguments
we used in founding the Center for Spatially Integrated Social Science (CSISS) at the
University of California, Santa Barbara. This section outlines the work of the center, and
its role in this book.
In the physical sciences the concept of research infrastructure has a long and successful
history. Systems like the Hubble Telescope are extremely expensive, and can only be
justified if designed to serve the needs of many different scientific experiments, by many
different research groups. Just as insurance companies spread risk over large groups of
insured, so such infrastructure projects spread their costs over large research
communities. But the concept of research infrastructure has never penetrated the social
sciences to the same degree, except in the case of large surveys and large data archives, in
part because infrastructure is too strongly associated with large items of equipment. But
computational tools, research skills, and the publication system are also arguably research
infrastructure, and the costs of the investments they represent are spread over large
communities, even in the social sciences. We argued in the CSISS proposal that because
spatial methods are relevant to many social scientists, investments in learning about them,
automating them in computational tools, and sharing success with them could
legitimately be regarded as research infrastructure.
Funding for CSISS began in October, 1999, with an initial five-year commitment by the
National Science Foundation. The CSISS mission "recognizes the growing significance
of space, spatiality, location, and place in social science research. It seeks to develop
unrestricted access to tools and perspectives that will advance the spatial analytic
capabilities of researchers throughout the social sciences." CSISS has since developed
seven programs, all aimed at facilitating the use of spatial perspectives in the social
sciences:
•
•
•
•
•
•
•

A program of national workshops, offered each summer for one-week periods to
young researchers in the social sciences, and focusing on GIS, mapping, spatial
analysis, and related topics.
Specialist meetings, which bring together senior researchers interested in major
themes in the social sciences, such as spatial equity, to identify needed
investments in infrastructure to support research in the theme.
A virtual community of scholars interested in spatial perspectives, with WWW
resources that include search engines and bibliographies.
A program to enhance the computational tools available for GIS and spatial
analysis, being conducted at the University of Illinois at Urbana-Champaign
under the directorship of Luc Anselin.
Efforts to develop facilities for searching social science data archives based on
geographic location.
A collection of learning resources, and pointers from the CSISS WWW site to
other resources aimed at facilitating a spatial perspective.
A program to encourage best practices in spatially integrated social science.

This book is the most important outcome of the last of these programs, and in the next
section we describe our objectives and the process used to assemble the book.
OBJECTIVES OF THE BOOK
Our objective in assembling this book has been to illustrate the application of spatial
perspectives across the breadth of the social sciences, without respect to discipline, and
by doing so to encourage others to follow similar paths; to improve on them; and to apply
them in new areas. The objective is thus fully consistent with our theme of spatially
integrated social science. The term "best practices" is controversial and misleading, but it
does convey the notion of leading by example, and reflects our attempt to identify leaders
in the application of spatial perspectives in different disciplines and subdisciplines.
We used a fairly complex process to assemble the book. We began by searching the
social science literature and citation indices to find publications that used spatial
perspectives, and that were frequently cited– in other words, publications that were in
some sense seminal or groundbreaking. From this analysis we selected a tentative group
of authors, and commissioned them to write to the theme of the book, with an emphasis
on the process of science, from problem formulation to generalizable conclusions. We
deliberately allowed the subject matter to span the range from largely empirical studies,
to surveys of studies, to more theoretical contributions, hoping thereby to represent the
range of research styles in the social sciences. We also allowed the chapters to range from
the very intuitive to the conceptually complex, again reflecting the range of practice. We
reviewed and edited the drafts, striving for a consistent style and adherence to the
objectives.
Such a diverse collection of material might be organized in any number of ways, each
reflecting one dimension of the range of material. After much debate we decided to use a
cross-cutting theme that speaks directly to the spatial focus and our desire to blur the
boundaries of the disciplines: the spatial resolution of the project, from the local to the
global. To study the individual from a spatial perspective one needs sufficient spatial
resolution to identify the individual, which means on the order of 1m; while to study the
interactions between large aggregates, such as nations, a spatial resolution as coarse as
10km might be adequate. Of course few if any studies in the social sciences use such
strictly uniform notions of spatial resolution, preferring to work with units such as
counties that may vary by as much as a factor of several hundred in linear dimension in
the U.S. (between a Virginia city-county and San Bernardino County, for example); and
in Chapter 11 Daly and Lock demonstrate the value of an explicitly multi-scale approach
in spatial archaeology. Nevertheless there are clear differences between studies of
individuals, neighborhoods, cities, regions, and nations that are reflected in distinct
methodologies and theoretical frameworks.
The book is structured as a series of sections, each containing chapters using a similar
level of spatial resolution, and each beginning with an introduction that explains the
relationship between the chapters, and between the section and the rest of the book. The
book is not intended to be read from cover to cover, though we would of course be very
happy if some chose to do that. Rather, we hope the book will be mined for examples,
parallels, analogies, and other aids to lateral thinking about research in the social
sciences. As such, we hope we have contributed to the development of research
infrastructure, and to the growing importance of space in the social sciences.
ACKNOWLEDGMENT
Many people have contributed to the development of this volume, and to this and other
CSISS programs. In addition to the authors, we thank in particular Ben Sprague, who
undertook much of the final assembly; Jorge Sifuentes and David Fearon, who conducted
the earlier citation research; the staff of CSISS, including LaNell Lucius, Christian
Brown, Gamaiel *. We as editors are of course solely responsible for any errors.
…
REFERENCES
Abel, D.J. and D.M. Mark, 1990. A comparative analysis of some 2-dimensional
orderings. International Journal of Geographical Information Systems 4(1): 21-31.
Anselin, L., 1995. Local indicators of spatial association– LISA. Geographical Analysis
27: 93-115.
Anselin, L., 1999. Interactive techniques and exploratory spatial data analysis. In P.A.
Longley, M.F. Goodchild, D.J. Maguire, and D.W. Rhind, editors, Geographical
Information Systems: Principles, Techniques, Management and Applications. New York:
Wiley, pp. 253-266.
Atkinson, P. and D. Martin, editors, 2000. GIS and Geocomputation. London: Taylor and
Francis.
Bailey, T.C. and A.C. Gatrell, 1995. Interactive Spatial Data Analysis. New York: Wiley.
Brunsdon, C., A.S. Fotheringham, and M. Charlton, 1999. Some notes on parametric
significance tests for geographically weighted regression. Journal of Regional Science
39(3): 497-524.
Clarke, K.C., S. Hoppen, and L. Gaydos, 1997. A self-modifying cellular automaton
model of historical urbanization in the San Francisco Bay area. Environment and
Planning B: Planning and Design 24(2): 247-261.
Dorling, D., 1995. A New Social Atlas of Britain. Chichester, UK: Wiley.
Fotheringham, A.S. and C. Brunsdon, 1999. Local forms of spatial analysis.
Geographical Analysis 31(4): 340-358.
Fotheringham, A.S., C. Brunsdon, and M. Charlton, 2000. Quantitative Geography:
Perspectives on Spatial Data Analysis. London: Sage.
Fotheringham, A.S., M.E. Charlton, and C. Brunsdon, 1998. Geographically weighted
regression: a natural evolution of the expansion method for spatial data analysis.
Environment and Planning A 30(11): 1905-1927.
Fotheringham, A.S. and M.E. O'Kelly, 1989. Spatial Interaction Models: Formulations
and Applications. Dordrecht: Kluwer.
Getis, A. and J.K. Ord, 1992. The analysis of spatial association by use of distance
statistics. Geographical Analysis 24: 189-206.
Gilbert, E.W., 1958. Pioneer maps of health and disease in England. Geographical
Journal 124: 172-183.
Goodchild, M.F., 1992. Analysis. In R.F. Abler, M.G. Marcus, and J.M. Olson, editors,
Geography's Inner Worlds: Pervasive Themes in Contemporary American Geography.
New Bruswick, NJ: Rutgers University Press, pp. 138-162.
Goodchild, M.F., L. Anselin, and U. Deichmann, 1993. A framework for the areal
interpolation of socioeconomic data. Environment and Planning A 25: 383-397.
Goodchild, M.F., L. Anselin, R.P. Appelbaum, and B.H. Harthorn, 2000. Toward
spatially integrated social science. International Regional Science Review 23(2): 139159.
Haklay, M., T. Schelhorn, D. O'Sullivan, and M. Thurstain-Goodwin, 2001. 'So go down
town': Simulating pedestrian movement in town centres. Environment and Planning B:
Planning and Design 28(3): 343-59.
Harvey, D., 1969. Explanation in Geography. London: Edward Arnold.
Haynes, K.E. and A.S. Fotheringham, 1984. Gravity and Spatial Interaction Models.
Beverly Hills, CA: Sage.
Johnston, R.J., 1991. Geography and Geographers: Anglo-American Geography since
1945. 4th Edition. London: Edward Arnold.
Longley, P.A., S.M. Brooks, R. McDonnell, and W. Macmillan, editors, 1998.
Geocomputation: A Primer. New York: Wiley.
Longley, P.A., M.F. Goodchild, D.J. Maguire, and D.W. Rhind, editors, 1999.
Geographical Information Systems: Principles, Techniques, Management and
Applications. New York: Wiley.
Longley, P.A., M.F. Goodchild, D.J. Maguire, and D.W. Rhind, 2001. Geographic
Information Systems and Science. New York: Wiley.
Martin, D., 1996. Geographic Information Systems: Socioeconomic Applications. 2nd
Edition. London: Routledge.
McHarg, I.L., 1969. Design with Nature. Garden City, NY: Natural History Press.
Mitchell, A., 1999. The ESRI Guide to GIS Analysis. Redlands, CA: ESRI Press.
Monmonier, M.S., 1991. How to Lie with Maps. Chicago: University of Chicago Press.
National Research Council, 1999. Distributed Geolibraries: Spatial Information
Resources. Washington, DC: National Academy Press.
Nicol, A.A.M and P.M. Pexman, 1999. Presenting Your Findings: A Practical Guide for
Creating Tables. Washington, DC: American Psychological Association.
Openshaw, S., 1983. The Modifiable Areal Unit Problem. Concepts and Techniques in
Modern Geography No. 38. Norwich, UK: GeoBooks.
Openshaw, S. and R.J. Abrahart, editors, 2000. Geocomputation. New York: Taylor and
Francis.
Peuquet, D.J., 2002. Representations of Space and Time. New York: Guilford.
Sack, R.D., 1972. Geography, geometry, and explanation. Annals of the Association of
American Geographers 62: 61-78.
Star, J. and J.E. Estes, 1990. Geographic Information Systems: An Introduction.
Englewood Cliffs, NJ: Prentice Hall.
Tufte, E.R., 1983. The Visual Display of Quantitative Information. Cheshire, CT:
Graphics Press.
Tukey, J.W., 1977. Exploratory Data Analysis. Reading, MA: Addison-Wesley.
Wilson, A.G., 1970. Entropy in Urban and Regional Modelling. London: Pion.
Figure 1. The map made by Dr John Snow of the incidence of cholera during an outbreak in the Soho
district of London in 1854. The contaminated water pump is located at the center of the map, just to the
right of the D in Broad Street. (Source: Gilbert, 1958). (*Permission will have to be obtained from the
Geographical Journal. The best source I have is a reproduction in Goodchild, M.F., 1992. Analysis. In R.F.
Abler, M.G. Marcus, and J.M. Olson, editors, Geography's Inner Worlds: Pervasive Themes in
Contemporary American Geography. New Brunswick, NJ: Rutgers University Press, pp. 138-162.)

Más contenido relacionado

Similar a 391 pensando espacialmente

Sampling and Probability in Geography
Sampling and Probability in Geography Sampling and Probability in Geography
Sampling and Probability in Geography Prof Ashis Sarkar
 
4th Grade Geography Workshop
4th Grade Geography Workshop4th Grade Geography Workshop
4th Grade Geography Workshopprimarysource
 
Process_Method_versus_The_Hypothesis_Method
Process_Method_versus_The_Hypothesis_MethodProcess_Method_versus_The_Hypothesis_Method
Process_Method_versus_The_Hypothesis_MethodRichard Wilkie
 
TYBSC IT PGIS Unit I Chapter II Geographic Information and Spacial Database
TYBSC IT PGIS Unit I Chapter II Geographic Information and Spacial DatabaseTYBSC IT PGIS Unit I Chapter II Geographic Information and Spacial Database
TYBSC IT PGIS Unit I Chapter II Geographic Information and Spacial DatabaseArti Parab Academics
 
Assessing Spatial Thinking Ability
Assessing Spatial Thinking AbilityAssessing Spatial Thinking Ability
Assessing Spatial Thinking AbilityAmy Roman
 
Transparencies ch06-pp248-273
Transparencies ch06-pp248-273Transparencies ch06-pp248-273
Transparencies ch06-pp248-273lschmidt1170
 
Chapter 1 basic concepts
Chapter 1 basic conceptsChapter 1 basic concepts
Chapter 1 basic conceptsbryankrouse
 
Spatial data analysis 2
Spatial data analysis 2Spatial data analysis 2
Spatial data analysis 2Johan Blomme
 
A Critical Review of High and Very High-Resolution Remote Sensing Approaches ...
A Critical Review of High and Very High-Resolution Remote Sensing Approaches ...A Critical Review of High and Very High-Resolution Remote Sensing Approaches ...
A Critical Review of High and Very High-Resolution Remote Sensing Approaches ...rsmahabir
 
Phenomenological Structuring of Geographic Information
Phenomenological Structuring of Geographic InformationPhenomenological Structuring of Geographic Information
Phenomenological Structuring of Geographic InformationRobert (Bob) Williams
 
Exploring our geographic world by tessie calimag bb.
Exploring our geographic world by tessie calimag bb.Exploring our geographic world by tessie calimag bb.
Exploring our geographic world by tessie calimag bb.Tessie Calimag
 
Exploring our geographic world by tessie calimag bb.
Exploring our geographic world by tessie calimag bb.Exploring our geographic world by tessie calimag bb.
Exploring our geographic world by tessie calimag bb.Tessie Calimag
 
Spatial statistics presentation Texas A&M Census RDC
Spatial statistics presentation Texas A&M Census RDCSpatial statistics presentation Texas A&M Census RDC
Spatial statistics presentation Texas A&M Census RDCCorey Sparks
 

Similar a 391 pensando espacialmente (20)

Sampling and Probability in Geography
Sampling and Probability in Geography Sampling and Probability in Geography
Sampling and Probability in Geography
 
4th Grade Geography Workshop
4th Grade Geography Workshop4th Grade Geography Workshop
4th Grade Geography Workshop
 
Process_Method_versus_The_Hypothesis_Method
Process_Method_versus_The_Hypothesis_MethodProcess_Method_versus_The_Hypothesis_Method
Process_Method_versus_The_Hypothesis_Method
 
TYBSC IT PGIS Unit I Chapter II Geographic Information and Spacial Database
TYBSC IT PGIS Unit I Chapter II Geographic Information and Spacial DatabaseTYBSC IT PGIS Unit I Chapter II Geographic Information and Spacial Database
TYBSC IT PGIS Unit I Chapter II Geographic Information and Spacial Database
 
Assessing Spatial Thinking Ability
Assessing Spatial Thinking AbilityAssessing Spatial Thinking Ability
Assessing Spatial Thinking Ability
 
Transparencies ch06-pp248-273
Transparencies ch06-pp248-273Transparencies ch06-pp248-273
Transparencies ch06-pp248-273
 
10.1.1.17.1245
10.1.1.17.124510.1.1.17.1245
10.1.1.17.1245
 
Cartographic data structures
Cartographic data structuresCartographic data structures
Cartographic data structures
 
Chapter 1 basic concepts
Chapter 1 basic conceptsChapter 1 basic concepts
Chapter 1 basic concepts
 
Spatial data analysis 2
Spatial data analysis 2Spatial data analysis 2
Spatial data analysis 2
 
A Critical Review of High and Very High-Resolution Remote Sensing Approaches ...
A Critical Review of High and Very High-Resolution Remote Sensing Approaches ...A Critical Review of High and Very High-Resolution Remote Sensing Approaches ...
A Critical Review of High and Very High-Resolution Remote Sensing Approaches ...
 
Ontologie informatiche della geografia: una sistematizzazione del dibattito c...
Ontologie informatiche della geografia: una sistematizzazione del dibattito c...Ontologie informatiche della geografia: una sistematizzazione del dibattito c...
Ontologie informatiche della geografia: una sistematizzazione del dibattito c...
 
Phenomenological Structuring of Geographic Information
Phenomenological Structuring of Geographic InformationPhenomenological Structuring of Geographic Information
Phenomenological Structuring of Geographic Information
 
AIC Darwin Phenomenology 1990
AIC Darwin Phenomenology 1990AIC Darwin Phenomenology 1990
AIC Darwin Phenomenology 1990
 
Gagnon Spatial Structure And Disparities
Gagnon Spatial Structure And DisparitiesGagnon Spatial Structure And Disparities
Gagnon Spatial Structure And Disparities
 
Exploring our geographic world by tessie calimag bb.
Exploring our geographic world by tessie calimag bb.Exploring our geographic world by tessie calimag bb.
Exploring our geographic world by tessie calimag bb.
 
Exploring our geographic world by tessie calimag bb.
Exploring our geographic world by tessie calimag bb.Exploring our geographic world by tessie calimag bb.
Exploring our geographic world by tessie calimag bb.
 
Spatial statistics presentation Texas A&M Census RDC
Spatial statistics presentation Texas A&M Census RDCSpatial statistics presentation Texas A&M Census RDC
Spatial statistics presentation Texas A&M Census RDC
 
Ch1
Ch1Ch1
Ch1
 
B00624300_AlfredoConetta_EGM716_MAUP_Projectc
B00624300_AlfredoConetta_EGM716_MAUP_ProjectcB00624300_AlfredoConetta_EGM716_MAUP_Projectc
B00624300_AlfredoConetta_EGM716_MAUP_Projectc
 

Último

Hotel And Home Service Available Kolkata Call Girls Park Street ✔ 6297143586 ...
Hotel And Home Service Available Kolkata Call Girls Park Street ✔ 6297143586 ...Hotel And Home Service Available Kolkata Call Girls Park Street ✔ 6297143586 ...
Hotel And Home Service Available Kolkata Call Girls Park Street ✔ 6297143586 ...ritikasharma
 
Almora call girls 📞 8617697112 At Low Cost Cash Payment Booking
Almora call girls 📞 8617697112 At Low Cost Cash Payment BookingAlmora call girls 📞 8617697112 At Low Cost Cash Payment Booking
Almora call girls 📞 8617697112 At Low Cost Cash Payment BookingNitya salvi
 
Jodhpur Park ( Call Girls ) Kolkata ✔ 6297143586 ✔ Hot Model With Sexy Bhabi ...
Jodhpur Park ( Call Girls ) Kolkata ✔ 6297143586 ✔ Hot Model With Sexy Bhabi ...Jodhpur Park ( Call Girls ) Kolkata ✔ 6297143586 ✔ Hot Model With Sexy Bhabi ...
Jodhpur Park ( Call Girls ) Kolkata ✔ 6297143586 ✔ Hot Model With Sexy Bhabi ...ritikasharma
 
📞 Contact Number 8617697112 VIP East Sikkim Call Girls
📞 Contact Number 8617697112 VIP East Sikkim Call Girls📞 Contact Number 8617697112 VIP East Sikkim Call Girls
📞 Contact Number 8617697112 VIP East Sikkim Call GirlsNitya salvi
 
Top Rated Pune Call Girls Dhayari ⟟ 6297143586 ⟟ Call Me For Genuine Sex Ser...
Top Rated  Pune Call Girls Dhayari ⟟ 6297143586 ⟟ Call Me For Genuine Sex Ser...Top Rated  Pune Call Girls Dhayari ⟟ 6297143586 ⟟ Call Me For Genuine Sex Ser...
Top Rated Pune Call Girls Dhayari ⟟ 6297143586 ⟟ Call Me For Genuine Sex Ser...Call Girls in Nagpur High Profile
 
Hotel And Home Service Available Kolkata Call Girls Sonagachi ✔ 6297143586 ✔C...
Hotel And Home Service Available Kolkata Call Girls Sonagachi ✔ 6297143586 ✔C...Hotel And Home Service Available Kolkata Call Girls Sonagachi ✔ 6297143586 ✔C...
Hotel And Home Service Available Kolkata Call Girls Sonagachi ✔ 6297143586 ✔C...ritikasharma
 
(TOP CLASS) Call Girls In Nungambakkam Phone 7427069034 Call Girls Model With...
(TOP CLASS) Call Girls In Nungambakkam Phone 7427069034 Call Girls Model With...(TOP CLASS) Call Girls In Nungambakkam Phone 7427069034 Call Girls Model With...
(TOP CLASS) Call Girls In Nungambakkam Phone 7427069034 Call Girls Model With... Shivani Pandey
 
Behala ( Call Girls ) Kolkata ✔ 6297143586 ✔ Hot Model With Sexy Bhabi Ready ...
Behala ( Call Girls ) Kolkata ✔ 6297143586 ✔ Hot Model With Sexy Bhabi Ready ...Behala ( Call Girls ) Kolkata ✔ 6297143586 ✔ Hot Model With Sexy Bhabi Ready ...
Behala ( Call Girls ) Kolkata ✔ 6297143586 ✔ Hot Model With Sexy Bhabi Ready ...ritikasharma
 
𓀤Call On 6297143586 𓀤 Ultadanga Call Girls In All Kolkata 24/7 Provide Call W...
𓀤Call On 6297143586 𓀤 Ultadanga Call Girls In All Kolkata 24/7 Provide Call W...𓀤Call On 6297143586 𓀤 Ultadanga Call Girls In All Kolkata 24/7 Provide Call W...
𓀤Call On 6297143586 𓀤 Ultadanga Call Girls In All Kolkata 24/7 Provide Call W...rahim quresi
 
VIP Model Call Girls Koregaon Park ( Pune ) Call ON 8005736733 Starting From ...
VIP Model Call Girls Koregaon Park ( Pune ) Call ON 8005736733 Starting From ...VIP Model Call Girls Koregaon Park ( Pune ) Call ON 8005736733 Starting From ...
VIP Model Call Girls Koregaon Park ( Pune ) Call ON 8005736733 Starting From ...SUHANI PANDEY
 
Book Sex Workers Available Kolkata Call Girls Service Airport Kolkata ✔ 62971...
Book Sex Workers Available Kolkata Call Girls Service Airport Kolkata ✔ 62971...Book Sex Workers Available Kolkata Call Girls Service Airport Kolkata ✔ 62971...
Book Sex Workers Available Kolkata Call Girls Service Airport Kolkata ✔ 62971...ritikasharma
 
Navsari Escorts Service ☎️ 6378878445 ( Sakshi Sinha ) High Profile Call Girl...
Navsari Escorts Service ☎️ 6378878445 ( Sakshi Sinha ) High Profile Call Girl...Navsari Escorts Service ☎️ 6378878445 ( Sakshi Sinha ) High Profile Call Girl...
Navsari Escorts Service ☎️ 6378878445 ( Sakshi Sinha ) High Profile Call Girl...mriyagarg453
 
Verified Trusted Call Girls Singaperumal Koil Chennai ✔✔7427069034 Independe...
Verified Trusted Call Girls Singaperumal Koil Chennai ✔✔7427069034  Independe...Verified Trusted Call Girls Singaperumal Koil Chennai ✔✔7427069034  Independe...
Verified Trusted Call Girls Singaperumal Koil Chennai ✔✔7427069034 Independe... Shivani Pandey
 
(TOP CLASS) Call Girls In Chengalpattu Phone 7427069034 Call Girls Model With...
(TOP CLASS) Call Girls In Chengalpattu Phone 7427069034 Call Girls Model With...(TOP CLASS) Call Girls In Chengalpattu Phone 7427069034 Call Girls Model With...
(TOP CLASS) Call Girls In Chengalpattu Phone 7427069034 Call Girls Model With... Shivani Pandey
 
Hotel And Home Service Available Kolkata Call Girls Howrah ✔ 6297143586 ✔Call...
Hotel And Home Service Available Kolkata Call Girls Howrah ✔ 6297143586 ✔Call...Hotel And Home Service Available Kolkata Call Girls Howrah ✔ 6297143586 ✔Call...
Hotel And Home Service Available Kolkata Call Girls Howrah ✔ 6297143586 ✔Call...ritikasharma
 
Call Girls Bellandur ☎ 7737669865☎ Book Your One night Stand (Bangalore)
Call Girls Bellandur ☎ 7737669865☎ Book Your One night Stand (Bangalore)Call Girls Bellandur ☎ 7737669865☎ Book Your One night Stand (Bangalore)
Call Girls Bellandur ☎ 7737669865☎ Book Your One night Stand (Bangalore)amitlee9823
 
Kanpur call girls 📞 8617697112 At Low Cost Cash Payment Booking
Kanpur call girls 📞 8617697112 At Low Cost Cash Payment BookingKanpur call girls 📞 8617697112 At Low Cost Cash Payment Booking
Kanpur call girls 📞 8617697112 At Low Cost Cash Payment BookingNitya salvi
 
Hotel And Home Service Available Kolkata Call Girls Lake Town ✔ 6297143586 ✔C...
Hotel And Home Service Available Kolkata Call Girls Lake Town ✔ 6297143586 ✔C...Hotel And Home Service Available Kolkata Call Girls Lake Town ✔ 6297143586 ✔C...
Hotel And Home Service Available Kolkata Call Girls Lake Town ✔ 6297143586 ✔C...ritikasharma
 
𓀤Call On 6297143586 𓀤 Sonagachi Call Girls In All Kolkata 24/7 Provide Call W...
𓀤Call On 6297143586 𓀤 Sonagachi Call Girls In All Kolkata 24/7 Provide Call W...𓀤Call On 6297143586 𓀤 Sonagachi Call Girls In All Kolkata 24/7 Provide Call W...
𓀤Call On 6297143586 𓀤 Sonagachi Call Girls In All Kolkata 24/7 Provide Call W...rahim quresi
 
Sonagachi ( Call Girls ) Kolkata ✔ 6297143586 ✔ Hot Model With Sexy Bhabi Rea...
Sonagachi ( Call Girls ) Kolkata ✔ 6297143586 ✔ Hot Model With Sexy Bhabi Rea...Sonagachi ( Call Girls ) Kolkata ✔ 6297143586 ✔ Hot Model With Sexy Bhabi Rea...
Sonagachi ( Call Girls ) Kolkata ✔ 6297143586 ✔ Hot Model With Sexy Bhabi Rea...rahim quresi
 

Último (20)

Hotel And Home Service Available Kolkata Call Girls Park Street ✔ 6297143586 ...
Hotel And Home Service Available Kolkata Call Girls Park Street ✔ 6297143586 ...Hotel And Home Service Available Kolkata Call Girls Park Street ✔ 6297143586 ...
Hotel And Home Service Available Kolkata Call Girls Park Street ✔ 6297143586 ...
 
Almora call girls 📞 8617697112 At Low Cost Cash Payment Booking
Almora call girls 📞 8617697112 At Low Cost Cash Payment BookingAlmora call girls 📞 8617697112 At Low Cost Cash Payment Booking
Almora call girls 📞 8617697112 At Low Cost Cash Payment Booking
 
Jodhpur Park ( Call Girls ) Kolkata ✔ 6297143586 ✔ Hot Model With Sexy Bhabi ...
Jodhpur Park ( Call Girls ) Kolkata ✔ 6297143586 ✔ Hot Model With Sexy Bhabi ...Jodhpur Park ( Call Girls ) Kolkata ✔ 6297143586 ✔ Hot Model With Sexy Bhabi ...
Jodhpur Park ( Call Girls ) Kolkata ✔ 6297143586 ✔ Hot Model With Sexy Bhabi ...
 
📞 Contact Number 8617697112 VIP East Sikkim Call Girls
📞 Contact Number 8617697112 VIP East Sikkim Call Girls📞 Contact Number 8617697112 VIP East Sikkim Call Girls
📞 Contact Number 8617697112 VIP East Sikkim Call Girls
 
Top Rated Pune Call Girls Dhayari ⟟ 6297143586 ⟟ Call Me For Genuine Sex Ser...
Top Rated  Pune Call Girls Dhayari ⟟ 6297143586 ⟟ Call Me For Genuine Sex Ser...Top Rated  Pune Call Girls Dhayari ⟟ 6297143586 ⟟ Call Me For Genuine Sex Ser...
Top Rated Pune Call Girls Dhayari ⟟ 6297143586 ⟟ Call Me For Genuine Sex Ser...
 
Hotel And Home Service Available Kolkata Call Girls Sonagachi ✔ 6297143586 ✔C...
Hotel And Home Service Available Kolkata Call Girls Sonagachi ✔ 6297143586 ✔C...Hotel And Home Service Available Kolkata Call Girls Sonagachi ✔ 6297143586 ✔C...
Hotel And Home Service Available Kolkata Call Girls Sonagachi ✔ 6297143586 ✔C...
 
(TOP CLASS) Call Girls In Nungambakkam Phone 7427069034 Call Girls Model With...
(TOP CLASS) Call Girls In Nungambakkam Phone 7427069034 Call Girls Model With...(TOP CLASS) Call Girls In Nungambakkam Phone 7427069034 Call Girls Model With...
(TOP CLASS) Call Girls In Nungambakkam Phone 7427069034 Call Girls Model With...
 
Behala ( Call Girls ) Kolkata ✔ 6297143586 ✔ Hot Model With Sexy Bhabi Ready ...
Behala ( Call Girls ) Kolkata ✔ 6297143586 ✔ Hot Model With Sexy Bhabi Ready ...Behala ( Call Girls ) Kolkata ✔ 6297143586 ✔ Hot Model With Sexy Bhabi Ready ...
Behala ( Call Girls ) Kolkata ✔ 6297143586 ✔ Hot Model With Sexy Bhabi Ready ...
 
𓀤Call On 6297143586 𓀤 Ultadanga Call Girls In All Kolkata 24/7 Provide Call W...
𓀤Call On 6297143586 𓀤 Ultadanga Call Girls In All Kolkata 24/7 Provide Call W...𓀤Call On 6297143586 𓀤 Ultadanga Call Girls In All Kolkata 24/7 Provide Call W...
𓀤Call On 6297143586 𓀤 Ultadanga Call Girls In All Kolkata 24/7 Provide Call W...
 
VIP Model Call Girls Koregaon Park ( Pune ) Call ON 8005736733 Starting From ...
VIP Model Call Girls Koregaon Park ( Pune ) Call ON 8005736733 Starting From ...VIP Model Call Girls Koregaon Park ( Pune ) Call ON 8005736733 Starting From ...
VIP Model Call Girls Koregaon Park ( Pune ) Call ON 8005736733 Starting From ...
 
Book Sex Workers Available Kolkata Call Girls Service Airport Kolkata ✔ 62971...
Book Sex Workers Available Kolkata Call Girls Service Airport Kolkata ✔ 62971...Book Sex Workers Available Kolkata Call Girls Service Airport Kolkata ✔ 62971...
Book Sex Workers Available Kolkata Call Girls Service Airport Kolkata ✔ 62971...
 
Navsari Escorts Service ☎️ 6378878445 ( Sakshi Sinha ) High Profile Call Girl...
Navsari Escorts Service ☎️ 6378878445 ( Sakshi Sinha ) High Profile Call Girl...Navsari Escorts Service ☎️ 6378878445 ( Sakshi Sinha ) High Profile Call Girl...
Navsari Escorts Service ☎️ 6378878445 ( Sakshi Sinha ) High Profile Call Girl...
 
Verified Trusted Call Girls Singaperumal Koil Chennai ✔✔7427069034 Independe...
Verified Trusted Call Girls Singaperumal Koil Chennai ✔✔7427069034  Independe...Verified Trusted Call Girls Singaperumal Koil Chennai ✔✔7427069034  Independe...
Verified Trusted Call Girls Singaperumal Koil Chennai ✔✔7427069034 Independe...
 
(TOP CLASS) Call Girls In Chengalpattu Phone 7427069034 Call Girls Model With...
(TOP CLASS) Call Girls In Chengalpattu Phone 7427069034 Call Girls Model With...(TOP CLASS) Call Girls In Chengalpattu Phone 7427069034 Call Girls Model With...
(TOP CLASS) Call Girls In Chengalpattu Phone 7427069034 Call Girls Model With...
 
Hotel And Home Service Available Kolkata Call Girls Howrah ✔ 6297143586 ✔Call...
Hotel And Home Service Available Kolkata Call Girls Howrah ✔ 6297143586 ✔Call...Hotel And Home Service Available Kolkata Call Girls Howrah ✔ 6297143586 ✔Call...
Hotel And Home Service Available Kolkata Call Girls Howrah ✔ 6297143586 ✔Call...
 
Call Girls Bellandur ☎ 7737669865☎ Book Your One night Stand (Bangalore)
Call Girls Bellandur ☎ 7737669865☎ Book Your One night Stand (Bangalore)Call Girls Bellandur ☎ 7737669865☎ Book Your One night Stand (Bangalore)
Call Girls Bellandur ☎ 7737669865☎ Book Your One night Stand (Bangalore)
 
Kanpur call girls 📞 8617697112 At Low Cost Cash Payment Booking
Kanpur call girls 📞 8617697112 At Low Cost Cash Payment BookingKanpur call girls 📞 8617697112 At Low Cost Cash Payment Booking
Kanpur call girls 📞 8617697112 At Low Cost Cash Payment Booking
 
Hotel And Home Service Available Kolkata Call Girls Lake Town ✔ 6297143586 ✔C...
Hotel And Home Service Available Kolkata Call Girls Lake Town ✔ 6297143586 ✔C...Hotel And Home Service Available Kolkata Call Girls Lake Town ✔ 6297143586 ✔C...
Hotel And Home Service Available Kolkata Call Girls Lake Town ✔ 6297143586 ✔C...
 
𓀤Call On 6297143586 𓀤 Sonagachi Call Girls In All Kolkata 24/7 Provide Call W...
𓀤Call On 6297143586 𓀤 Sonagachi Call Girls In All Kolkata 24/7 Provide Call W...𓀤Call On 6297143586 𓀤 Sonagachi Call Girls In All Kolkata 24/7 Provide Call W...
𓀤Call On 6297143586 𓀤 Sonagachi Call Girls In All Kolkata 24/7 Provide Call W...
 
Sonagachi ( Call Girls ) Kolkata ✔ 6297143586 ✔ Hot Model With Sexy Bhabi Rea...
Sonagachi ( Call Girls ) Kolkata ✔ 6297143586 ✔ Hot Model With Sexy Bhabi Rea...Sonagachi ( Call Girls ) Kolkata ✔ 6297143586 ✔ Hot Model With Sexy Bhabi Rea...
Sonagachi ( Call Girls ) Kolkata ✔ 6297143586 ✔ Hot Model With Sexy Bhabi Rea...
 

391 pensando espacialmente

  • 1. THINKING SPATIALLY IN THE SOCIAL SCIENCES Michael F. Goodchild and Donald G. Janelle INTRODUCTION The table of numbers or statistics is such a common way to organize information that we scarcely if ever think about its significance. Tables are used to organize information about states from the decennial census; to report the comparative performance of national economies; to summarize the performance of individual schools in a state; and for a host of other purposes. In most cases a simple convention will have been followed in preparing the table (Nicol and Pexman, 1999). The rows of the table will represent the instances, objects, or cases whose attributes are being reported, and all such objects will be drawn from a homogeneous class, such as counties, states, or nations. Each column of the table represents one of the attributes, allowing the reader to make comparisons by running the eye up or down a column, or by computing statistics such as column means. In all of the instances just listed the objects happen to be geographic, in the sense that they occupy distinct locations on the Earth's surface; in the case of the census these objects might range from regions to states, counties, municipalities, census tracts, or block groups. Tables succeed in organizing information for easy comparison, and for analysis in spreadsheets or statistical packages, but they do so by largely ignoring one particular property of each object: its geographic location. A table of U.S. states ordered alphabetically, for example, places Alabama at the top and Wyoming at the bottom, and in only two instances (Florida and Georgia, Illinois and Indiana) do states that are adjacent geographically appear in adjacent rows in the table. In effect, the table discards any importance that one might attach to geographic location: do states that are near each other geographically tend share common properties, and do such tendencies contribute greater insight into the processes at work on the landscape; or are there instances of states whose attributes are out of line with those of neighboring states? The Census Bureau often addresses this issue by ordering tables by region, so that all states in New England occur together in the table, for example, with each region's states ordered alphabetically within region. But while this allows for easy comparison within regions, and serves to link the contents of the table to whatever else the reader happens to know about New England, it still allows neighboring states to appear far apart in the table, if they happen to lie in different regions; and it can place states that are in the same region next to each other, although they are far apart in space. Clearly it is impossible to order states such that proximity in the table fully captures relative geographic proximity, or a state's geographic context (Abel and Mark, 1990). At another level, one might ask whether states are actually the appropriate units for reporting statistics. Of course one can use larger units that are aggregations of states, such as regions or nations, or smaller units that themselves aggregate to states, such as counties, but the larger question is whether any of the standard reporting units are optimal
  • 2. –whether some quite different way of dividing the U.S. might lead to greater insight. For example, metropolitan regions frequently cross the state boundaries that were drawn somewhat arbitrarily many years ago, and yet are much less than the aggregations of their respective states (e.g., the New York or Kansas City metropolitan regions). States also vary vastly in area, from the more than 1.5m sq km of Alaska to the 3,144 sq km of Rhode Island, confusing any effort to link state-level analysis with processes operating on the landscape over particular ranges of distances. Perhaps the geographic world is better seen as continuous, with reporting zone boundaries somewhat arbitrarily imposed on it. But does this matter, or are geographic location and context irrelevant? Clearly geographic location is important for many purposes, such as wayfinding, but is it important for the purposes of social science, which is the focus of this book? Social science addresses a multitude of domains, using a wide range of methods, but in essence its purposes boil down to three: • • • understanding and explanation of human behavior, and processes involving humans and their actions; prediction of such behaviors and processes, for purposes of planning or commerce; solution of problems that face society, and can be alleviated through knowledge of human behavior. This book is about the role of space, geographic location, and related concepts in such tasks. It rests on two related assertions, which will be addressed in detail in subsequent sections of this introduction, and exemplified in the studies that are described by the book's contributors. First, location (and more generally space) is important, and can contribute substantially to all three of the objectives identified above. Second, location (and space) provide a powerful mechanism for integrating the efforts of the various social sciences. Multidisciplinary efforts are increasingly important in pursuing the objectives of social science, and in understanding the coupling of social and physical processes on the landscape. We argue in the third section of this introduction that space provides one of the few, and perhaps the only basis for such integration. These are the arguments that we made in our successful proposal to the National Science Foundation that led to the establishment in 1999 of the Center for Spatially Integrated Social Science (CSISS) within the National Center for Geographic Information and Analysis at the University of California, Santa Barbara (see http://CSISS.org). In the fourth section of this introduction we briefly review CSISS, and expand on our purposes in putting together this book. Although the focus of this book is on the role of space, many of the points made here can equally well be made about time, or the combination of space and time (Peuquet, 2002). For many purposes spatial should be read as shorthand for spatiotemporal, especially for dynamic phenomena. THE IMPORTANCE OF SPACE
  • 3. In this section we present three arguments for the importance of space as a source of insight and understanding, and as a basis for prediction and the solution of problems. We do not suggest that the set of three is exhaustive– rather, it seems likely that other arguments can also be made. The discussion expands on the arguments presented by Goodchild et al. (1999). It is followed by a short introduction to geographic information systems (GIS), and their impacts on the social sciences. SPATIAL ANALYSIS The terms spatial analysis or spatial data analysis suggest an emphasis on location in the conduct of analysis, or more formally, that results of analysis using any of the techniques falling into this category are dependent in some way on the locations of the objects being analyzed– if the locations change, the results change. Spatial analysis examines data in cross-section, as opposed to longitudinal analysis, or the analysis of temporal series. The decennial snapshots provided by the census are a prominent example of cross-sectional data, because each snapshot provides a picture of the nation's population at one specific date in time. Successive snapshots can in principle be assembled to provide longitudinal series, but the long time intervals between census years and the tendency for the definitions of variables and reporting zones to change makes this a challenging task. Nevertheless, the National Historic GIS project at the University of Minnesota is attempting to build a Web-based resource that will make this possible for the entire period since the first U.S. census (see http://www.nhgis.org). Despite such efforts, however, social scientists must face the fact that cross-sectional data of relevance to social science are much easier to acquire than longitudinal data. Yet the processes that social scientists study occur in time, and reveal their effects in changes on the landscape. How can the study or analysis of data in cross-section lead to insights into behavioral processes– or more broadly, how can spatial analysis lead to scientific understanding in social science? This theme is explored in detail in many chapters of this book; in Chapter 16, for example, Sweeney and Feser discuss our ability to understand business processes from cross-sectional data. The techniques of spatial analysis address the issue that opened this chapter: the loss of spatial context when cross-sectional information is displayed in the form of tables. Suppose, for example, that the same information on comparative performance of national economies, or percentage of home ownership by state, were displayed in the form of a map rather than as a table. In this form it is easy to compare each state's level of home ownership to those of its neighbors, to identify anomalies in the form of states whose levels are out of line with those of their neighbors, and to compare the patterns seen in the map with prior knowledge of each state's characteristics, and those if its neighbors. In essence, the creation of a map is a very simple and intuitive form of spatial analysis; or perhaps more correctly, a way of empowering the human eye and brain to perform intuitive spatial analysis. Just as with any form of information presentation it is subject to manipulation by the map designer, through the inappropriate choice of colors and class intervals (see, for example, Monmonier, 1991); and by insisting on planimetric accuracy
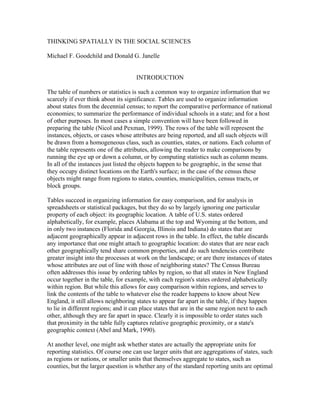
  • 4. maps tend to overemphasize large states, and may make small states almost impossible to see (though cartograms provide an interesting way of adjusting visual emphasis; Dorling, 1995). A multitude of more elaborate forms of spatial analysis have been described in the past few decades, and several excellent texts provide surveys. Bailey and Gatrell (1995) organize their review by data type, providing surveys of techniques suited for the analysis of data based on (1) point observations, such as records of crime locations; (2) aggregations by reporting zones, such as the summary data produced by the census; and (3) interactions between reporting zones, such as data on migrations, trade flows, or commuting patterns. The survey by Fotheringham et al. (2000) is one of the most recent, and includes many techniques developed in the past decade for place-based analysis (see the next section). Mitchell (1999) provides an intuitive survey that is most helpful as a key to understanding the role of GIS in spatial analysis. Spatial analysis can play important roles in both inductive and deductive approaches to science. In an inductive context, the display of data in spatial context may reveal patterns and anomalies, and suggest processes that might account for them. The story of John Snow's use of a map to reinforce the notion that drinking water from a pump in London might have been the cause of an outbreak of cholera in 1854 remains one of the most compelling instances of inference from data viewed in cross-section (Gilbert, 1958; Goodchild, 1992; Tufte, 1983). The map clearly shows a clustering of cholera cases around the pump, reflecting the tendency for people to draw water from the nearest available source (Figure 1). Since then, many other potential causes of disease have been investigated as a result of similar observations of anomalous clustering in cross-sectional data, suggesting causal mechanisms associated with residential or workplace locations that are in turn reflected in georeferenced mortality or morbidity records. Clustering is also the focus of Chapter 6, in which Logan and Zhang examine the varying character of ethnic neighborhoods in contemporary Los Angeles, and of Chapter 19, where Weeks describes the role of clustering in understanding demographic processes. In Chapter 18, Gatrell and Rigby review the role of spatial perspectives in many areas of public health, from epidemiology to health care service delivery. [Figure 1 about here] Cross-sectional data can also be used to test existing theories and principles, in an approach that is more deductive than inductive. But here one must confront an important principle: that the same spatial pattern can be produced by a range of different processes– in other words, that there is no 1:1 correspondence between process through time and pattern in space. For example, even Snow's simple symmetrical clustering of cholera cases around the Broad Street pump could have been caused by contagion, the popular hypothesis for cholera transmission at the time, if the original carrier had also been located in Broad Street, given the tendency for social networks to cluster in space. The principle of Occam's Razor might be invoked to justify adopting the simpler drinking water hypothesis, but although this is amply justified by scientific practice it seems a weak argument in the circumstances. Snow himself was able to have the pump handle
  • 5. removed, and to observe the consequent effect on the outbreak, but today few social scientists can enjoy the luxury of such a controlled experiment on a human population. Thus spatial pattern, and spatial analysis, can rarely if ever be used to confirm theories, though they can certainly be used to deny false ones, and to justify controlled experiments or longitudinal analysis where these are possible. In summary, spatial analysis is perhaps best seen as an exploratory technique, more suitable for the generation of hypotheses and insights than to strict confirmation of theory (a process ably illustrated by Kantner in Chapter 12 in his efforts to reconstruct past behavior from the evidence of prehistoric roadways). As such, however, its presentation of data in visual form, its use of spatial context, and the power of the eye and brain to detect patterns and anomalies and to recall other information about places from memory forms a potent environment for scientific understanding, as the authors demonstrate in several of the chapters of this book. Recently, much technical progress has been made in taking advantage of the capabilities of modern computing environments to go well beyond what has traditionally been possible with data displayed in the form of maps, and the application of routine and somewhat mechanical methods of spatial analysis. In Chapter 3, Kwan and Lee use GISbased tools to visualize individual behavior in space and time, using the capabilities of software to generate dynamic, three-dimensional displays of vast amounts of data. Such methods can reveal patterns and anomalies in behavior that might never be evident in more conventional two-dimensional mapping. Exploratory spatial data analysis (ESDA) builds on the broad success of exploratory data analysis (EDA), a trend towards a more interactive and visual approach to statistical analysis initiated by Tukey and others in statistics in the 1970s (Tukey, 1977). ESDA research has explored several distinct avenues that are variously unique to spatial data. Anselin (1999) emphasizes the importance of spatial autocorrelation, or the tendency for observations that are near eachother in space to have similar values– for "locational similarity (observations in spatial proximity) (to be) matched by value similarity (correlation)". In Chapter 9, Messner and Anselin demonstrate the use of the concept in understanding patterns of homicide. Others have pursued the idea of linked windows. In this approach, several distinct views of a data set are presented to the observer simultaneously in a series of windows, with dynamic linkages between them. For example, a data set might be displayed as a map, a table, a histogram of one variable, and a scatterplot of two variables. Pointing to an observation or group of observations in one window automatically causes the corresponding observations to be highlighted in other windows. Thus one can highlight the outliers from the main trend in a scatterplot, and observe their locations on a map. PLACE-BASED ANALYSIS Generalization is a cornerstone of the scientific method, and there is much greater interest in discovering things that are generally true than things that are true only at certain times, or in certain places. This nomothetic approach to science has obvious value in such disciplines as physics and chemistry, where scientific truths, such as chemical reactions
  • 6. and the laws of motion, have an absolute validity. But in the social sciences there is no realistic prospect of discovering such absolute truths about human behavior; as the nuclear physicist Sir Ernest Rutherford is reputed1 to have said or written, "The only possible conclusion the social sciences can draw is: some do, some don't". One might dream of a model of human behavior that accounts for all variance (R2=1), but in reality rejection of the null hypothesis that the model accounts for no variance is more often the basis for claims of progress. If a model fits imperfectly, then it is reasonable to expect that its residuals will show geographic patterns, and perhaps that the model will fit better (residual variation will be smaller) in some areas than others– in other words, it will exhibit spatial nonstationarity. If so, then the results obtained from an analysis over any limited study area will depend explicitly on the bounds of the study area, and will be different if the study area is changed. It is common when analyzing cross-sectional data to make maps of residuals, hoping that spatial context will suggest factors that might explain the residual variation, and improve the model's fit. One might observe, for example, that residuals were uncommonly high in certain parts of a city, or in certain states, and prior knowledge of those areas, or maps of other factors, might suggest modifications to the model. But these arguments lie firmly within the nomothetic tradition: the purpose of analysis is to discover universal truths. By contrast, the idiographic approach seeks to identify and record the unique properties of places. The effort may still be scientific, in the sense that results are reproducible and described in terms whose meanings are widely understood, but generalization is much less important as a motivation. A follower of the idiographic approach might become an expert in some particular area of the Earth's surface, and his or her students might become experts in parts of that area, in a potentially infinite regress. The debate between nomothetic and idiographic approaches to the discipline of geography peaked in the 1950s (Johnston, 1991), and remains an important dimension of the discipline's methodological tensions. Recently, however, a middle position has emerged that adds a new stimulus to the debate. Place-based or local analysis (Fotheringham and Brunsdon, 1999) attempts to identify the properties that distinguish places, within the context provided by a general framework. Consider, for example, the technique of geographically weighted regression (GWR) developed by Fotheringham and his group at the University of Newcastle (Brunsdon et al., 1999; Fotheringham et al., 1998, 2000). Suppose a simple linear model is to be fitted to data from geographically dispersed observations. Normally one would use ordinary least squares, maximum likelihood, or some other suitable criterion to obtain a single set of estimates of the universal parameters of the model. Suppose instead that observations are weighted, using weights that are inversely related to distance from some chosen location. The fitted parameters of the model will now be dependent on the location chosen, and will vary as the regression is recentered on different locations. By recentering the regression many times one can build up a complete map of the spatial 1 Although it is frequently cited, I have been unable to find a documented source of this comment.
  • 7. variation of the parameter estimates, which can now be interpreted based on spatial context, and known characteristics of the study area. Many other methods of local analysis have been developed in the past few years. Anselin's Local Indicators of Spatial Association (LISA; Anselin, 1995) decompose universal measures of pattern into local measures, allowing much more detailed and insightful interpretation (Cohen and Tita apply these methods in Chapter 10). For example, measures of spatial autocorrelation such as Moran's I can be decomposed into local Moran scatterplots, a useful means of detecting local anomalies (in Chapter 14, Câmara et al. apply these techniques to analyze social exclusion in São Paulo). Getis and Ord (1992) describe locally centered measures of clustering in point patterns. In essence, place-based analysis relies on a simple expectation: that any model or theory in the social sciences will fail to account perfectly for the phenomena that it describes; and that in such circumstances phenomena will almost certainly exhibit non-stationarity. If this is the case, then more will be learned by exploring patterns of non-stationarity than by averaging them within a universal model or analytic technique. As in the previous section, space provides the necessary link to other potentially interesting factors, and to the context of observations. SPATIALLY EXPLICIT MODELS AND THEORY A model is said to be spatially explicit when it differentiates behaviors and predictions according to spatial location. Consider a model that attempts to predict the behavior of the U.S. economy. If the model lumps all aspects of the economy together without respect to location, assuming in effect that there is perfect communication between all regions of the U.S., then its predictions similarly apply uniformly to the entire country. But the model would acquire some degree of spatial explicitness if it regarded the economy as a system of regional economies, with processes coupling the different regional parts together, and if it predicted distinct outcomes in each region. Regions could be broken down into constituent states; states might be broken down into counties; and progressively the number of spatial components of the economy might be increased to a very large number. In the limit, the economy might be modeled as a collection of actors moving across continuous space, rather than confined to lumped geographic areas. This same continuum from one, to a few lumps, to a continuum underlies the models that are increasingly used to predict the behavior of large systems, in disciplines ranging from economics to communications, hydrology, ecology, and even physics. The field of geocomputation (Atkinson and Martin, 2000; Longley et al., 1998; Openshaw and Abrahart, 2000) specializes in spatially explicit models that make use of high-speed computation to simulate future outcomes on the Earth's surface. Such models have been developed for the behavior of individuals in crowds (Haklay et al., 2001); for the impacts of human decisions on land use (Chapter 21; Clarke et al., 1997; http://www.cipec.org/research/biocomplexity/); and for many other spatially distributed social phenomena. In Chapter 4, Benenson shows how a spatially explicit model of agent behavior can be used to gain insights into processes of residential segregation. In Chapter
  • 8. 5, O'Sullivan examines broader issues of agent-based modeling, including data requirements and model validation. A spatially explicit theory might be defined as a theory whose outcomes depend on the locations of the objects that are the focus of the theory. It follows that one or more spatial concepts, such as distance, location, connectivity, adjacency, or direction, must appear in the theory. A good example is the spatial interaction model, a basis for predicting migration, communication, or travel between places over space (Fotheringham and O'Kelly, 1989; Haynes and Fotheringham, 1984) that has several theoretical roots. The quantity of interaction is modeled as the product of an origin factor or tendency to generate interaction, such as population; a destination factor or tendency to attract interaction, such as the number of job opportunities; and a factor that is a decreasing function of the spatial separation between origin and destination. One of the significant attractions of space as a basis for modeling stems from the means used to assess a model's success. Consider, for example, the use of a spatially explicit model to predict the evolution of land use in an area, as a result of urban growth. The model will make use of spatially explicit starting conditions, such as the existing state of urbanization at the beginning of the modeled period, the availability of developable land, and proximity to existing transportation infrastructure. Included in the model's algorithm are random components, designed to produce a range of outcomes in the form of future patterns of development. None of these outcomes can be reasonably expected to match the actual future pattern of land use, raising the question of how the model can be validated. Typically, success is measured by the degree to which the gross spatial characteristics of the outcome match actual patterns– in terms of the degree of fragmentation of urban land use, or the degree of dispersion around urban centers and infrastructure. In summary, space is important in modeling and theory because it accounts for the effects of separation and imperfect communication between parts of a social system; because it allows the modeler to include the impact of heterogeneous spaces on model outcomes; and because the spatial properties of predictions are an important basis for assessment of model success. But although space is important, it is not at all clear that space can actually explain, or whether the spatial concepts that appear in a spatially explicit theory are not merely surrogates for something else (Harvey, 1969; Sack, 1972). For example, the distance term that appears in the spatial interaction model can be interpreted as measuring the costs of transportation that ultimately account for decreasing interaction with distance, or as reflecting the correlation that exists between distance and human communication (this issue of the relationship between social interaction and space is the focus of Chapter 7, where Eagles et al. examine the spatial structure of political networks, and of Chapter 20, where Guldmann describes models of international telecommunication flows). The information-theoretic basis for the spatial interaction model popularized by Wilson (1970) ascribes a rather different role to distance, arguing that the model represents merely the most likely allocation of trips given knowledge of the average or total distance traveled; but again, this can hardly be interpreted as using distance to explain interaction.
  • 9. GEOGRAPHIC INFORMATION SYSTEMS At least some of the current interest in space in social science, and in other areas of science that deal with the Earth's surface, has to do with the emergence over the past three decades of a class of software known as geographic information systems (GIS). Like many other classes of software, this one owes its success in part to the economies of scale that result from integrating computer functions that operate on a particular class of information, in this case geographic information. Similar scale-economies obtain for word-processing software (functions operating on digital text) or spreadsheets (functions operating on digital tables). Although geographic information seems particularly well defined, as information about phenomena on the Earth's surface, the large number of ways of creating digital representations of such information has ensured that GIS is a particularly complex computer application. Nevertheless it has become popular, in areas ranging from resource management to marketing, and from academic research to the operations of utility companies. Longley et al. (2001) provide an introductory text, and Longley et al. (1999) a comprehensive review of the state of the GIS art. Social science applications are reviewed in many of the major texts, and particularly in the text by Martin (1996). A modern GIS contains functions for the creation, acquisition, editing, and storage of geographic information; for query, analysis, and modeling; and for visual display, report generation, and other forms of output. It supports geographic features represented as points, lines, or areas, defining their locations with the use of coordinates in so-called vector representations; and also continuous geographic variation over regular grids known as rasters. It supports the easy integration of tabular data with representations of reporting zone boundaries, and thus the preparation of maps and other more sophisticated forms of data display, such as ESDA. GIS is grounded in geographic space, and treats the boundaries of reporting zones as features superimposed on the geographic continuum. Standard tools allow data from neighboring zones to be compared and aggregated, and areal interpolation tools allow statistics for one set of reporting zones to be estimated from known values for a second, incompatible set of reporting zones (Goodchild et al., 1993). Openshaw (1983) and others have explored the importance of reporting zone boundaries in conditioning what can be learned about social processes, a theme that is explored further by Sampson and Morenoff in Chapter 8 and by Rey in Chapter 15. GIS has made tools for mapping and many of the methods of spatial analysis readily accessible to researchers. GIS courses and programs are now taught on almost all university campuses, in community colleges, and even in high schools; and courses and programs are readily available over the WWW. In effect, a GIS is to spatial social science as a word processor is to writing, or a statistics package is to statistical analysis– an indispensable modern tool for working with a particular type of information. Some of the reasons for the popularity of GIS are explored in the next section, on the role of space in the integration of data, processes, and disciplines.
  • 10. SPACE AS A BASIS FOR INTEGRATION A neophyte's first view of GIS is often of some version of the layer-cake model, a representation of phenomena on the Earth's surface as a series of layers, each layer representing a distinct variable or class of phenomena. The model graces the cover of several introductory GIS texts (e.g., Star and Estes, 1990), and its roots extend back several centuries. McHarg (1969) was influential in promoting the model as a basis for landscape architecture and other design disciplines, arguing that one could represent the factors impacting a development, or impacted by it, as a series of transparent layers, with the strongest impact corresponding to the greatest opaqueness; by overlaying the layers, one could visualize the locations of least total impact. McHarg's concept received a massive boost with the advent of GIS, since the tools to perform the necessary redrafting of maps onto transparencies, reclassification into measures of impact, registration of layers to a common base, and if necessary transformation to a common projection, could all be handled easily by standard functions. The layer-cake thus became an important icon of the ability of GIS to integrate data on different topics from different sources, and to support the investigation of spatial correlations and spatial context. Users could easily compare one layer to another, combining information on environmental pollution with the ethnicity of neighborhoods, or rates of disease. Today, it is possible to use standard interfaces between GIS software and the Internet (e.g., the Geography Network, http://www.geographynetwork.com), along with the resources of massive public archives of geographic information (e.g., http://www.fgdc.gov/clearinghouse/, http://www.alexandria.ucsb.edu) to integrate, visualize, and analyze data about virtually any location on the planet, at spatial resolutions ranging down to 1m. The role of space as a mechanism of integration appears to be unique; although one might imagine integrating information based on time, it makes much more sense to integrate data about a historic period specifically for some geographic location, than for all locations. For example, there would be much more interest in all information about 15th Century Paris than about the 15th Century anywhere; but someone researching contemporary Paris might well be interested in information about Paris in earlier periods. In essence, we argue that space trumps time alone as a basis for integration, but space and time trump space. Recently, the idea of using space to integrate information has been extended beyond digital maps and images to any information that can be related to the Earth's surface– in other words, information with a geographic footprint. The traditional library has relied on author, title, and subject as the keys to its catalog. Although one might imagine using geographic location as a key, the technical difficulties associated with doing so in a traditional library are profound. But they are comparatively trivial in a digital library, and several WWW sites now support search of their information archives using geographic location as a primary key. One can, for example, search the site of the Environmental Protection Agency (http://www.epa.gov) for all information related to a particular area,
  • 11. such as a ZIP code. A geolibrary (NRC, 1999) is defined as a digital library that is searchable by geographic location, returning maps, images, reports, photographs, and even pieces of music identified with a particular location. But the integration argument can be extended further. The behavior of human societies is best understood in terms of distinct processes– economic, political, or social– that are studied somewhat in isolation by different disciplines (economics, political science, and sociology respectively). Although researchers pursue knowledge that is general, the implications of that knowledge are felt locally, in the particular circumstances of specific locations. In the development of local policy, the reductionist approach that allocates processes to different disciplines is counter-productive, since it encourages social policies that ignore economics, and economic policies that ignore politics. Just as space provides an integrating mechanism for data, then, we argue that space can provide an integrating mechanism for the social sciences, and a mechanism for linking science to policy. In Chapter 2, Boucek and Moran show the importance of this principle in their studies of land cover changes in Brazil and Thailand, where a spatially explicit landscape proves to be the essential key to unraveling and understanding the complex interactions of social and physical processes. And in a very different context, Shen in Chapter 13 shows the value of space as an integrating mechanism for research on urban transportation and communication. This concept is aptly captured in the design of GIS. Essentially a GIS consists of two components: the database, representing the conditions on the Earth's surface in the studied area; and the functions, algorithms, methods, models, and database design that are largely independent of location, in the sense that they could potentially be applied to data from anywhere. The database is thus idiographic and specific to the studied area; while the other components of the system are nomothetic, representing general procedures and scientific knowledge. Thus the GIS is a potential key to linking science to local policy– both a tool for scientific discovery, and a means for delivering discovered scientific knowledge in local areas. TOWARDS SPATIALLY INTEGRATED SOCIAL SCIENCE The previous two sections outlined the arguments for space as important in social science, and as a basis for integrating the work of social science disciplines, and delivering that work in practical contexts. As we noted earlier, these are the arguments we used in founding the Center for Spatially Integrated Social Science (CSISS) at the University of California, Santa Barbara. This section outlines the work of the center, and its role in this book. In the physical sciences the concept of research infrastructure has a long and successful history. Systems like the Hubble Telescope are extremely expensive, and can only be justified if designed to serve the needs of many different scientific experiments, by many different research groups. Just as insurance companies spread risk over large groups of insured, so such infrastructure projects spread their costs over large research communities. But the concept of research infrastructure has never penetrated the social
  • 12. sciences to the same degree, except in the case of large surveys and large data archives, in part because infrastructure is too strongly associated with large items of equipment. But computational tools, research skills, and the publication system are also arguably research infrastructure, and the costs of the investments they represent are spread over large communities, even in the social sciences. We argued in the CSISS proposal that because spatial methods are relevant to many social scientists, investments in learning about them, automating them in computational tools, and sharing success with them could legitimately be regarded as research infrastructure. Funding for CSISS began in October, 1999, with an initial five-year commitment by the National Science Foundation. The CSISS mission "recognizes the growing significance of space, spatiality, location, and place in social science research. It seeks to develop unrestricted access to tools and perspectives that will advance the spatial analytic capabilities of researchers throughout the social sciences." CSISS has since developed seven programs, all aimed at facilitating the use of spatial perspectives in the social sciences: • • • • • • • A program of national workshops, offered each summer for one-week periods to young researchers in the social sciences, and focusing on GIS, mapping, spatial analysis, and related topics. Specialist meetings, which bring together senior researchers interested in major themes in the social sciences, such as spatial equity, to identify needed investments in infrastructure to support research in the theme. A virtual community of scholars interested in spatial perspectives, with WWW resources that include search engines and bibliographies. A program to enhance the computational tools available for GIS and spatial analysis, being conducted at the University of Illinois at Urbana-Champaign under the directorship of Luc Anselin. Efforts to develop facilities for searching social science data archives based on geographic location. A collection of learning resources, and pointers from the CSISS WWW site to other resources aimed at facilitating a spatial perspective. A program to encourage best practices in spatially integrated social science. This book is the most important outcome of the last of these programs, and in the next section we describe our objectives and the process used to assemble the book. OBJECTIVES OF THE BOOK Our objective in assembling this book has been to illustrate the application of spatial perspectives across the breadth of the social sciences, without respect to discipline, and by doing so to encourage others to follow similar paths; to improve on them; and to apply them in new areas. The objective is thus fully consistent with our theme of spatially integrated social science. The term "best practices" is controversial and misleading, but it does convey the notion of leading by example, and reflects our attempt to identify leaders in the application of spatial perspectives in different disciplines and subdisciplines.
  • 13. We used a fairly complex process to assemble the book. We began by searching the social science literature and citation indices to find publications that used spatial perspectives, and that were frequently cited– in other words, publications that were in some sense seminal or groundbreaking. From this analysis we selected a tentative group of authors, and commissioned them to write to the theme of the book, with an emphasis on the process of science, from problem formulation to generalizable conclusions. We deliberately allowed the subject matter to span the range from largely empirical studies, to surveys of studies, to more theoretical contributions, hoping thereby to represent the range of research styles in the social sciences. We also allowed the chapters to range from the very intuitive to the conceptually complex, again reflecting the range of practice. We reviewed and edited the drafts, striving for a consistent style and adherence to the objectives. Such a diverse collection of material might be organized in any number of ways, each reflecting one dimension of the range of material. After much debate we decided to use a cross-cutting theme that speaks directly to the spatial focus and our desire to blur the boundaries of the disciplines: the spatial resolution of the project, from the local to the global. To study the individual from a spatial perspective one needs sufficient spatial resolution to identify the individual, which means on the order of 1m; while to study the interactions between large aggregates, such as nations, a spatial resolution as coarse as 10km might be adequate. Of course few if any studies in the social sciences use such strictly uniform notions of spatial resolution, preferring to work with units such as counties that may vary by as much as a factor of several hundred in linear dimension in the U.S. (between a Virginia city-county and San Bernardino County, for example); and in Chapter 11 Daly and Lock demonstrate the value of an explicitly multi-scale approach in spatial archaeology. Nevertheless there are clear differences between studies of individuals, neighborhoods, cities, regions, and nations that are reflected in distinct methodologies and theoretical frameworks. The book is structured as a series of sections, each containing chapters using a similar level of spatial resolution, and each beginning with an introduction that explains the relationship between the chapters, and between the section and the rest of the book. The book is not intended to be read from cover to cover, though we would of course be very happy if some chose to do that. Rather, we hope the book will be mined for examples, parallels, analogies, and other aids to lateral thinking about research in the social sciences. As such, we hope we have contributed to the development of research infrastructure, and to the growing importance of space in the social sciences. ACKNOWLEDGMENT Many people have contributed to the development of this volume, and to this and other CSISS programs. In addition to the authors, we thank in particular Ben Sprague, who undertook much of the final assembly; Jorge Sifuentes and David Fearon, who conducted the earlier citation research; the staff of CSISS, including LaNell Lucius, Christian Brown, Gamaiel *. We as editors are of course solely responsible for any errors. …
  • 14. REFERENCES Abel, D.J. and D.M. Mark, 1990. A comparative analysis of some 2-dimensional orderings. International Journal of Geographical Information Systems 4(1): 21-31. Anselin, L., 1995. Local indicators of spatial association– LISA. Geographical Analysis 27: 93-115. Anselin, L., 1999. Interactive techniques and exploratory spatial data analysis. In P.A. Longley, M.F. Goodchild, D.J. Maguire, and D.W. Rhind, editors, Geographical Information Systems: Principles, Techniques, Management and Applications. New York: Wiley, pp. 253-266. Atkinson, P. and D. Martin, editors, 2000. GIS and Geocomputation. London: Taylor and Francis. Bailey, T.C. and A.C. Gatrell, 1995. Interactive Spatial Data Analysis. New York: Wiley. Brunsdon, C., A.S. Fotheringham, and M. Charlton, 1999. Some notes on parametric significance tests for geographically weighted regression. Journal of Regional Science 39(3): 497-524. Clarke, K.C., S. Hoppen, and L. Gaydos, 1997. A self-modifying cellular automaton model of historical urbanization in the San Francisco Bay area. Environment and Planning B: Planning and Design 24(2): 247-261. Dorling, D., 1995. A New Social Atlas of Britain. Chichester, UK: Wiley. Fotheringham, A.S. and C. Brunsdon, 1999. Local forms of spatial analysis. Geographical Analysis 31(4): 340-358. Fotheringham, A.S., C. Brunsdon, and M. Charlton, 2000. Quantitative Geography: Perspectives on Spatial Data Analysis. London: Sage. Fotheringham, A.S., M.E. Charlton, and C. Brunsdon, 1998. Geographically weighted regression: a natural evolution of the expansion method for spatial data analysis. Environment and Planning A 30(11): 1905-1927. Fotheringham, A.S. and M.E. O'Kelly, 1989. Spatial Interaction Models: Formulations and Applications. Dordrecht: Kluwer. Getis, A. and J.K. Ord, 1992. The analysis of spatial association by use of distance statistics. Geographical Analysis 24: 189-206.
  • 15. Gilbert, E.W., 1958. Pioneer maps of health and disease in England. Geographical Journal 124: 172-183. Goodchild, M.F., 1992. Analysis. In R.F. Abler, M.G. Marcus, and J.M. Olson, editors, Geography's Inner Worlds: Pervasive Themes in Contemporary American Geography. New Bruswick, NJ: Rutgers University Press, pp. 138-162. Goodchild, M.F., L. Anselin, and U. Deichmann, 1993. A framework for the areal interpolation of socioeconomic data. Environment and Planning A 25: 383-397. Goodchild, M.F., L. Anselin, R.P. Appelbaum, and B.H. Harthorn, 2000. Toward spatially integrated social science. International Regional Science Review 23(2): 139159. Haklay, M., T. Schelhorn, D. O'Sullivan, and M. Thurstain-Goodwin, 2001. 'So go down town': Simulating pedestrian movement in town centres. Environment and Planning B: Planning and Design 28(3): 343-59. Harvey, D., 1969. Explanation in Geography. London: Edward Arnold. Haynes, K.E. and A.S. Fotheringham, 1984. Gravity and Spatial Interaction Models. Beverly Hills, CA: Sage. Johnston, R.J., 1991. Geography and Geographers: Anglo-American Geography since 1945. 4th Edition. London: Edward Arnold. Longley, P.A., S.M. Brooks, R. McDonnell, and W. Macmillan, editors, 1998. Geocomputation: A Primer. New York: Wiley. Longley, P.A., M.F. Goodchild, D.J. Maguire, and D.W. Rhind, editors, 1999. Geographical Information Systems: Principles, Techniques, Management and Applications. New York: Wiley. Longley, P.A., M.F. Goodchild, D.J. Maguire, and D.W. Rhind, 2001. Geographic Information Systems and Science. New York: Wiley. Martin, D., 1996. Geographic Information Systems: Socioeconomic Applications. 2nd Edition. London: Routledge. McHarg, I.L., 1969. Design with Nature. Garden City, NY: Natural History Press. Mitchell, A., 1999. The ESRI Guide to GIS Analysis. Redlands, CA: ESRI Press. Monmonier, M.S., 1991. How to Lie with Maps. Chicago: University of Chicago Press.
  • 16. National Research Council, 1999. Distributed Geolibraries: Spatial Information Resources. Washington, DC: National Academy Press. Nicol, A.A.M and P.M. Pexman, 1999. Presenting Your Findings: A Practical Guide for Creating Tables. Washington, DC: American Psychological Association. Openshaw, S., 1983. The Modifiable Areal Unit Problem. Concepts and Techniques in Modern Geography No. 38. Norwich, UK: GeoBooks. Openshaw, S. and R.J. Abrahart, editors, 2000. Geocomputation. New York: Taylor and Francis. Peuquet, D.J., 2002. Representations of Space and Time. New York: Guilford. Sack, R.D., 1972. Geography, geometry, and explanation. Annals of the Association of American Geographers 62: 61-78. Star, J. and J.E. Estes, 1990. Geographic Information Systems: An Introduction. Englewood Cliffs, NJ: Prentice Hall. Tufte, E.R., 1983. The Visual Display of Quantitative Information. Cheshire, CT: Graphics Press. Tukey, J.W., 1977. Exploratory Data Analysis. Reading, MA: Addison-Wesley. Wilson, A.G., 1970. Entropy in Urban and Regional Modelling. London: Pion.
  • 17. Figure 1. The map made by Dr John Snow of the incidence of cholera during an outbreak in the Soho district of London in 1854. The contaminated water pump is located at the center of the map, just to the right of the D in Broad Street. (Source: Gilbert, 1958). (*Permission will have to be obtained from the Geographical Journal. The best source I have is a reproduction in Goodchild, M.F., 1992. Analysis. In R.F. Abler, M.G. Marcus, and J.M. Olson, editors, Geography's Inner Worlds: Pervasive Themes in Contemporary American Geography. New Brunswick, NJ: Rutgers University Press, pp. 138-162.)