Understanding Discord NSFW Servers A Guide for Responsible Users.pdf
Toll Cross Industry Note: Uranium Update (July 24, 2013)
1.
Industry Research
24 July 2013
TOLL CROSS INDUSTRY NOTES:
Tom Hope, P. Eng
Tom.Hope@tollcross.ca 416.365.1960
URANIUM UPDATE
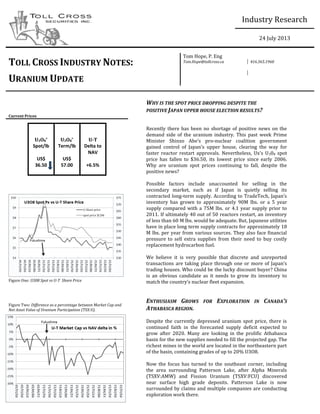
WHY IS THE SPOT PRICE DROPPING DESPITE THE
POSITIVE JAPAN UPPER HOUSE ELECTION RESULTS?
Current Prices
U3O8
*
Spot/lb
US$
36.50
U3O8
*
Term/lb
US$
57.00
U-T
Delta to
NAV
+6.5%
Recently there has been no shortage of positive news on the
demand side of the uranium industry. This past week Prime
Minister Shinzo -‐nuclear coalition government
308 spot
price has fallen to $36.50, its lowest price since early 2006.
Why are uranium spot prices continuing to fall, despite the
positive news?
Possible factors include unaccounted for selling in the
secondary market, such as if Japan is quietly selling its
contracted long-‐
inventory has grown to approximately 90M lbs. or a 5 year
supply compared with a 75M lbs. or 4.1 year supply prior to
2011. If ultimately 40 out of 50 reactors restart, an inventory
of less than 60 M lbs. would be adequate. But, Japanese utilities
have in place long term supply contracts for approximately 18
M lbs. per year from various sources. They also face financial
pressure to sell extra supplies from their need to buy costly
replacement hydrocarbon fuel.
We believe it is very possible that discrete and unreported
transactions are tak
trading houses. Who could be the lucky discount buyer? China
is an obvious candidate as it needs to grow its inventory to
ENTHUSIASM GROWS FOR EXPLORATION IN CANADA S
ATHABASCA REGION.
Despite the currently depressed uranium spot price, there is
continued faith in the forecasted supply deficit expected to
grow after 2020. Many are looking in the prolific Athabasca
basin for the new supplies needed to fill the projected gap. The
richest mines in the world are located in the northeastern part
of the basin, containing grades of up to 20% U3O8.
Now the focus has turned to the southeast corner, including
the area surrounding Patterson Lake, after Alpha Minerals
(TSXV:AMW) and Fission Uranium (TSXV:FCU) discovered
near surface high grade deposits. Patterson Lake is now
surrounded by claims and multiple companies are conducting
exploration work there.
Figure One: U308 Spot vs U-T Share Price
Figure Two: Difference as a percentage between Market Cap and
Net Asset Value of Uranium Participation (TSX:U).
2.
Recently Skyharbour Resources (TSXV:SYH), Athabasca
Nuclear (TSXV:ASC), Lucky Strike Resources (TSXV:LKY) and
Noka Resources (TSXV:NX) signed a $6M joint exploration plan
on their southeastern Athabasca properties. Other properties
are owned by Nexgen Resources (TSXV:NXE), Aldrin Resources
(TSXV:ALN), Forum Minerals (TSXV:FDC) and Lakeland
Resources (TSXV:LK). Both UEX (TSX:UEX) and Cameco
(TSX:CCO) also have property in the area.
When we began publishing our Uranium Update in mid 2005
the spot and term price had risen to $29.50 per lb., from a
mere $10 per lb. in 2002/3. At that time we listed a total of 33
of 26 early exploration companies with the uranium spot at
$36.50 per lb. and a term price of $57 per lb. Obviously the
faithful still believe.
Please see important disclosures on the last page of this
report.
3.
* simple aggregate composite index, base point 1 Jan '13
Uranium Index & Price Performance - Period ending 23 July 2013
Production EquitiesIndex
Company Tick
YTD
Comp
Index 52 wk H 52 wk L
M arket Cap
(C$ M M )
(aggregate)
NAV
($MM)
M C
delta to
NAV
YTD %
Return
52 wk %
Return
Production Composite Index 110.84
Advanced Exploration Composite Index 96.09
Exploration, with a Resource Comp Index 61.72
Early Stage Exploration Comp Index 202.17
Uranium Participation U 5.29$ 5.80$ 4.69$ 562.6$ 528$ 6.49% -1.30 -6.327
Global X Uranium ETF URA-US 18.65$ 25.02$ 15.90$ 144.9$ -5.58 -14.153
U3O8 Spot Price ($US) Ux Sp 36.50$
U3O8 Long Term Price ($US) Ux Trm 57.00$
Production EquitiesIndex
Company Tick L. Px 52 wk H 52 wk L
M arket Cap
(C$ M M )
U3O8 NI
43-101
(lbs. MM) M C/lb$
YTD
Return
52 wk
Return
Cameco Corp. CCO 21.86$ 23.49$ 16.50$ 8,787.7$ 996.10 8.82$ 16.18 1.83
Paladin Energy PDN 1.07$ 1.52$ 0.75$ 782.2$ 500.18 1.56$ -5.46 -14.75
Energy Fuels Inc. EFR 0.18$ 0.24$ 0.13$ 18.7$ 71.00 0.26$ 2.86 28.57
Uranium Energy Corp UEC-US 2.52$ 3.02$ 1.40$ 215.5$ 14.58 14.77$ -3.91 25.51
Energy Resources of Australia Ltd ERA-AU 1.62$ 1.66$ 0.95$ 168.5$ 161.05 1.05$ 27.56 6.93
AdvancedExploration andDevelopment EquitiesIndex
Company Tick L. Px 52 wk H 52 wk L
M arket Cap
(C$ M M )
U3O8 NI
43-101
(lbs. MM) M C/lb$
YTD
Return
52 wk
Return
Denison Mines Corp. DML 1.34$ 1.68$ 1.04$ 499.8$ 131.37 3.80$ 11.38 3.01
Ur-Energy Inc. URE 1.35$ 1.38$ 0.64$ 141.8$ 25.32 5.60$ 66.27 102.94
Uranerz Energy Corp. URZ 1.36$ 1.82$ 0.92$ 106.1$ 18.36 5.78$ 2.92 3.68
UEX Corporation UEX 0.41$ 0.84$ 0.38$ 89.8$ 82.51 1.09$ -28.81 -31.15
Peninsula Energy (AUS$) PEN-AU 0.03$ 0.06$ 0.02$ 91.5$ 103.80 0.88$ -20.51 3.33
Laramide Resources Ltd LAM 0.61$ 1.10$ 0.47$ 45.8$ 61.20 0.75$ -25.61 -21.80
Forsys Metals Corp FSY 0.48$ 0.89$ 0.47$ 41.8$ 112.30 0.37$ -40.00 -43.53
Mega Uranium Ltd. MGA 0.10$ 0.22$ 0.07$ 29.9$ 43.03 0.70$ -12.50 -43.24
Strathmore Minerals Corp. STM 0.25$ 0.34$ 0.14$ 25.5$ 34.27 0.74$ -9.43 -7.69
Bannerman Resources Ltd. BAN 0.05$ 0.14$ 0.05$ 12.7$ 273.78 0.05$ -41.18 -61.54
Macusani Yellowcake Inc YEL 0.06$ 0.18$ 0.06$ 9.6$ 39.40 0.24$ -58.62 -53.85
Strateco Resources Inc RSC 0.07$ 0.33$ 0.04$ 9.6$ 28.70 0.33$ -67.50 -79.03
Khan Resources Inc KRI 0.15$ 0.21$ 0.09$ 8.4$ 66.70 0.13$ 25.00 3.45
Exploration, with a Resource
Company Tick L. Px 52 wk H 52 wk L
M arket Cap
(C$ M M )
U3O8 NI
43-101
(lbs. MM) M C/lb$
YTD
Return
52 wk
Return
Kivalliq Energy Corporation KIV 0.24$ 0.46$ 0.23$ 28.9$ 43.30 0.67$ -27.78 -22.39
Rockgate Capital Corp. RGT 0.17$ 0.67$ 0.14$ 18.0$ 45.25 0.40$ -69.44 -45.00
U3O8 Corp. UWE 0.14$ 0.45$ 0.13$ 13.1$ 47.60 0.28$ -35.56 -57.97
Vena Resources Inc. VEM 0.09$ 0.42$ 0.07$ 10.8$ 18.61 0.58$ -53.49 -75.00
Continental Precious Minerals Inc. CZQ 0.13$ 0.26$ 0.09$ 8.2$ 10.98 0.75$ -33.33 -47.62
Crosshair Exploration & Mining CXX 0.03$ 0.24$ 0.02$ 4.8$ 4.61 1.04$ -71.43 -85.00
Powertech Uranium Corp PWE 0.06$ 0.17$ 0.06$ 3.4$ 22.80 0.15$ -48.00 -43.48
Bayswater Uranium Corporation BYU 0.09$ 0.15$ 0.01$ 2.1$ 28.91 0.07$ 0.00 -15.79
Silver Spruce Resources Inc. SSE 0.01$ 0.07$ 0.01$ 1.4$ 2.22 0.62$ -50.00 -66.67
Deep Yellow Ltd. DYL-AU 0.04$ 0.10$ 0.03$ 1.3$ 119.30 0.01$ -32.79 -19.61
5.
Toll CrossSecuritiesInc.
Toronto St. Suite 200
Toronto, Ontario M5C 2V6
telephone: (416) 365-1960
facsimile: (416) 365-1962
email: toronto@tollcross.ca
website: www.tollcross.ca
Institutional Sales
Rodger Gray rodger.gray@tollcross.ca
James Massie james.massie@tollcross.ca
Ed Pennock ed.pennock@tollcross.ca
Institutional Trading
Russ Minor russ.minor@tollcross.ca
Tom George tom.george@tollcross.ca
PrivateClient Group
Rodger Gray andrew.beach@tollcross.ca
Andrew Beach rodger.gray@tollcross.ca
EquitiesResearch
Eleanor Barker International Oil & Gas eleanor.barker@tollcross.ca
Deniz Tura-Matten Energy Analyst deniz.tura-matten@tollcross.ca
Jacques Kavafian Airlines & Aerospace jacques.kavafian@tollcross.ca
Don DeMarco Mining &Minerals don.demarco@tollcross.ca
Investment Banking
Marc Bouchard Communications/Tech marc.bouchard@tollcross.ca
Tom Hope Communications/Tech tom.hope@tollcross.ca
Randall Blom Investment Banking Analyst randall.blom@tollcross.ca
6.
IMPORTANT DISCLOSURES
Analyst'sCertification
All of the views expressed in this report accurately reflect the personal views of the responsible analyst(s) about any and all of the subject securities or issuers. No part
of the compensation of the responsible analyst(s) named herein is, or will be, directly or indirectly, related to the specific recommendations or views expressed by the
responsible analyst(s) in this report. The particulars contained herein were obtained from sources which we believe to be reliable but are not guaranteed by us and may
be incomplete.
TCSI compensates its research analysts from a variety of sources. The research department is a cost centre and is funded by the business activities of TCSI including,
institutional equity sales and trading, retail sales, and corporate and investment banking. Since the revenues from these businesses vary the funds for research
compensation vary. No one business line has greater influence than any other for research analyst compensation.
Dissemination of Research
TCSI endeavours to make all reasonable efforts to provide research simultaneously to all eligible clients. TCSI equity research is distributed electronically via email
and is posted on our proprietary websites to ensure eligible clients receive coverage initiations and ratings changes, targets and opinions in a timely manner. Additional
distribution may be done by the sales personnel via email, fax or regular mail. Clients may also receive our research via a third party. Toll Cross Securities Inc. research
dissemination policies and procedures may be found on our website, www.tollcross.ca, in the Research Distribution Policy section.
Company SpecificDisclosures: 1, 2, 3, 4, 5, 6,& 7
SeeCompany Specific DisclosureKey below for explanations.
Company SpecificDisclosureKey
TCSI uses the following Company Specific Disclosure Key. Please refer to the Company SpecificDisclosuressection above for specific disclosures applicable to the
issuer(s) discussed in this report.
1 On the last day of the month preceding the date of this report TCSI and its affiliates held an aggregate of less than 5% of the outstanding shares (of any class of equity
securities) of companies discussed or listed in this report.
2 The research analyst(s) and/or associates (or their household members) who prepared this research report directly or beneficially own common stock of CCO.
3 TCSI has not managed or co-managed an initial public offering of equity or equity-related securities for any company discussed or listed in the past 12 months, the
closing date of which was at least 40 calendar days prior to the issuance of this report.
4 TCSI has not managed or co-managed a secondary offering of equity or equity-related securities for any company discussed or listed in the past 12 months, the
closing date of which was at least 10 calendar days prior to the issuance of this report.
5 TCSI has not provided services to any company discussed or listed for remuneration other than normal course investment advisory or trade execution services during
the preceding 12 months.
6 TCSI has not received compensation for investment banking services from any company discussed or listed during the preceding 12 months.
7 No employee of TCSI is an officer or direct of any company discussed or listed (or servesin an advisory capacity to theissuer).
Other Disclosures
For Canadian Residents this report
and its dissemination in Canada. Canadian clients wishing to effect transactions in any security discussed should do so through a qualified salesperson of TCS. For US
Residents tion in the United States.
This report is intended for distribution in the United States only to certain institutional investors. US clients wishing to effect transactions in any security discussed
should do so through a qualified salesperson of TCS USA.
Every province in Canada, State in the U.S., and most countries throughout the world have their own laws regulating the types of securities and other investment
products which may be offered to their residents, as well as the process for doing so. As a result, some of the securities discussed in this report may not be available
to every interested investor. Accordingly, this report is provided for informational purposes only, and does not constitute an offer or solicitation to buy or sell
securities discussed herein in any jurisdiction where such would be prohibited. Neither TCS nor its affiliates accepts any liability whatsoever for any loss arising from
any use of this report or its contents.