Venus Remedies took another step on its R&D journey with its first market authorisation deal with a pharma major in South Africa. The company also launched a key R&D product, Elores, in India, which it expects to become a Rs2bn product in the next 5 yrs. We believe Venus is beginning to show results from its R&D program. With Venus’ intent on monetising its R&D pipeline, there is strong likelihood of continued positive news flow, which should lend buoyancy to the stock price.
1. C O M P A N Y
India
Venus Remedies
22 Apr 2013
Sector: Pharma
BSE Code
CMP (Apr 22’)
Nifty
Equity Cap (m)
Shares (m)
Market Cap (m)
U P D A T E
Rs 252
Positive research results
526953
252
5,834
3,073
10.54
2,652
NSE Code
52W H/L
Sensex
Face Value
Free Float
3M Avg Vol
VENUSREM
327/158
19,169
10
65.78%
12,857
Rs
We believe Venus is beginning to show results from
its R&D program. With Venus’ intent on monetising its
R&D pipeline, there is strong likelihood of continued
positive news flow, which should lend buoyancy to
the stock price.
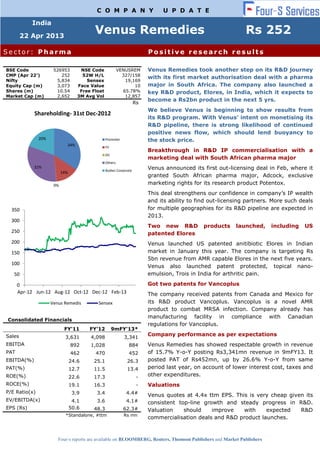
Shareholding- 31st Dec-2012
20%
Promoter
34%
FII
Breakthrough in R&D IP commercialisation with a
marketing deal with South African pharma major
DII
Others
32%
Venus announced its first out-licensing deal in Feb, where it
granted South African pharma major, Adcock, exclusive
marketing rights for its research product Potentox.
Bodies Corporate
14%
Venus Remedies took another step on its R&D journey
with its first market authorisation deal with a pharma
major in South Africa. The company also launched a
key R&D product, Elores, in India, which it expects to
become a Rs2bn product in the next 5 yrs.
0%
This deal strengthens our confidence in company’s IP wealth
and its ability to find out-licensing partners. More such deals
for multiple geographies for its R&D pipeline are expected in
2013.
350
300
Two new R&D
patented Elores
250
200
products
launched,
including
US
Venus launched US patented anitibiotic Elores in Indian
market in January this year. The company is targeting Rs
5bn revenue from AMR capable Elores in the next five years.
Venus also launched patent protected, topical nanoemulsion, Trois in India for arthritic pain.
150
100
50
Got two patents for Vancoplus
0
Apr-12 Jun-12 Aug-12 Oct-12 Dec-12 Feb-13
Venus Remedis
Sensex
Consolidated Financials
The company received patents from Canada and Mexico for
its R&D product Vancoplus. Vancoplus is a novel AMR
product to combat MRSA infection. Company already has
manufacturing facility in compliance with Canadian
regulations for Vancoplus.
FY'11
FY'12
9mFY'13*
3,631
4,098
3,341
EBITDA
892
1,028
884
PAT
462
470
452
EBITDA(%)
24.6
25.1
26.3
PAT(%)
12.7
11.5
13.4
ROE(%)
22.6
17.3
-
Venus Remedies has showed respectable growth in revenue
of 15.7% Y-o-Y posting Rs3,341mn revenue in 9mFY13. It
posted PAT of Rs452mn, up by 26.6% Y-o-Y from same
period last year, on account of lower interest cost, taxes and
other expenditures.
ROCE(%)
19.1
16.3
-
Valuations
3.9
3.4
4.4#
4.1
50.6
3.6
4.1#
48.3
62.3#
Sales
P/E Ratio(x)
EV/EBITDA(x)
EPS (Rs)
*Standalone, #ttm
Rs mn
Company performance as per expectations
Venus quotes at 4.4x ttm EPS. This is very cheap given its
consistent top-line growth and steady progress in R&D.
Valuation
should
improve
with
expected
R&D
commercialisation deals and R&D product launches.
Four-s reports are available on BLOOMBERG, Reuters, Thomson Publishers and Market Publishers
2. Company Report: Venus Remedies
22 Apr 2013
Company continues on stable growth path
9M FY13
9MFY12
Chg YoY (%)
Net sales
3,340.7
2,886.4
15.7
Other Operating Income
Total Operating Income
Total Expenditure
Consumption of Raw Materials
19.5
3,360.2
2,476.1
1,939.9
23.1
2,909.5
2,142.9
1,674.7
-15.6
15.5
15.5
15.8
-61.1
-90.5
-32.5
173.5
166.2
4.4
Particulars (` mn)
(Increase) / Decrease In Stock In
Trade & WIP
Employees Cost
Other Expenditure
423.8
392.6
8.0
EBITDA
Depreciation
884.1
237.6
766.5
183.4
15.3
29.6
EBIT
Interest & Finance charges
646.6
182.8
583.2
186.4
10.9
-1.9
7.4
1.8
311.1
PBT
Tax Expense
471.2
19.2
398.6
41.5
18.2
-53.7
PAT
451.9
357.1
26.6
Other Income
Rs mn *Standalone (Source: Capitaline, company reports)
Stable growth registered in last 9 months driven by domestic
and key segments
Venus Remedies has posted revenue of Rs 3,341mn for 9mFY13, a
Y-o-Y growth of 15.7%. The company has performed well in all 3
quarters this year while growing at 15-16% on Y-o-Y basis.
Driven by domestic market and key therapeutic segments
Oncology sales
grew 22% in
9mFy13
This consistent growth is due to good demand from domestic market
for the company’s products. Domestic market grew 17% during this
period. The institutional division also reported good sales, showing a
growth of 30% from Rs 219mn during 9mFY12 to Rs 285mn for
9mFY13.
The anti-cancer segment, the key segment for Venus, also had good
growth during this period. The segment registered a growth of 22%
Y-o-Y growing to Rs 1,064mn from Rs 874mn in last year. Along with
anti-cancer, SVP segment also grew by 21% during this period.
The company has shown performance on the expected line till now
and is expected to grow along similar trend of 13-15% for the next
1-2 years. This 15% growth is excluding the growth by
commercialising its IP wealth.
Four-S Research
2
3. Company Report: Venus Remedies
22 Apr 2013
Stable performance in Q3
Particulars (` mn)
Q3 FY'13
Net sales
Other Operating Income
Total Operating Income
Total Expenditure
Consumption of Raw
Materials
(Increase) / Decrease In Stock
In Trade & WIP
Employees Cost
Other Expenditure
EBITDA
Depreciation
EBIT
Interest & Finance charges
Other Income
PBT
Tax Expense
PAT
Q3 FY'12
Q2
FY'13
Chg YoY
(%)
1,104.1
4.0
1,108.1
820.2
652.2
Chg
YoY
(%)
18.7
-44.5
17.5
14.8
20.2
1,116.2
10.1
1,126.4
827.3
635.4
940.0
18.2
958.3
720.8
528.6
0.6
-2.9
-31.9
118.7
-101.7
58.4
133.1
299.0
80.1
218.9
52.9
3.5
169.4
8.9
160.6
55.9
139.2
237.5
61.3
176.2
66.8
1.0
110.4
7.1
103.3
58.1
141.9
287.9
79.8
208.1
53.7
2.7
157.1
6.2
150.9
4.3
-4.4
25.9
30.6
24.3
-20.8
238.2
53.5
25.4
55.4
0.5
-6.2
3.9
0.4
5.2
-1.5
28.3
7.9
44.1
6.4
1.1
151.7
1.6
0.9
-2.6
Rs mn
The company had a good third quarter this year with revenue
growing by 18.7% Y-o-Y from Rs940mn to Rs1,116mn. Top-line was
supported by good traction in the export market. Exports grew by
26.3% during this quarter.
The company’s key segment anti-cancer grew by 25.3%. Venus had
strong net margin improvement this quarter as PAT grew 55% from
Rs 103mn in Q3Fy12 to Rs 160mn in Q3Fy13. The Company lowered
interest charges this quarter by refinancing the loan with FCCB.
Maintains profitability
Company reported EBITDA of Rs 884 and PAT of Rs 452mn in
9mFy13 compared to Rs 767mn EBITDA and Rs 357mn PAT,
respectively, during the same period last year. EBITDA margin of
26.3% for 9mFY13 was largely in line with last year.
For Q3 FY13, Venus reported EBITDA margin of 26.5% and PAT
margin of 14.5%.
The increasing contribution from oncology segment and growing
revenue from its R&D products is helping the company to sustain
these margins levels.
Four-S Research
3
4. Company Report: Venus Remedies
Key Ratios
22 Apr 2013
Q3 FY'13
Q3 FY'12
Q2FY'13
EBITDA Margin
26.55%
24.79%
25.98%
Net Margin
14.25%
10.78%
13.62%
Total Expenditure/ Total Operating Income
73.45%
75.21%
74.02%
Raw Material Cost/ Total Operating Income
56.46%
54.85%
55.98%
5.18%
5.84%
5.24%
11.82%
14.52%
12.81%
Staff Cost/ Total Operating Income
Other Expenditure/ Total Operating Income
Key Ratios
9M FY13
9MFY12
EBITDA Margin
26.31%
26.35%
Net Margin
13.45%
12.27%
Total Expenditure/ Total Operating Income
73.69%
73.65%
Raw Material Cost/ Total Operating Income
55.91%
54.45%
5.16%
5.71%
12.61%
13.49%
Staff Cost/ Total Operating Income
Other Expenditure/ Total Operating Income
*Standalone (Source: Capitaline, company reports)
Margins compare favourably with peers
Venus Remedies continued to maintain its margin edge over its midsize phama peers. Its high margin oncology segment which
contributed around 30% to revenue and R&D products which
contributed 25-26% to total revenue are the key drivers of strong
margins.
As research products contribution to revenue is expected to move
up, margins could expand going forward.
Better profitability supporting the growth
9M FY13
Total
Income
EBITDA
EBITDA
Margin
Net
Income
Net
Income
Margin
Ajanta Pharma
5,812
1,507
26%
740
13%
Indoco Remed
4,660
684
15%
298
6%
Natco Pharma
4,696
1,148
24%
687
15%
12,572
2,157
17%
600
5%
7,049
532
8%
-411
-6%
1,683
495
29%
160
10%
Company
Mid-Cap Peers
Nectar Life
Parabolic Drugs
Injectable Peers
Strides Arcolab
Four-S Research
4
5. 22 Apr 2013
Company Report: Venus Remedies
Ahlcon Parenterals
760
169
22%
83
11%
Parenteral Drug
213
-14
-7%
-76
-36%
Claris Life
582
218
37%
82
14%
Kilitch drugs
260
39
15%
28
11%
Average
3,190
578
19%
183
4%
Venus
3,341
884
27%
452
14%
(Source: Capitaline, company reports)
Rs mn
Q3’FY13
Company
Total
Income
EBITDA
EBITDA
Margin
Net
Income
Net Income
Margin
Ajanta Pharma
2,257
603
27%
326
14%
Indoco Remed
1,503
197
13%
74
5%
Natco Pharma
1,601
458
29%
262
16%
Nectar Life
3,689
761
21%
215
6%
Parabolic Drugs
1,503
66
4%
-256
-17%
5,973
1526
26%
554
9%
Ahlcon Parenterals
272
76
28%
43
16%
Parenteral Drug
689
-36
-5%
-261
-38%
1,936
693
36%
252
13%
Mid-Cap Peers
Injectable Peers
Strides Arcolab
Claris Life
41
4
11%
1
3%
Average
1,946
435
19%
110
3%
Venus
1,116
299
27%
161
14%
Kilitch drugs
R&D investments showing results
Signs marketing rights deal with South African pharma major
Signs outlicensing deal in
South Africa for
Potentox
After 10 years of hard work in building its R&D product portfolio,
Venus Remedies has started to realize benefits from its R&D pipeline.
The company has made positive stride towards commercialisation of
its R&D IP, with its first out-licensing deal for its R&D products. The
company signed an exclusive marketing rights deal with major South
African pharma major, Adcock, for its research product Potentox.
Commercial details for this deal are not available.
Adcock Ingram is a 120 year old $2bn market cap company with 10%
market share in South African market. Adcock Ingram has got the
exclusive marketing rights for 15 years and they will be bringing the
product into the market by mid of 2015.
Four-S Research
5
6. Company Report: Venus Remedies
22 Apr 2013
Potentox is an AMR efficient anti-biotic product used for Hospital
acquired Pneumonia and Febrile Neutropenia infections. The company
has patents in USA, Canada, New Zealand, South Korea, South Africa
and Ukraine for Potentox.
We expect more similar deals in 2013. With its 25 R&D products
kitty, and more than 80 approved patents and 360 applied patents,
the company has the potential to make many more such deals.
Vancoplus receives patents from Canada and Mexico
Gets its first
patents in
Canada and
Mexico
Venus Remedies received 2 significant patents for Vancoplus from
Canada and Mexico. These are the first patents received by the
company from these countries. Vancoplus is an ‘Antibiotic Adjuvant
Entity’ (AAE) constituting Ceftriaxone plus Vancomycin along with
an
adjuvant. Vancoplus helps in restricting and fighting MRSA
(Methicillin Resistant Staphylococcus Aureus) and further helps in
reducing treatment costs and time.
The patent from Canada is important for Venus Remedies as it will
allow the company to reach out to the 3rd fastest growing market
globally.
The patent in Mexio is also the first in that country for Venus,
opening the gates of second leading market in the Latin America
region.
There market for MRSA medicines is fast growing with growing MRSA
cases all over the world. Vancoplus has turned out to be a successful
product for the company till now with strong revenue growth of 50%
for last 3 years with good traction from domestic as well as emerging
markets across the globe. Vancoplus also gave the first US patent for
the company. Vancoplus also has patents from South Africa, New
Zealand, Ukraine and Australia and is expecting patents from Russia,
Brazil and Japan soon.
Elores: A US patented product launched in India
Launches
Elores, a
powerful
antibiotic,
highly effective
against
Superbugs
Four-S Research
The company has launched its one of the most anticipated products
from its AMR product kitty, ‘Elores’, in Jan 2013. It is a novel
Antibiotic Adjuvant Entity (AAE) to combat antimicrobial resistance
caused by multi drug resistant, ESBL (Extended-spectrum betalactamase) producing strains. Due to its efficacy over AMR, Elores
has edge over most of its competitors in the market.
Elores has a Antibiotic Adjuvant Entity which makes it effective
against even the toughest carbapenemase resistant Metallo-betalactamses. This makes Elores fight even with ‘Superbugs’ which are
very difficult to treat due to antibiotic resistance.
6
7. Company Report: Venus Remedies
22 Apr 2013
Patents all over the globe
Elores is a strongly patented product with patents from more than 40
countries all over the globe. It has got patents from US, Australia,
Brazil and 37 EU countries. The company has also applied for market
authorization in EU and is expecting to get it soon. Patents are also
expected from South Korea, Japan and UAE.
Elores- Mechanism
Elores is
effective against
multi drug
resistant (MDR)
pathogens
Elores basically consists of an anti-biotic, third generation
cephalosporin, along with non antibiotic adjuvant, Disodium Edetate.
This third generation cephalosporin works as an inhibitor for beta
lactamase. Beta lactamase is an enzyme used by bacteria to resist
effect of anti-biotics. This unique antibiotics-adjuvant-entity creates a
synergistic effect due to its activity on acquired multiple resistance in
Gram Negative Enterococci and Rods, and acts by multiple
mechanisms.
Elores is effective against toughest multi drug resistant (MDR)
pathogens/bacteria which are not susceptible to most of the existing
antibiotics. MDR pathogens have developed resistance to anti-biotics
by creating enzymes such as Metallo-beta-lactamase (MBL) or NDM-1
(New Delhi metallo-beta-lactamase 1) or ESBL (Extended spectrum
beta lactamases) which can break down many common antibiotics.
Elores increases cell permeability while working on Cell
impermeability mechanism of MDRs, regulate 'Efflux pump over
expression', breaks bacterial 'Biofilms', prevents 'Transfer of resistant
plasmid' and hence the spread of resistance is controlled. So Elores
not only kills resistant pathogens (Bacteria) but also prevents the
spread of the resistance.
Domestic market for Elores
As per the company’s data, Elores can manage to reduce the
hospitalization bills for a patient by 30% and drug cost by 50%.
Venus’s study finds that, on an average, a patient with hospitalacquired infections stays in hospital for 23 days and in ICU for 11.3
days. Elores can significantly bring down these statistics and so the
cost for these patients.
As per company provided data, out of total Rs 850cr anti-biotic
market in India, Rs 248cr market is contributed to AMR due to
ESBL/MBL resistance. Out of this Venus Remedies is planning to
capture the market share of Rs 200cr within next 5 years.
Plans to launch in international market
The company is planning to launch Elores in South Korea in next
year. It is also waiting for regulatory approval from EU region. Once
it gets that it will be launching Elores in EU market too.
With patents in US and other regulated countries, the company will
Four-S Research
7
8. Company Report: Venus Remedies
22 Apr 2013
commercialise the product by out-licensing it in these regions.
The total Antibacterial Market in North America is $6,768mn and
$7,156mn in Europe. Elores faces a competitive market of around
$2,000mn in North America and $2,500mn in Europe
‘Trois’ launched - patent protected topical nano-emulsion for
arthritic pain
Trios targets
rheumatoid
arthritis
Another patented product from R&D efforts of Venus Remedies, Trois,
was launched in India in this period. Trois is a topical nano-emulsion
product based on natural medicines for arthritic pain. As per the
company it is the only drug available in the market for treating
arthritis without any side effects. Many of its competing products
have severe side effects and are cytotoxic (toxic to cells).
Due to this, Trois can be expected to do well in the rheumatoid
arthritis drug market in India. Rheumatoid arthritis drug market in
India is expected to reach $672mn by end of this year.
Four-S Research
8
9. 22 Apr 2013
Company Report: Venus Remedies
Valuation: Still cheap despite recent gains
Price
Market
Cap
EV
TTM
Sales
TTM
EBITDA
613
15934
17816
7538
1886
976
16.3
2.4
9.4
63
5962
6999
6136
902
423
14.1
1.1
7.8
425
13652
15872
6112
1413
733
18.6
2.6
11.2
16
3342
13511
16510
2879
755
4.4
0.8
4.7
8
432
5632
9709
901
-321
-1.3
0.6
6.3
Strides Arcolab
861
49454
72521
22104
12394
8462
5.8
3.3
5.9
Ahlcon Parent(I)*
353
2376
2586
935
190
85
27.9
2.8
13.6
Parenteral Drugs
100
2666
6362
2944
-336
-1185
-2.3
2.2
-18.9
Claris Lifescien
188
11500
14016
7627
2711
1039
11.1
1.8
5.2
Kilitch Drugs
23
291
262
427
905
694
0.4
0.6
0.3
Venus
Remedies*
252
2652
4873
4475
1176
608
4.4
1.1
4.1
Company
TTM
PAT
P/E
EV/
Sales
EV/
EBITDA
Mid-Cap Peers
Ajanta Pharma*
Indoco Remedies*
Natco Pharma
Nectar Lifesci.*
Parabolic Drugs*
Injectible Peers
Rs mn*Standalone (Source: Capitaline, company reports)
PE Band chart
Strong upside
possible if R&D
results keep
coming in 2013
Four-S Research
Venus continues to trade at low absolute valuations, and much below
peer averages.
It is currently trading at a ttm P/E of 4.4x and ttm EV/EBITDA of
4.1x. The company can have a strong upside going forward, if it
continues to show results from its R&D pipeline.
9
10. 22 Apr 2013
Company Report: Venus Remedies
Financial Annexure
Profit & Loss Statement
Income Statement
FY'08
FY'09
FY'10
FY'11
FY'12
FY'13 9M
Gross Sales
2,165
2,692
3,144
3,637
4,106
3,341
9
4
4
6
7
0
3,360
Less : Excise Duty
2,156
2,688
3,140
3,631
4,098
-48
-82
-62
-39
-92
-61
1336
1668
1885
2054
2351
1940
73
107
147
171
174
0
119
141
167
200
248
174
Power & Fuel Cost
19
20
17
27
27
0
Selling and Distribution Expenses
62
98
153
198
230
0
Administrative & Other expenses
57
87
91
119
130
424
0
Revenue from Operations
Decrease/(Increase) in Stock
Raw Materials Consumed
Manufacturing/Other expenses
Payments to and provision for
employees
Miscellaneous Expenses
Total Expenses
EBITDA
Depreciation
25
23
14
9
2
1,643
2,063
2,413
2,739
3,070
2,476
512
625
728
892
1,028
884
50
68
125
181
250
238
647
462
558
603
711
778
Other Income
19
3
2
4
5
7
Financial Expenses
Profit before tax and
Exceptional Items
48
84
141
189
275
183
433
477
464
526
508
471
Exceptional Items
-
-
-
-
-
-
Profit before tax
433
477
464
526
508
471
75
37
68
64
38
19
358
440
396
462
470
452
462
470
452
EBIT
Tax
Profit after tax before minority
interest
Reported net profit
358
440
396
(Rs mn), consolidated financials
Four-S Research
10
11. Company Report: Venus Remedies
22 Apr 2013
Balance Sheet
Balance Sheet
FY'08
FY'09
FY'10
FY'11
FY'12
85
85
85
91
97
784
1,259
1,627
2,236
2,885
-
-
-
42
90
3,073
Shareholder's Equity
Share Capital
Reserves and Surplus
Money received against share warrants
Total equity capital
890
1,386
1,712
2,369
475
698
917
1,648
1,966
482
618
577
221
237
76
91
-
22
27
4,351
5,303
Liabilities
Secured Loans
Unsecured Loans
Deferred Tax Liability
Other Liabilities
42
60
Total Liabilities and Owner's Equity
1,889
2,762
3,281
-
-
-
-
4,302
Assets
Goodwill on consolidation
Gross Block
Less: Depreciation
Net Fixed Assets
Work-in-progress
Investments
Inventory
Debtors
Cash and Bank Balance
Other Current Assets
Loans and Advances
Total Current Assets
Other Assets
Current Liabilities
Provision
Total Current Liabilities
Net Current Assets
Total Assets
1,526
2,096
2,609
3,429
138
192
314
496
749
1388
1905
2295
2933
3553
14
8
7
145
230
-
-
-
-
963
278
446
619
754
169
330
283
357
406
11
16
24
31
167
0
0
0
0
0
183
239
260
241
298
1,520
1,521
1,522
139
260
181
140
1,518
1,519
86
113
98
114
106
92
121
143
192
205
220
257
321
1513
5303
449
825
967
1127
1889
2762
3281
4,351
(Rs mn)
Four-S Research
11
12. 22 Apr 2013
Company Report: Venus Remedies
Cash Flow Statement
Cash Flow Statement
Net Profit/(Loss) before Tax
FY'08
FY'09
FY'10
FY'11
FY'12
433
477
464
526
509
50
52
125
182
113
4
2
2
0
0
Expenses Amortised
Adjustment of excess mat Transferred to gen
reserve
15
14
13
9
140
0
0
-15
53
38
Adjustment for FBT
-2
-3
25
4
9
500
541
613
774
0
-275
-275
-148
-327
-352
-33
-72
-123
-73
-39
-2
-4
0
0
0
190
189
342
373
417
0
0
0
0
0
Operating Cash flow- A
190
189
342
373
417
Purchase/Sale of Fixed Assets (net)
-743
-570
-512
-820
-873
403
6
0
-144
-77
1
0
0
0
0
Cash from Investing activities- B
-338
-564
-512
-964
-951
Proceeds from Issue of Share Capital
0
0
0
48
6
proceed from share capital(share premium)
-26
198
0
175
166
Proceeds from Long Term Borrowing( Net)
133
160
25
731
112
Proceeds from Short term Borrowing( Net)
22
20
153
-357
201
Depreciation
Deferred Employee Compensations
Operating Cash flow before Wcap
Adjustments for increase /decrease in Current
Assets
Decrease / Increase in Current Liabilities/
Provisions
Extraordinary Items
Cash Generated from Operations
Direct Taxes Paid
Decrease in Capital Work-in-Progress (including
capital advances)
Interest received
Proceeds from share warrants
48
Cash from Financing activities- C
129
379
178
598
533
Change in Cash= A+B+C
-19
5
8
7
-2
Opening Balance
30
11
13
24
31
Closing Balance
11
16
21
31
29
(Rs mn)
Four-S Research
12
14. Company Report: Venus Remedies
22 Apr 2013
About Four-S Services
Founded in 2002, Four-S Services is a financial boutique providing Research, Financial
Consulting and Investment Banking services. We have executed more than 100+
mandates across diverse range of industries for Indian as well as global companies,
investment firms and private equity and venture capital firms.
Our clients value our focused, actionable advice which is based on deep domain
expertise in Education, Financial Services, Media & Entertainment, Healthcare,
Consumer Goods, Automotive, Energy, Logistics and Manufacturing. For further
information on the company please visit www.four-s.com
Disclaimer
The information contained herein has been obtained from sources believed to be
reliable but is not necessarily complete and its accuracy cannot be guaranteed. No
representation, warranty, guarantee or undertaking, express or implied, is made as to
the fairness, accuracy or completeness of any information, projections or opinions
contained in this document. Four-S Services Pvt. Ltd. will not accept any liability
whatsoever, with respect to the use of this document or its contents. This Company
commissioned document has been distributed for information purposes only and does
not constitute or form part of any offer or solicitation of any offer to buy or sell any
securities. This document shall not form the basis of and should not be relied upon in
connection with any contract or commitment whatsoever. This document is not to be
reported or copied or made available to others.
Four-S may from time to time solicit from, or perform consulting or other services for
any company mentioned in this document.
For further details/clarifications please contact:
Alok Somwanshi
Ajay Jindal
Alok.somwanshi@four-s.com
Ajay.jindal@four-s.com
Tel: +91-22-42153659
Tel: +91-22-42153659
Four-S Research
14