Más contenido relacionado Similar a Business Analytics‹#›© 2021 Cengage Learning. All Ri (20) Más de VannaSchrader3 (20) 1. Business Analytics
‹#›
© 2021 Cengage Learning. All Rights Reserved. May not be
scanned, copied or duplicated, or posted to a publicly accessible
website, in whole or in part.
Introduction
Chapter 1
© 2021 Cengage Learning. All Rights Reserved. May not be
scanned, copied or duplicated, or posted to a publicly accessible
website, in whole or in part.
Introduction (Slide 1 of 3)
Three developments spurred recent explosive growth in the use
of analytical methods in business applications:
First development:
Technological advances—scanner technology, data collection
through
e-commerce, Internet social networks, and data generated from
personal electronic devices—produce incredible amounts of data
2. for businesses.
Businesses want to use these data to improve the efficiency and
profitability of their operations, better understand their
customers, price their products more effectively, and gain a
competitive advantage.
© 2021 Cengage Learning. All Rights Reserved. May not be
scanned, copied or duplicated, or posted to a publicly accessible
website, in whole or in part.
3
Introduction (Slide 2 of 3)
Three developments spurred recent explosive growth in the use
of analytical methods in business applications (cont.):
Second development:
Ongoing research has resulted in numerous methodological
developments, including:
Advances in computational approaches to effectively handle and
explore massive amounts of data.
Faster algorithms for optimization and simulation.
More effective approaches for visualizing data.
3. © 2021 Cengage Learning. All Rights Reserved. May not be
scanned, copied or duplicated, or posted to a publicly accessible
website, in whole or in part.
4
Introduction (Slide 3 of 3)
Three developments spurred recent explosive growth in the use
of analytical methods in business applications (cont.):
Third development:
The methodological developments were paired with an
explosion in computing power and storage capability.
Better computing hardware, parallel computing, and cloud
computing have enabled businesses to solve big problems faster
and more accurately than ever before.
© 2021 Cengage Learning. All Rights Reserved. May not be
scanned, copied or duplicated, or posted to a publicly accessible
website, in whole or in part.
Cloud computing, the more recent development, is the remote
use of hardware and software over the Internet.
5
Decision Making
4. © 2021 Cengage Learning. All Rights Reserved. May not be
scanned, copied or duplicated, or posted to a publicly access ible
website, in whole or in part.
6
Decision Making (Slide 1 of 4)
Managers’ responsibility:
To make strategic, tactical, or operational decisions.
Strategic decisions:
Involve higher-level issues concerned with the overall direction
of the organization.
Define the organization’s overall goals and aspirations for the
future.
© 2021 Cengage Learning. All Rights Reserved. May not be
scanned, copied or duplicated, or posted to a publicly accessible
website, in whole or in part.
7
Decision Making (Slide 2 of 4)
Tactical decisions:
Concern how the organization should achieve the goals and
objectives set by its strategy.
Are usually the responsibility of midlevel management.
Operational decisions:
Affect how the firm is run from day to day.
Are the domain of operations managers, who are the closest to
5. the customer.
© 2021 Cengage Learning. All Rights Reserved. May not be
scanned, copied or duplicated, or posted to a publicly accessible
website, in whole or in part.
8
Decision Making (Slide 3 of 4)
Decision making can be defined as the following process:
Identify and define the problem.
Determine the criteria that will be used to evaluate alternative
solutions.
Determine the set of alternative solutions.
Evaluate the alternatives.
Choose an alternative.
© 2021 Cengage Learning. All Rights Reserved. May not be
scanned, copied or duplicated, or posted to a publicly accessible
website, in whole or in part.
Consider the case of the Thoroughbred Running Company
(TRC). Historically, TRC had been a catalog-based retail seller
of running shoes and apparel. TRC sales revenue grew quickly
6. as it changed its emphasis from catalog-based sales to Internet-
based sales.
Recently, TRC decided that it should also establish retail stores
in the malls and downtown areas of major cities. This is a
strategic decision that will take the firm in a new direction that
it hopes will complement its Internet-based strategy.
TRC middle managers will therefore have to make a variety of
tactical decisions in support of this strategic decision, including
how many new stores to open this year, where to open these
new stores, how many distribution centers will be needed to
support the new stores, and where to locate these distribution
centers.
Operations managers in the stores will need to make day-to-day
decisions regarding, for instance, how many pairs of each model
and size of shoes to order
from the distribution centers and how to schedule their sales
personnel.
9
Decision Making (Slide 4 of 4)
Common approaches to making decisions include:
Tradition.
Intuition.
Rules of thumb.
Using the relevant data available.
© 2021 Cengage Learning. All Rights Reserved. May not be
scanned, copied or duplicated, or posted to a publicly accessible
website, in whole or in part.
7. 10
Business Analytics Defined
© 2021 Cengage Learning. All Rights Reserved. May not be
scanned, copied or duplicated, or posted to a publicly accessible
website, in whole or in part.
Business Analytics Defined (Slide 1 of 2)
Business analytics:
Scientific process of transforming data into insight for making
better decisions.
Used for data-driven or fact-based decision making, which is
often seen as more objective than other alternatives for decision
making.
© 2021 Cengage Learning. All Rights Reserved. May not be
scanned, copied or duplicated, or posted to a publicly accessible
website, in whole or in part.
12
Business Analytics Defined (Slide 2 of 2)
Tools of business analytics can aid decision making by:
Creating insights from data.
Improving our ability to more accurately forecast for planning.
8. Helping us quantify risk.
Yielding better alternatives through analysis and optimization.
© 2021 Cengage Learning. All Rights Reserved. May not be
scanned, copied or duplicated, or posted to a publicly accessible
website, in whole or in part.
A Categorization of Analytical Methods and Models
Descriptive Analytics
Predictive Analytics
Prescriptive Analytics
© 2021 Cengage Learning. All Rights Reserved. May not be
scanned, copied or duplicated, or posted to a publicly accessible
website, in whole or in part.
14
A Categorization of Analytical Methods and Models (Slide 1 of
8)
Descriptive Analytics:
Descriptive analytics: Encompasses the set of techniques that
describes what has happened in the past; examples include:
Data queries.
Reports.
Descriptive statistics.
Data visualization (including data dashboards).
9. Data-mining techniques.
Basic what-if spreadsheet models.
Data query: A request for information with certain
characteristics from a database.
© 2021 Cengage Learning. All Rights Reserved. May not be
scanned, copied or duplicated, or posted to a publicly accessible
website, in whole or in part.
A Categorization of Analytical Methods and Models (Slide 2 of
8)
Descriptive Analytics (cont.):
Data dashboards: Collections of tables, charts, maps, and
summary statistics that are updated as new data become
available.
Uses of dashboards:
To help management monitor specific aspects of the company’s
performance related to their decision-making responsibilities.
For corporate-level managers, daily data dashboards might
summarize sales by region, current inventory levels, and other
company-wide metrics.
Front-line managers may view dashboards that contain metrics
related to staffing levels, local inventory levels, and short-term
sales forecasts.
10. © 2021 Cengage Learning. All Rights Reserved. May not be
scanned, copied or duplicated, or posted to a publicly accessible
website, in whole or in part.
A Categorization of Analytical Methods and Models (Slide 3 of
8)
Descriptive Analytics (cont.):
Data mining: The use of analytical techniques for better
understanding patterns and relationships that exist in large data
sets.
Examples of data-mining techniques include:
Cluster analysis.
Sentiment analysis.
© 2021 Cengage Learning. All Rights Reserved. May not be
scanned, copied or duplicated, or posted to a publicly accessible
website, in whole or in part.
A Categorization of Analytical Methods and Models (Slide 4 of
8)
Predictive Analytics:
Predictive analytics: Consists of techniques that use models
constructed from past data to predict the future or ascertain the
impact of one variable on another.
Survey data and past purchase behavior may be used to help
predict the market share of a new product.
11. © 2021 Cengage Learning. All Rights Reserved. May not be
scanned, copied or duplicated, or posted to a publicly accessible
website, in whole or in part.
18
A Categorization of Analytical Methods and Models (Slide 5 of
8)
Predictive Analytics (cont.):
Techniques used in Predictive Analytics include:
Linear regression.
Time series analysis.
Data mining is used to find patterns or relationships among
elements of the data in a large database; often used in predictive
analytics.
Simulation involves the use of probability and statistics to
construct a computer model to study the impact of uncertainty
on a decision.
© 2021 Cengage Learning. All Rights Reserved. May not be
scanned, copied or duplicated, or posted to a publicly accessible
website, in whole or in part.
Example for Data Mining:
A large grocery store chain might be interested in developing a
new targeted marketing campaign that offers a discount coupon
on potato chips.
By studying historical point-of-sale data, the store may be able
to use data mining to predict which customers are the most
likely to respond to an offer on discounted chips by purchasing
12. higher-margin items such as beer or soft drinks in addition to
the chips, thus increasing the store’s overall revenue.
Example for Simulation:
Banks often use simulation to model investment and default risk
in order to stress-test financial models.
Used in the pharmaceutical industry to assess the risk of
introducing a new drug.
19
A Categorization of Analytical Methods and Models (Slide 6 of
8)
Prescriptive Analytics:
Prescriptive Analytics: Indicates a best course of action to take:
Provide a forecast or prediction, but do not provide a decision.
A forecast or prediction, when combined with a rule, becomes a
prescriptive model.
Prescriptive models that rely on a rule or set of rules are often
referred to as rule-based models.
© 2021 Cengage Learning. All Rights Reserved. May not be
scanned, copied or duplicated, or posted to a publicly accessible
website, in whole or in part.
A Categorization of Analytical Methods and Models (Slide 7 of
8)
Prescriptive Analytics (cont.):
13. ModelFieldPurposePortfolio modelsFinance
Use historical investment return data to determine the mix of
investments that yield the highest expected return while
controlling or limiting exposure to risk.Supply network
design modelsOperationsProvide the cost-minimizing plant and
distribution center locations subject to meeting the customer
service requirements.Price-markdown modelsRetailingUse
historical data to yield revenue-maximizing discount levels and
the timing of discount offers when goods have not sold as
planned.
Optimization models: Models that give the best decision subject
to constraints of the situation.
© 2021 Cengage Learning. All Rights Reserved. May not be
scanned, copied or duplicated, or posted to a publicly accessible
website, in whole or in part.
21
A Categorization of Analytical Methods and Models (Slide 8 of
8)
Prescriptive Analytics (cont.):
Simulation optimization: Combines the use of probability and
statistics to model uncertainty with optimization techniques to
find good decisions in highly complex and highly uncertain
settings.
Decision analysis:
Used to develop an optimal strategy when a decision maker is
faced with several decision alternatives and an uncertain set of
14. future events.
Employs utility theory, which assigns values to outcomes based
on the decision maker’s attitude toward risk, loss, and other
factors.
© 2021 Cengage Learning. All Rights Reserved. May not be
scanned, copied or duplicated, or posted to a publicly accessible
website, in whole or in part.
Big Data
Volume
Velocity
Variety
Veracity
© 2021 Cengage Learning. All Rights Reserved. May not be
scanned, copied or duplicated, or posted to a publicly accessible
website, in whole or in part.
23
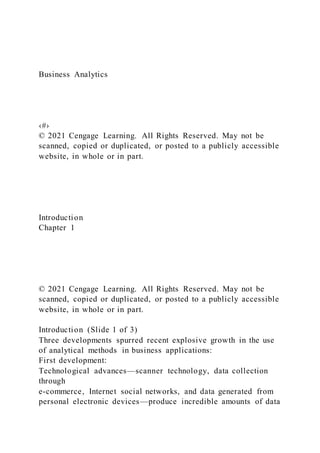
Big Data (Slide 1 of 7)
Big data: Any set of data that is too large or too complex to be
handled by standard data-processing techniques and typical
desktop software.
IBM describes the phenomenon of big data through the four Vs
15. (as shown in Figure 1.1):
Volume.
Velocity.
Variety.
Veracity.
© 2021 Cengage Learning. All Rights Reserved. May not be
scanned, copied or duplicated, or posted to a publicly accessible
website, in whole or in part.
Walmart handles over one million purchase transactions per
hour.
Facebook processes more than 250 million picture uploads per
day.
24
Big Data (Slide 2 of 7)
Figure 1.1: The 4 Vs of Big Data
Source: IBM
© 2021 Cengage Learning. All Rights Reserved. May not be
scanned, copied or duplicated, or posted to a publicly accessible
website, in whole or in part.
16. Big Data (Slide 3 of 7)
Volume:
Because data are collected electronically, we are able to collect
more of it.
To be useful, these data must be stored, and this storage has led
to vast quantities of data.
Velocity:
Real-time capture and analysis of data present unique
challenges both in how data are stored and the speed with which
those data can be analyzed for decision making.
© 2021 Cengage Learning. All Rights Reserved. May not be
scanned, copied or duplicated, or posted to a publicly accessible
website, in whole or in part.
Big Data (Slide 4 of 7)
Variety:
More complicated types of data are now available and are
proving to be of great value to businesses.
Text data are collected by monitoring what is being said about a
company’s products or services on social media platforms.
Audio data are collected from service calls.
Video data are collected by in-store video cameras and used to
analyze shopping behavior.
Analyzing information generated by these nontraditional
sources is more complicated in part because of the processing
required to transform the data into a numerical form that can be
analyzed.
17. © 2021 Cengage Learning. All Rights Reserved. May not be
scanned, copied or duplicated, or posted to a publicly accessible
website, in whole or in part.
Big Data (Slide 5 of 7)
Veracity:
Veracity has to do with how much uncertainty is in the data.
Inconsistencies in units of measure and the lack of reliability of
responses in terms of bias also increase the complexity of the
data.
© 2021 Cengage Learning. All Rights Reserved. May not be
scanned, copied or duplicated, or posted to a publicly accessible
website, in whole or in part.
Big Data (Slide 6 of 7)
Represents opportunities.
Presents challenges in terms of data storage and processing,
security, and available analytical talent.
The four Vs have led to new technologies:
Hadoop: An open-source programming environment that
supports big data processing through distributed storage and
processing on clusters of computers.
MapReduce: A programming model used within Hadoop that
performs two major steps: the map step and the reduce step.
18. © 2021 Cengage Learning. All Rights Reserved. May not be
scanned, copied or duplicated, or posted to a publicly accessible
website, in whole or in part.
Big Data (Slide 7 of 7)
Data security, the protection of stored data from destructive
forces or unauthorized users, is of critical importance to
companies.
The complexities of the 4 Vs have increased the demand for
analysts, but a shortage of qualified analysts has made hiring
more challenging.
More companies are searching for data scientists, who know
how to process and analyze massive amounts of data.
The Internet of Things (IoT) is the technology that allows data,
collected from sensors in all types of machines, to be sent over
the Internet to repositories where it can be stored and analyzed.
© 2021 Cengage Learning. All Rights Reserved. May not be
scanned, copied or duplicated, or posted to a publicly accessible
website, in whole or in part.
Business Analytics in Practice
Financial Analytics
Human Resource (HR) Analytics
Marketing Analytics
Health Care Analytics
Supply-Chain Analytics
Analytics for Government and Nonprofits
19. Sports Analytics
Web Analytics
© 2021 Cengage Learning. All Rights Reserved. May not be
scanned, copied or duplicated, or posted to a publicly accessible
website, in whole or in part.
31
Business Analytics in Practice (Slide 1 of 11)
Figure 1.2: The Spectrum of Business Analytics
Source: Adapted from SAS
© 2021 Cengage Learning. All Rights Reserved. May not be
scanned, copied or duplicated, or posted to a publicly accessible
website, in whole or in part.
32
Business Analytics in Practice (Slide 2 of 11)
Predictive and prescriptive analytics are sometimes referred to
as advanced analytics.
Financial Analytics:
Use of predictive models to:
Forecast financial performance.
20. Assess the risk of investment portfolios and projects.
Construct financial instruments such as derivatives.
Construct optimal portfolios of investments.
Allocate assets.
Create optimal capital budgeting plans.
Simulation is also often used to assess risk in the financial
sector.
© 2021 Cengage Learning. All Rights Reserved. May not be
scanned, copied or duplicated, or posted to a publicly accessible
website, in whole or in part.
33
Business Analytics in Practice (Slide 3 of 11)
Human Resource (HR) Analytics:
New area of application for analytics.
The HR function is charged with ensuring that the organization:
Has the mix of skill sets necessary to meet its needs.
Is hiring the highest-quality talent and providing an
environment that retains it.
Achieves its organizational diversity goals.
© 2021 Cengage Learning. All Rights Reserved. May not be
scanned, copied or duplicated, or posted to a publicly accessible
website, in whole or in part.
21. Example for Human Resource (HR) Analytics:
Google has analyzed substantial data on its own employees to
determine the characteristics of great leaders, to assess factors
that contribute to productivity, and to evaluate potential new
hires.
Google also uses predictive analytics to continually update its
forecast of future employee turnover and retention.
34
Business Analytics in Practice (Slide 4 of 11)
Marketing Analytics:
Marketing is one of the fastest-growing areas for the application
of analytics.
A better understanding of consumer behavior through the use of
scanner data and data generated from social media has led to an
increased interest in marketing analytics.
© 2021 Cengage Learning. All Rights Reserved. May not be
scanned, copied or duplicated, or posted to a publicly accessible
website, in whole or in part.
35
Business Analytics in Practice (Slide 5 of 11)
Marketing Analytics (cont.):
A better understanding of consumer behavior through marketing
22. analytics leads to:
Better use of advertising budgets.
More effective pricing strategies.
Improved forecasting of demand.
Improved product-line management.
Increased customer satisfaction and loyalty.
© 2021 Cengage Learning. All Rights Reserved. May not be
scanned, copied or duplicated, or posted to a publicly accessible
website, in whole or in part.
Example of high-impact marketing analytics:
Automobile manufacturer Chrysler teamed with J.D. Power and
Associates to develop an innovate set of predictive models to
support its pricing decisions for automobiles.
These models help Chrysler to better understand the
ramifications of proposed pricing structures (a combination of
manufacturer’s suggested retail price, interest rate offers, and
rebates) and, as a result, to improve its pricing decisions.
The models have generated an estimated annual savings of $500
million.
36
Business Analytics in Practice (Slide 6 of 11)
23. Health Care Analytics:
Descriptive, predictive, and prescriptive analytics are used to
improve:
Patient, staff, and facility scheduling.
Patient flow.
Purchasing.
Inventory control.
Use of prescriptive analytics for diagnosis and treatment may
prove to be the most important application of analytics in health
care.
© 2021 Cengage Learning. All Rights Reserved. May not be
scanned, copied or duplicated, or posted to a publicly accessible
website, in whole or in part.
Example for use of prescriptive analytics for diagnosis and
treatment:
A group of scientists in Georgia used predictive models and
optimization to develop personalized treatment for diabetes.
They developed a predictive model that uses fluid dynamics and
patient monitoring data to establish the relationship between
drug dosage and drug effect at the individual level.
Alleviates the need for more invasive procedures to monitor
drug concentration.
37
Business Analytics in Practice (Slide 7 of 11)
Supply-Chain Analytics:
The core service of companies such as UPS and FedEx is the
24. efficient delivery of goods, and analytics has long been used to
achieve efficiency.
The optimal sorting of goods, vehicle and staff scheduling, and
vehicle routing are all key to profitability for logistics
companies such as UPS and FedEx.
Companies can benefit from better inventory and processing
control and more efficient supply chains.
© 2021 Cengage Learning. All Rights Reserved. May not be
scanned, copied or duplicated, or posted to a publicly accessible
website, in whole or in part.
Example for supply chain analytics:
ConAgra Foods uses predictive and prescriptive analytics to
better plan capacity utilization by incorporating the inherent
uncertainty in commodities pricing.
ConAgra realized a 100% return on its investment in analytics
in under three months—an unheard of result for a major
technology investment.
38
Business Analytics in Practice (Slide 8 of 11)
Analytics for Government and Nonprofits:
Analytics for government to:
Drive out inefficiencies.
Increase the effectiveness and accountability of programs.
25. Analytics for nonprofit agencies to ensure their effectiveness
and accountability to their donors and clients.
© 2021 Cengage Learning. All Rights Reserved. May not be
scanned, copied or duplicated, or posted to a publicly accessible
website, in whole or in part.
Example of analytics for government agencies:
The New York State Department has worked with IBM to use
prescriptive analytics in the development of a more effective
approach to tax collection. The result was an increase in
collections from delinquent payers of $83 million over two
years.
Example of analytics for nonprofit agencies:
Catholic Relief Services (CRS) is the official international
humanitarian agency of the U.S. Catholic community. The CRS
mission is to provide relief for the victims of both natural and
human-made disasters and to help people in need around the
world through its health, educational, and agricultural
programs.
CRS uses an analytical spreadsheet model to assist in the
allocation of its annual budget based on the impact that its
various relief efforts and programs will have in different
countries.
39
Business Analytics in Practice (Slide 9 of 11)
Sports Analytics
Professional sports teams use to:
26. Assess players for the amateur drafts.
Decide how much to offer players in contract negotiations.
Professional motorcycle racing teams use sophisticated
optimization for gearbox design to gain competitive advantage.
Teams use to assist with on-field decisions such as which
pitchers to use in various games of a MLB playoff series.
© 2021 Cengage Learning. All Rights Reserved. May not be
scanned, copied or duplicated, or posted to a publicly access ible
website, in whole or in part.
40
Business Analytics in Practice (Slide 10 of 11)
Sports Analytics (cont.):
The use of analytics for off-the-field business decisions is
increasing rapidly.
Using prescriptive analytics, franchises across several maj or
sports dynamically adjust ticket prices throughout the season to
reflect the relative attractiveness and potential demand for each
game.
27. © 2021 Cengage Learning. All Rights Reserved. May not be
scanned, copied or duplicated, or posted to a publ icly accessible
website, in whole or in part.
41
Business Analytics in Practice (Slide 11 of 11)
Web Analytics:
The analysis of online activity, which includes, but is not
limited to, visits to web sites and social media sites such as
Facebook and LinkedIn.
Leading companies apply descriptive and advanced analytics to
data collected in online experiments to determine the best way
to:
Configure web sites.
Position ads.
Utilize social networks for the promotion of products and
services.
© 2021 Cengage Learning. All Rights Reserved. May not be
scanned, copied or duplicated, or posted to a publicly accessible
website, in whole or in part.
Online experimentation involves exposing various subgroups to
different versions of a web site and tracking the results.
Because of the massive pool of Internet users, experiments can
be conducted without risking the disruption of the overall
business of the company.
28. Such experiments are proving to be invaluable because they
enable the company to use trial-and-error in determining
statistically what makes a difference in their web site traffic and
sales.
42
Legal and Ethical Issues in the Use of Data and Analytics
© 2021 Cengage Learning. All Rights Reserved. May not be
scanned, copied or duplicated, or posted to a publicly accessible
website, in whole or in part.
43
Legal and Ethical Issues in the Use of Data and Analytics(Slide
1 of 4)
Increased attention has been paid to ethical concerns around
data privacy and the ethical use of models based on data.
Companies have an obligation to protect the data and to not
misuse that data.
Clients and customers have an obligation to understand trade-
offs between allowing their data to be collected, and the
benefits they accrue from allowing a company to collect and use
that data.
An agreement must be signed between the customer and the
company.
29. © 2021 Cengage Learning. All Rights Reserved. May not be
scanned, copied or duplicated, or posted to a publicly accessible
website, in whole or in part.
44
Legal and Ethical Issues in the Use of Data and Analytics(Slide
2 of 4)
One of the strictest privacy laws is the General Data Protection
Regulation.
Went into effect in the European Union in May 2018.
Stipulations:
The request for consent to use an individual’s data must be
easily understood and accessible.
The intended use of data must be specified.
Must be easy to withdraw consent.
The individual has a right to a copy of their data and the right to
demand their data be erased.
© 2021 Cengage Learning. All Rights Reserved. May not be
scanned, copied or duplicated, or posted to a publicly accessible
website, in whole or in part.
45
Legal and Ethical Issues in the Use of Data and Analytics(Slide
3 of 4)
Analytics professionals have a responsibility to behave
ethically.
This includes protecting data, being transparent about the data
30. and how it was collected, and what it does and does not contain.
Analysts must be transparent about the methods used to analyze
the data and any assumptions that have to be made for the
methods used.
Analysts must provide valid conclusions and understandable
recommendations to their clients.
© 2021 Cengage Learning. All Rights Reserved. May not be
scanned, copied or duplicated, or posted to a publicly accessible
website, in whole or in part.
46
Legal and Ethical Issues in the Use of Data and Analytics(Slide
4 of 4)
The American Statistical Association (ASA) and the Institute
for Operations Research and the Management Sciences
(INFORMS) provide ethical guidelines for analysts.
The guidelines state that “Good statistical practice is
fundamentally based on transparent assumptions, reproducible
results, and valid interpretations.”
© 2021 Cengage Learning. All Rights Reserved. May not be
scanned, copied or duplicated, or posted to a publicly accessible
website, in whole or in part.
31. 47
End of Chapter 1
© 2021 Cengage Learning. All Rights Reserved. May not be
scanned, copied or duplicated, or posted to a publicly accessible
website, in whole or in part.
Business Analytics
‹#›
© 2021 Cengage Learning. All Rights Reserved. May not be
scanned, copied or duplicated, or posted to a publicly accessible
website, in whole or in part.
Introduction
Chapter 1
© 2021 Cengage Learning. All Rights Reserved. May not be
scanned, copied or duplicated, or posted to a publicly accessible
32. website, in whole or in part.
Introduction (Slide 1 of 3)
Three developments spurred recent explosive growth in the use
of analytical methods in business applications:
First development:
Technological advances—scanner technology, data collection
through
e-commerce, Internet social networks, and data generated from
personal electronic devices—produce incredible amounts of data
for businesses.
Businesses want to use these data to improve the efficiency and
profitability of their operations, better understand their
customers, price their products more effectively, and gain a
competitive advantage.
© 2021 Cengage Learning. All Rights Reserved. May not be
scanned, copied or duplicated, or posted to a publicly accessible
website, in whole or in part.
3
Introduction (Slide 2 of 3)
Three developments spurred recent explosive growth in the use
of analytical methods in business applications (cont.):
Second development:
Ongoing research has resulted in numerous methodological
developments, including:
Advances in computational approaches to effectively handle and
33. explore massive amounts of data.
Faster algorithms for optimization and simulation.
More effective approaches for visualizing data.
© 2021 Cengage Learning. All Rights Reserved. May not be
scanned, copied or duplicated, or posted to a publicly accessible
website, in whole or in part.
4
Introduction (Slide 3 of 3)
Three developments spurred recent explosive growth in the use
of analytical methods in business applications (cont.):
Third development:
The methodological developments were paired with an
explosion in computing power and storage capability.
Better computing hardware, parallel computing, and cloud
computing have enabled businesses to solve big problems faster
and more accurately than ever before.
© 2021 Cengage Learning. All Rights Reserved. May not be
scanned, copied or duplicated, or posted to a publicly accessible
website, in whole or in part.
34. Cloud computing, the more recent development, is the remote
use of hardware and software over the Internet.
5
Decision Making
© 2021 Cengage Learning. All Rights Reserved. May not be
scanned, copied or duplicated, or posted to a publicly accessible
website, in whole or in part.
6
Decision Making (Slide 1 of 4)
Managers’ responsibility:
To make strategic, tactical, or operational decisions.
Strategic decisions:
Involve higher-level issues concerned with the overall direction
of the organization.
Define the organization’s overall goals and aspirations for the
future.
© 2021 Cengage Learning. All Rights Reserved. May not be
scanned, copied or duplicated, or posted to a publicly accessible
website, in whole or in part.
35. 7
Decision Making (Slide 2 of 4)
Tactical decisions:
Concern how the organization should achieve the goals and
objectives set by its strategy.
Are usually the responsibility of midlevel management.
Operational decisions:
Affect how the firm is run from day to day.
Are the domain of operations managers, who are the closest to
the customer.
© 2021 Cengage Learning. All Rights Reserved. May not be
scanned, copied or duplicated, or posted to a publicly accessible
website, in whole or in part.
8
Decision Making (Slide 3 of 4)
Decision making can be defined as the following process:
Identify and define the problem.
Determine the criteria that will be used to evaluate alternative
solutions.
Determine the set of alternative solutions.
Evaluate the alternatives.
Choose an alternative.
36. © 2021 Cengage Learning. All Rights Reserved. May not be
scanned, copied or duplicated, or posted to a publicly accessible
website, in whole or in part.
Consider the case of the Thoroughbred Running Company
(TRC). Historically, TRC had been a catalog-based retail seller
of running shoes and apparel. TRC sales revenue grew quickly
as it changed its emphasis from catalog-based sales to Internet-
based sales.
Recently, TRC decided that it should also establish retail stores
in the malls and downtown areas of major cities. This is a
strategic decision that will take the firm in a new direction that
it hopes will complement its Internet-based strategy.
TRC middle managers will therefore have to make a variety of
tactical decisions in support of this strategic decision, including
how many new stores to open this year, where to open these
new stores, how many distribution centers will be needed to
support the new stores, and where to locate these distribution
centers.
Operations managers in the stores will need to make day-to-day
decisions regarding, for instance, how many pairs of each model
and size of shoes to order
from the distribution centers and how to schedule their sales
personnel.
9
Decision Making (Slide 4 of 4)
Common approaches to making decisions include:
Tradition.
Intuition.
Rules of thumb.
Using the relevant data available.
37. © 2021 Cengage Learning. All Rights Reserved. May not be
scanned, copied or duplicated, or posted to a publicly accessible
website, in whole or in part.
10
Business Analytics Defined
© 2021 Cengage Learning. All Rights Reserved. May not be
scanned, copied or duplicated, or posted to a publicly accessible
website, in whole or in part.
Business Analytics Defined (Slide 1 of 2)
Business analytics:
Scientific process of transforming data into insight for making
better decisions.
Used for data-driven or fact-based decision making, which is
often seen as more objective than other alternatives for decision
making.
© 2021 Cengage Learning. All Rights Reserved. May not be
38. scanned, copied or duplicated, or posted to a publicly accessible
website, in whole or in part.
12
Business Analytics Defined (Slide 2 of 2)
Tools of business analytics can aid decision making by:
Creating insights from data.
Improving our ability to more accurately forecast for planning.
Helping us quantify risk.
Yielding better alternatives through analysis and optimization.
© 2021 Cengage Learning. All Rights Reserved. May not be
scanned, copied or duplicated, or posted to a publicly acces sible
website, in whole or in part.
A Categorization of Analytical Methods and Models
Descriptive Analytics
Predictive Analytics
Prescriptive Analytics
© 2021 Cengage Learning. All Rights Reserved. May not be
scanned, copied or duplicated, or posted to a publicly accessible
website, in whole or in part.
14
39. A Categorization of Analytical Methods and Models (Slide 1 of
8)
Descriptive Analytics:
Descriptive analytics: Encompasses the set of techniques that
describes what has happened in the past; examples include:
Data queries.
Reports.
Descriptive statistics.
Data visualization (including data dashboards).
Data-mining techniques.
Basic what-if spreadsheet models.
Data query: A request for information with certain
characteristics from a database.
© 2021 Cengage Learning. All Rights Reserved. May not be
scanned, copied or duplicated, or posted to a publicly accessible
website, in whole or in part.
A Categorization of Analytical Methods and Models (Slide 2 of
8)
Descriptive Analytics (cont.):
Data dashboards: Collections of tables, charts, maps, and
summary statistics that are updated as new data become
available.
Uses of dashboards:
To help management monitor specific aspects of the company’s
performance related to their decision-making responsibilities.
For corporate-level managers, daily data dashboards might
summarize sales by region, current inventory levels, and other
40. company-wide metrics.
Front-line managers may view dashboards that contain metrics
related to staffing levels, local inventory levels, and short-term
sales forecasts.
© 2021 Cengage Learning. All Rights Reserved. May not be
scanned, copied or duplicated, or posted to a publicly accessible
website, in whole or in part.
A Categorization of Analytical Methods and Models (Sli de 3 of
8)
Descriptive Analytics (cont.):
Data mining: The use of analytical techniques for better
understanding patterns and relationships that exist in large data
sets.
Examples of data-mining techniques include:
Cluster analysis.
Sentiment analysis.
© 2021 Cengage Learning. All Rights Reserved. May not be
scanned, copied or duplicated, or posted to a publicly accessible
website, in whole or in part.
A Categorization of Analytical Methods and Models (Slide 4 of
8)
41. Predictive Analytics:
Predictive analytics: Consists of techniques that use models
constructed from past data to predict the future or ascertain the
impact of one variable on another.
Survey data and past purchase behavior may be used to help
predict the market share of a new product.
© 2021 Cengage Learning. All Rights Reserved. May not be
scanned, copied or duplicated, or posted to a publicly accessible
website, in whole or in part.
18
A Categorization of Analytical Methods and Models (Slide 5 of
8)
Predictive Analytics (cont.):
Techniques used in Predictive Analytics include:
Linear regression.
Time series analysis.
Data mining is used to find patterns or relationships among
elements of the data in a large database; often used in predictive
analytics.
Simulation involves the use of probability and statistics to
construct a computer model to study the impact of uncertainty
on a decision.
© 2021 Cengage Learning. All Rights Reserved. May not be
42. scanned, copied or duplicated, or posted to a publicly accessible
website, in whole or in part.
Example for Data Mining:
A large grocery store chain might be interested in developing a
new targeted marketing campaign that offers a discount coupon
on potato chips.
By studying historical point-of-sale data, the store may be able
to use data mining to predict which customers are the most
likely to respond to an offer on discounted chips by purchasing
higher-margin items such as beer or soft drinks in addition to
the chips, thus increasing the store’s overall revenue.
Example for Simulation:
Banks often use simulation to model investment and default risk
in order to stress-test financial models.
Used in the pharmaceutical industry to assess the risk of
introducing a new drug.
19
A Categorization of Analytical Methods and Models (Slide 6 of
8)
Prescriptive Analytics:
Prescriptive Analytics: Indicates a best course of action to take:
Provide a forecast or prediction, but do not provide a decision.
A forecast or prediction, when combined with a rule, becomes a
prescriptive model.
Prescriptive models that rely on a rule or set of rules are often
referred to as rule-based models.
© 2021 Cengage Learning. All Rights Reserved. May not be
scanned, copied or duplicated, or posted to a publicly accessible
43. website, in whole or in part.
A Categorization of Analytical Methods and Models (Slide 7 of
8)
Prescriptive Analytics (cont.):
ModelFieldPurposePortfolio modelsFinance
Use historical investment return data to determine the mix of
investments that yield the highest expected return while
controlling or limiting exposure to risk.Supply network
design modelsOperationsProvide the cost-minimizing plant and
distribution center locations subject to meeting the customer
service requirements.Price-markdown modelsRetailingUse
historical data to yield revenue-maximizing discount levels and
the timing of discount offers when goods have not sold as
planned.
Optimization models: Models that give the best decision subject
to constraints of the situation.
© 2021 Cengage Learning. All Rights Reserved. May not be
scanned, copied or duplicated, or posted to a publicly accessible
website, in whole or in part.
21
44. A Categorization of Analytical Methods and Models (Slide 8 of
8)
Prescriptive Analytics (cont.):
Simulation optimization: Combines the use of probability and
statistics to model uncertainty with optimization techniques to
find good decisions in highly complex and highly uncertain
settings.
Decision analysis:
Used to develop an optimal strategy when a decision maker is
faced with several decision alternatives and an uncertain set of
future events.
Employs utility theory, which assigns values to outcomes based
on the decision maker’s attitude toward risk, loss, and other
factors.
© 2021 Cengage Learning. All Rights Reserved. May not be
scanned, copied or duplicated, or posted to a publicly accessible
website, in whole or in part.
Big Data
Volume
Velocity
Variety
Veracity
© 2021 Cengage Learning. All Rights Reserved. May not be
scanned, copied or duplicated, or posted to a publicly accessib le
45. website, in whole or in part.
23
Big Data (Slide 1 of 7)
Big data: Any set of data that is too large or too complex to be
handled by standard data-processing techniques and typical
desktop software.
IBM describes the phenomenon of big data through the four Vs
(as shown in Figure 1.1):
Volume.
Velocity.
Variety.
Veracity.
© 2021 Cengage Learning. All Rights Reserved. May not be
scanned, copied or duplicated, or posted to a publicly accessible
website, in whole or in part.
Walmart handles over one million purchase transactions per
hour.
Facebook processes more than 250 million picture uploads per
day.
24
Big Data (Slide 2 of 7)
Figure 1.1: The 4 Vs of Big Data
Source: IBM
46. © 2021 Cengage Learning. All Rights Reserved. May not be
scanned, copied or duplicated, or posted to a publicly accessible
website, in whole or in part.
Big Data (Slide 3 of 7)
Volume:
Because data are collected electronically, we are able to collect
more of it.
To be useful, these data must be stored, and this storage has led
to vast quantities of data.
Velocity:
Real-time capture and analysis of data present unique
challenges both in how data are stored and the speed with which
those data can be analyzed for decision making.
© 2021 Cengage Learning. All Rights Reserved. May not be
scanned, copied or duplicated, or posted to a publicly accessible
website, in whole or in part.
Big Data (Slide 4 of 7)
Variety:
More complicated types of data are now available and are
proving to be of great value to businesses.
Text data are collected by monitoring what is being said about a
company’s products or services on social media platforms.
47. Audio data are collected from service calls.
Video data are collected by in-store video cameras and used to
analyze shopping behavior.
Analyzing information generated by these nontraditional
sources is more complicated in part because of the processing
required to transform the data into a numerical form that can be
analyzed.
© 2021 Cengage Learning. All Rights Reserved. May not be
scanned, copied or duplicated, or posted to a publicly accessible
website, in whole or in part.
Big Data (Slide 5 of 7)
Veracity:
Veracity has to do with how much uncertainty is in the data.
Inconsistencies in units of measure and the lack of reliability of
responses in terms of bias also increase the complexity of the
data.
© 2021 Cengage Learning. All Rights Reserved. May not be
scanned, copied or duplicated, or posted to a publicly accessible
website, in whole or in part.
Big Data (Slide 6 of 7)
Represents opportunities.
Presents challenges in terms of data storage and processing,
security, and available analytical talent.
The four Vs have led to new technologies:
48. Hadoop: An open-source programming environment that
supports big data processing through distributed storage and
processing on clusters of computers.
MapReduce: A programming model used within Hadoop that
performs two major steps: the map step and the reduce step.
© 2021 Cengage Learning. All Rights Reserved. May not be
scanned, copied or duplicated, or posted to a publicly accessible
website, in whole or in part.
Big Data (Slide 7 of 7)
Data security, the protection of stored data from destructive
forces or unauthorized users, is of critical importance to
companies.
The complexities of the 4 Vs have increased the demand for
analysts, but a shortage of qualified analysts has made hiring
more challenging.
More companies are searching for data scientists, who know
how to process and analyze massive amounts of data.
The Internet of Things (IoT) is the technology that allows data,
collected from sensors in all types of machines, to be sent over
the Internet to repositories where it can be stored and analyzed.
© 2021 Cengage Learning. All Rights Reserved. May not be
scanned, copied or duplicated, or posted to a publicly accessible
49. website, in whole or in part.
Business Analytics in Practice
Financial Analytics
Human Resource (HR) Analytics
Marketing Analytics
Health Care Analytics
Supply-Chain Analytics
Analytics for Government and Nonprofits
Sports Analytics
Web Analytics
© 2021 Cengage Learning. All Rights Reserved. May not be
scanned, copied or duplicated, or posted to a publicly accessible
website, in whole or in part.
31
Business Analytics in Practice (Slide 1 of 11)
Figure 1.2: The Spectrum of Business Analytics
Source: Adapted from SAS
© 2021 Cengage Learning. All Rights Reserved. May not be
scanned, copied or duplicated, or posted to a publicly accessible
website, in whole or in part.
50. 32
Business Analytics in Practice (Slide 2 of 11)
Predictive and prescriptive analytics are sometimes referred to
as advanced analytics.
Financial Analytics:
Use of predictive models to:
Forecast financial performance.
Assess the risk of investment portfolios and projects.
Construct financial instruments such as derivatives.
Construct optimal portfolios of investments.
Allocate assets.
Create optimal capital budgeting plans.
Simulation is also often used to assess risk in the financial
sector.
© 2021 Cengage Learning. All Rights Reserved. May not be
scanned, copied or duplicated, or posted to a publicly accessible
website, in whole or in part.
33
Business Analytics in Practice (Slide 3 of 11)
Human Resource (HR) Analytics:
New area of application for analytics.
The HR function is charged with ensuring that the organization:
Has the mix of skill sets necessary to meet its needs.
Is hiring the highest-quality talent and providing an
environment that retains it.
51. Achieves its organizational diversity goals.
© 2021 Cengage Learning. All Rights Reserved. May not be
scanned, copied or duplicated, or posted to a publicly accessible
website, in whole or in part.
Example for Human Resource (HR) Analytics:
Google has analyzed substantial data on its own employees to
determine the characteristics of great leaders, to assess factors
that contribute to productivity, and to evaluate potential new
hires.
Google also uses predictive analytics to continually update its
forecast of future employee turnover and retention.
34
Business Analytics in Practice (Slide 4 of 11)
Marketing Analytics:
Marketing is one of the fastest-growing areas for the application
of analytics.
A better understanding of consumer behavior through the use of
scanner data and data generated from social media has led to an
increased interest in marketing analytics.
52. © 2021 Cengage Learning. All Rights Reserved. May not be
scanned, copied or duplicated, or posted to a publicly accessible
website, in whole or in part.
35
Business Analytics in Practice (Slide 5 of 11)
Marketing Analytics (cont.):
A better understanding of consumer behavior through marketing
analytics leads to:
Better use of advertising budgets.
More effective pricing strategies.
Improved forecasting of demand.
Improved product-line management.
Increased customer satisfaction and loyalty.
© 2021 Cengage Learning. All Rights Reserved. May not be
scanned, copied or duplicated, or posted to a publicly accessible
website, in whole or in part.
Example of high-impact marketing analytics:
Automobile manufacturer Chrysler teamed with J.D. Power and
Associates to develop an innovate set of predictive models to
support its pricing decisions for automobiles.
53. These models help Chrysler to better understand the
ramifications of proposed pricing structures (a combination of
manufacturer’s suggested retail price, interest rate offers, and
rebates) and, as a result, to improve its pricing decisions.
The models have generated an estimated annual savings of $500
million.
36
Business Analytics in Practice (Slide 6 of 11)
Health Care Analytics:
Descriptive, predictive, and prescriptive analytics are used to
improve:
Patient, staff, and facility scheduling.
Patient flow.
Purchasing.
Inventory control.
Use of prescriptive analytics for diagnosis and treatment may
prove to be the most important application of analytics in health
care.
© 2021 Cengage Learning. All Rights Reserved. May not be
scanned, copied or duplicated, or posted to a publicly accessible
website, in whole or in part.
Example for use of prescriptive analytics for diagnosis and
treatment:
A group of scientists in Georgia used predictive models and
optimization to develop personalized treatment for diabetes.
54. They developed a predictive model that uses fluid dynamics and
patient monitoring data to establish the relationship between
drug dosage and drug effect at the individual level.
Alleviates the need for more invasive procedures to monitor
drug concentration.
37
Business Analytics in Practice (Slide 7 of 11)
Supply-Chain Analytics:
The core service of companies such as UPS and FedEx is the
efficient delivery of goods, and analytics has long been used to
achieve efficiency.
The optimal sorting of goods, vehicle and staff scheduling, and
vehicle routing are all key to profitability for logistics
companies such as UPS and FedEx.
Companies can benefit from better inventory and processing
control and more efficient supply chains.
© 2021 Cengage Learning. All Rights Reserved. May not be
scanned, copied or duplicated, or posted to a publicly accessible
website, in whole or in part.
Example for supply chain analytics:
ConAgra Foods uses predictive and prescriptive analytics to
better plan capacity utilization by incorporating the inherent
uncertainty in commoditi es pricing.
55. ConAgra realized a 100% return on its investment in analytics
in under three months—an unheard of result for a major
technology investment.
38
Business Analytics in Practice (Slide 8 of 11)
Analytics for Government and Nonprofits:
Analytics for government to:
Drive out inefficiencies.
Increase the effectiveness and accountability of programs.
Analytics for nonprofit agencies to ensure their effectiveness
and accountability to their donors and clients.
© 2021 Cengage Learning. All Rights Reserved. May not be
scanned, copied or duplicated, or posted to a publicly accessible
website, in whole or in part.
Example of analytics for government agencies:
The New York State Department has worked with IBM to use
prescriptive analytics in the development of a more effective
approach to tax collection. The result was an increase in
collections from delinquent payers of $83 million over two
years.
Example of analytics for nonprofit agencies:
Catholic Relief Services (CRS) is the official internati onal
humanitarian agency of the U.S. Catholic community. The CRS
mission is to provide relief for the victims of both natural and
human-made disasters and to help people in need around the
world through its health, educational, and agricultural
56. programs.
CRS uses an analytical spreadsheet model to assist in the
allocation of its annual budget based on the impact that its
various relief efforts and programs will have in different
countries.
39
Business Analytics in Practice (Slide 9 of 11)
Sports Analytics
Professional sports teams use to:
Assess players for the amateur drafts.
Decide how much to offer players in contract negotiations.
Professional motorcycle racing teams use sophisticated
optimization for gearbox design to gain competitive advantage.
Teams use to assist with on-field decisions such as which
pitchers to use in various games of a MLB playoff series.
© 2021 Cengage Learning. All Rights Reserved. May not be
scanned, copied or duplicated, or posted to a publicly accessible
website, in whole or in part.
40
Business Analytics in Practice (Slide 10 of 11)
Sports Analytics (cont.):
The use of analytics for off-the-field business decisions is
increasing rapidly.
Using prescriptive analytics, franchises across several major
sports dynamically adjust ticket prices throughout the season to
57. reflect the relative attractiveness and potential demand for each
game.
© 2021 Cengage Learning. All Rights Reserved. May not be
scanned, copied or duplicated, or posted to a publicly accessible
website, in whole or in part.
41
Business Analytics in Practice (Slide 11 of 11)
Web Analytics:
The analysis of online activity, which includes, but is not
limited to, visits to web sites and social media sites such as
Facebook and LinkedIn.
Leading companies apply descriptive and advanced analytics to
data collected in online experiments to determine the best way
to:
Configure web sites.
Position ads.
Utilize social networks for the promotion of products and
services.
58. © 2021 Cengage Learning. All Rights Reserved. May not be
scanned, copied or duplicated, or posted to a publicly accessible
website, in whole or in part.
Online experimentation involves exposing various subgroups to
different versions of a web site and tracking the results.
Because of the massive pool of Internet users, experiments can
be conducted without risking the disruption of the overall
business of the company.
Such experiments are proving to be invaluable because they
enable the company to use trial-and-error in determining
statistically what makes a difference in their web site traffic and
sales.
42
Legal and Ethical Issues in the Use of Data and Analytics
© 2021 Cengage Learning. All Rights Reserved. May not be
scanned, copied or duplicated, or posted to a publicly acces sible
website, in whole or in part.
43
Legal and Ethical Issues in the Use of Data and Analytics(Slide
1 of 4)
Increased attention has been paid to ethical concerns around
data privacy and the ethical use of models based on data.
Companies have an obligation to protect the data and to not
misuse that data.
Clients and customers have an obligation to understand trade-
59. offs between allowing their data to be collected, and the
benefits they accrue from allowing a company to collect and use
that data.
An agreement must be signed between the customer and the
company.
© 2021 Cengage Learning. All Rights Reserved. May not be
scanned, copied or duplicated, or posted to a publicly accessible
website, in whole or in part.
44
Legal and Ethical Issues in the Use of Data and Analytics(Slide
2 of 4)
One of the strictest privacy laws is the General Data Protection
Regulation.
Went into effect in the European Union in May 2018.
Stipulations:
The request for consent to use an individual’s data must be
easily understood and accessible.
The intended use of data must be specified.
Must be easy to withdraw consent.
The individual has a right to a copy of their data and the right to
demand their data be erased.
© 2021 Cengage Learning. All Rights Reserved. May not be
scanned, copied or duplicated, or posted to a publicly accessible
60. website, in whole or in part.
45
Legal and Ethical Issues in the Use of Data and Analytics(Slide
3 of 4)
Analytics professionals have a responsibility to behave
ethically.
This includes protecting data, being transparent about the data
and how it was collected, and what it does and does not contain.
Analysts must be transparent about the methods used to analyze
the data and any assumptions that have to be made for the
methods used.
Analysts must provide valid conclusions and understandable
recommendations to their clients.
© 2021 Cengage Learning. All Rights Reserved. May not be
scanned, copied or duplicated, or posted to a publicly accessible
website, in whole or in part.
46
Legal and Ethical Issues in the Use of Data and Analytics(Slide
4 of 4)
The American Statistical Association (ASA) and the Institute
for Operations Research and the Management Sciences
(INFORMS) provide ethical guidelines for analysts.
The guidelines state that “Good statistical practice is
fundamentally based on transparent assumptions, reproducible
results, and valid interpretations.”
61. © 2021 Cengage Learning. All Rights Reserved. May not be
scanned, copied or duplicated, or posted to a publicly accessible
website, in whole or in part.
47
End of Chapter 1
© 2021 Cengage Learning. All Rights Reserved. May not be
scanned, copied or duplicated, or posted to a publicly accessible
website, in whole or in part.
A 2 page paper which reflects on the material covered in this
module and how it may be beneficial to your professional
career. You may discuss your previous experience, and what
you hope to learn from this course. Also, identify at least one
discussion post you found interesting, helpful, or beneficial
Topics covered in this Module
· Decision Making
· Business Analytics
· Categorization of Analytical Methods & Models
· Big Data
· Business Analytics in Practice
· Legal & Ethical Issues in the Use of Data and Analytics
· Descriptive Statistics
· Definitions and Goals
62. · Types of Data
· Modifying Data in Excel
· Creating Distributions from Data
· Measures of Location
· Measures of Variability
· Analyzing Distributions
· Measures of Association Between Two Variables
· Data Cleansing
Learning Objectives
By the end of this module, students should be able to:
· Understand the categorization of analytical methods and
models
· Define the Four Vs of Big Data
· Discuss business analytics in practice for multiple industries
· Understand the legal and ethical issues in the use of data and
analytics
· Identify the different types of data
· Create and analyze distributions with data
· Sort and filter data in Excel
· Report measures of variability
· Measure association between two variables
· Cleanse data
Running head: ETHICS
1
ETHICS
2
Ethics
Shakitha Reed
Ethical considerations in development and application of
artificial Intelligences, data management, or technology
When developing artificial intelligence, data management or
63. technology application, ethical considerations are important.
Ethical considerations do not only focus on morally bag or good
things but also revolve around morally problematic issues that
should be addressed. The application of data management,
artificial intelligence and technology are accompanied by
promises of numerous benefits. The designers and developers of
this technology should ensure that the promises are achieved by
promoting high level of productivity and efficiency (Stahl.B.C.,
2021). The moral considerations should also ensure that the
well-being of the people is promoted by allowing them to live
better and promote human flourishing.
The developers of new technology system should ensure that
they uphold privacy dignity and human rights in the application
of the system The systems are profound to impose risks to
privacy and dignity of user. They should be designed in a way
that it protect the identity and personal information of the user
(European Parliamentary Research Service, 2020). Users should
be enlightened on ways to ensure their identity and privacy is
protected when using these technology systems.
The application of new technology should ensure that it
achieves equality in its benefits. It should not benefit one party
over others such as the rich over the poor. They should ensure
that they provide significant and diverse benefits to the entire
society by facilitating greater productivity and efficiency at a
lower cost (European Parliamentary Research Service, 2020).
These technologies should have the ability to tackle numerous
global issues such as conflicts, poverty and diseases among
others so that the lives of countless people are improved.
Therefore, it is important for the developers of AI, data
management and technology to ensure moral consideration.
Moral consideration will help in ensuring that the developed
technology system is effective in promoting the lives of people
without discrimination or violation of human rights.
64. References
European Parliamentary Research Service. (2020). The Ethics of
Artificial Intelligence: Issues and Initiatives. London: European
Parliamentary Research Service.
Stahl.B.C. (2021). Ethical Issues of AI. Artificial Intelligence
for a Better Future , 35-53.