International comparison of_productivity_jari_hyvärinen_pdf
1. International Comparison of Productivity 2013
Jari Hyvärinen
The developed countries are taking new steps to operate in economic
circumstances in which the labour force is decreasing and physical investments are
becoming less competitive. In these countries, the only way to improve economic
growth is to develop mechanisms that improve labour productivity and intangible
capital.
Labour productivity is calculated from terms of 1) value added, 2) value added
deflator, and 3) working hours. We use a methodology that establishes the
productivity level to the year 2007. Cross-sectional comparisons for 2007 are made
by using Eurostat SBS and LCS data (Hyvärinen, 2011). Comparisons for other years
are computed using productivity time series that are obtained from OECD STAN,
Rev. 4. Productivity growth is shown as a productivity time series for 1975–2011.
Comparing Finland to other industrialised countries, we find that productivity
growth in key industrial sectors in Finland has increased more rapidly than in the
OECD benchmark countries on the long run.
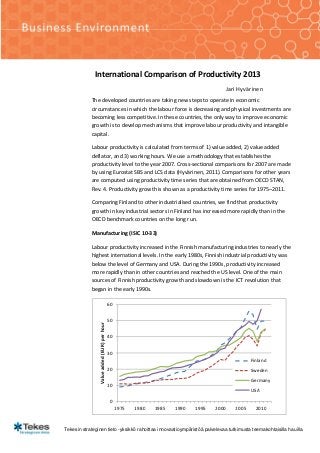
Manufacturing (ISIC 10-33)
Labour productivity increased in the Finnish manufacturing industries to nearly the
highest international levels. In the early 1980s, Finnish industrial productivity was
below the level of Germany and USA. During the 1990s, productivity increased
more rapidly than in other countries and reached the US level. One of the main
sources of Finnish productivity growth and slowdown is the ICT revolution that
began in the early 1990s.
60
50
Value added (EUR) per hour
40
30
Finland
20 Sweden
Germany
10
USA
0
1975 1980 1985 1990 1995 2000 2005 2010
Tekesin strateginen tieto -yksikkö rahoittaa innovaatioympäristöä palvelevaa tutkimusta teemakohtaisilla hauilla.
2. Wood and wood products (ISIC 16 )
The productivity level of the wood and wood product industries in Finland for
2007 was almost parallel with Sweden’s level. Afterwards, development in Finland
has been more moderate than in Sweden. In these comparisons, US productivity
appears to be surprisingly low. Further examination is required to determine why
the productivity level of the US wood industries was exceptionally low in 2007.
50
Finland
40 Sweden
Value added (EUR) per hour
Germany
30 USA
20
10
0
1975 1980 1985 1990 1995 2000 2005 2010
Pulp, paper and paper products (ISIC 17)
In the pulp and paper industries, we used the 2007 level, although there were
radical shifts in productivity levels compared with other studies.2 Finland has a
clear productivity advantage, but in the 2007 comparisons, the Swedish pulp and
paper industries were at the highest level. The pulp and paper industries are highly
capital-intensive industries. However, during the 2000s, the Finnish pulp and paper
industries underwent several stages of reorganisation that increased productivity
growth.
80
Finland
70
Sweden
60
Germany
50 USA
EUR
40
30
20
10
0
1975 1980 1985 1990 1995 2000 2005 2010
Tekes Strategic Intelligence Unit
3. Basic metals (ISIC 24)
In basic metals, the rapid growth and slump of basic metals exported from Finland
has affected rapid changes in value added even if working hours have remained
stable. In other countries, volatility has been less strong than in Finland. Main steel
producers are China, Japan, the US, India, Russia, South Korea and Germany. Their
share is 77 per cent of World production (ETLA 2012).
120
Finland
100
Sweden
80 Germany
USA
60
40
20
0
1975 1980 1985 1990 1995 2000 2005 2010
Fabricated metal products (ISIC 25)
One of the main producers in these industries is Germany, where also productivity
is strong. The main export countries from Finland are Russia, China, Sweden, the
US and Germany (ETLA 2012). The Finnish productivity has been an average while
in productivity rankings Finland is above Sweden and at the same level than the
US. The productivity has remained rather stable during the crisis.
60
Finland
50 Sweden
Germany
40
USA
30
20
10
0
1975 1980 1985 1990 1995 2000 2005 2010
Tekes Strategic Intelligence Unit
4. Electrical Equipment (ISIC 27)
Electric equipment includes electric motors, generators, transformers etc (271),
batteries and accumulators (272), wiring and wiring devices (273), electric lighting
equipment (274), domestic appliances (275) and other electrical equipment (279).
In the 2000s, the productivity growth has been strong in Finland, but productivity
has been at high level in Sweden since the 1970s. In Finland, exports of electrical
equipment has reached 50 per cent share in electrical machinery (ETLA 2012).
80
Finland
70
Sweden
60
Germany
50 USA
EUR
40
30
20
10
0
1975 1980 1985 1990 1995 2000 2005 2010
Machinery and equipment (ISIC 28)
In the US and Swedish machinery and equipment industries, the level of
productivity in 2007 was dramatically lower than in 2004 and in other productivity
comparisons (Kaitila et al.,2008). With regard to productivity growth, the fastest
improvement in productivity was observed in the Finnish industries during the
2000s. The Finnish machinery has succeeded well during the crisis.
50
Finland
40 Sweden
Germany
30 USA
EUR
20
10
0
1975 1980 1985 1990 1995 2000 2005 2010
Tekes Strategic Intelligence Unit
5. Computer, Electronic and Optical products (ISIC 26)
Electrical and optical equipment includes electronic components and boards (261),
computers and peripheral equipment (262), communication equipment (263),
consumer electronics (264), and various optical products (265-268). In these
industrial sectors, many price indices were unavailable or unreliable. Therefore,
we show only the aggregate productivity of computer, electronic and optical
products.
The most productive sector has been the ICT industry in Finland, Sweden and the
US, which has demonstrated record-breaking productivity growth since the ICT
revolution began in the 1990s. Technology improvements in mobility, wired and
wireless telecommunications, communication processes and data recording are
the ICT characteristics that have significantly improved productivity in Finland
(Maliranta, 2004; Maliranta – Rouvinen, 2004). One factor in the rapid increase of
Swedish and the US productivity has been the globalisation process where
assembly has off-shored to the developing countries such as to Asia. However,
value added flows to the home country where high-skill tasks such as headquarter,
R&D, marketing locate.
350
Finland
300
Sweden
250 Germany
USA
200
EUR
150
100
50
0
1975 1980 1985 1990 1995 2000 2005 2010
Sources:
ETLA (2012). Toimialakatsaus, Suhdanne 2012:2.
Hyvärinen, J. (2011). Productivity: An International Comparison, ETLA Discussion Papers
No. 1264.
Kaitila, V. – A. Nevalainen – M. Maliranta – R. Mankinen (2008). Tuottavuuden
mittaaminen – Suomi kansainvälisessä vertailussa, ETLA Discussion Papers No. 1123.
Maliranta, M. – P. Rouvinen (2004). Informational Mobility and Productivity – Finnish
Evidence, ETLA Discussion Papers No. 919.
OECD STAN Database 2013.
Tekes Strategic Intelligence Unit