SlideShare una empresa de Scribd logo
1 de 21
Descargar para leer sin conexión
NIIT Technologies Ltd.
BUY
- 1 of 21 - Wednesday 23
rd
September, 2015
This document is for private circulation, and must be read in conjunction with the disclaimer on the last page.
STOCKPOINTER
Target Price `644 CMP `440 FY17E P/E 9.6x
Index Details NIIT Tech has undertaken several initiatives which, in our opinion,
are expected to put it on the growth trajectory again. The acquisition
of “Incessant Technologies” besides providing traction to revenues
and profitability will help it bolster the fast growing digital services
business and make inroads into new accounts. The significant
reinforcement and changes in front end leadership functions and a
new sales incentive policy are aimed at rewarding improved
performances and we believe, lead to a resurgent work force.
We initiate with a BUY coverage on NIIT Tech Ltd with a Price
Objective of `644 (potential upside of ~47% over a period of 18
months), implying a P/E multiple of 14x on its FY17E EPS. At the
CMP of `440, the stock is trading at 9.6x its EPS for FY17E.
Our optimism stems from the fact that:
 NIIT Tech is looking forward to expanding its presence in the
international markets (revenue share estimated to increase
from 87% in FY15 to 91% in FY17) by acquiring 17 new logos in
various verticals to bolster revenue growth and improve its
margins. International revenues are expected to grow at a
CAGR of 14% to ` 2,734 crores leading to an overall revenue
growth of 12% CAGR to ` 2,996 crores by FY17 driven by:
 Boost to the Travel and Transportation business which
is estimated to grow at a 12% CAGR to `1,195 crores.
 Accentuation of revenues from the BFSI vertical to
`1,058 crores (2 year CAGR of 17%).
 Expansion of business from IMS service line to `578
crores growing at a CAGR of 28%.
 The conscious de-focus from government business in India
should lead to a sharp improvement in operating margins by
380 bps to 18% while DSO days are also set to improve to 80
days from the current 93 days.
Sensex 25,652
Nifty 7,812
BSE 500 10,315
Industry
IT
Consulting
Scrip Details
Mkt Cap (` cr) 2,689
BVPS (`) 222
O/s Shares (Cr) 6.1
Av Vol (Lacs) 0.3
52 Week H/L 539/332
Div Yield (%) 1.8
FVPS (`) 10
Shareholding Pattern
Shareholders %
Promoters 30.9
DIIs 24.0
FIIs 28.1
Public 17.0
Total 100.0
NIIT Tech vs. Sensex
0
20
40
60
80
100
120
140
160
16-Sep-14
16-Oct-14
16-Nov-14
16-Dec-14
16-Jan-15
16-Feb-15
16-Mar-15
16-Apr-15
16-May-15
16-Jun-15
16-Jul-15
16-Aug-15
16-Sep-15
NIIT Tech Sensex
Key Financials (` Cr.)
Y/E Mar
Net
Sales
EBITDA PAT
EPS
(`)
EPS Growth
(%)
RONW
(%)
ROCE
(%)
P/E
(x)
EV/EBITDA
(x)
2014 2305 354 231 38.0 8.5 19.1 31.7 11.6 6.9
2015E 2372 336 114 18.7 -50.8 8.5 26.2 23.5 7.2
2016E 2659 439 203 33.3 78.1 14.3 31.9 13.2 5.6
2017E 2996 540 281 46.0 38.3 17.7 34.9 9.6 4.1
- 2 of 21- Wednesday 23
rd
September, 2015
This document is for private circulation, and must be read in conjunction with the disclaimer on the last page.
 McKinsey expects global spending on digital services to grow
from the current 9% to 36% by FY18. Given NIIT Techs thrust on
this segment and the acquisition of Incessant (51% stake) augurs
well for the company. Besides plugging a vital gap in its service
offering the Incessant acquisition is expected to improve new
client adds and revenue potential through cross selling. Incessant
Technologies revenues (~ $17 Mn in FY15) are estimated to grow
at a robust 20% CAGR over FY15-17. Also, it operates at
significantly high margins of ~25%.
 The company has undertaken a list of new operating initiatives
such as:
 Identifying ‘Must have Accounts’ and growing top accounts
 Reinforcement and changes in front end leadership
positions
 Introduction of new sales incentive policy
These measures are expected improve its efficiencies and reduce
its employee cost / sales by 140bps to 55.1%.
- 3 of 21- Wednesday 23
rd
September, 2015
This document is for private circulation, and must be read in conjunction with the disclaimer on the last page.
Company Background
NIIT Technologies was established as a software services arm of NIIT in 1981. It
demerged in 2004 and there onwards, NIIT Tech has expanded in various
geographies through various verticals and provides a number of IT Based
Services. Its Revenue Breakup is charted below:
Revenue Breakup FY15
Source: Ventura Research
Revenues
`2,372
Crores
America
44%
EMEA
36%
India
13%
Others
7%
ADM
61% SI & PI
7%
BPO
6%
IMS
17%
IP Based
9%
Others
15%
Govt
5%
Transportation
40%
Mfg
7%
BFSI
33%
Service Line Wise
Vertical Wise
Geography Wise
Margins wise Classification
Service Lise Wise Vertical Wise Geography wise
IP Based Transportation USA
IMS BFSI Europe
ADM Manufacturing MEA
SI & PI Others Others
BPO Govt India
Source: NIIT Tech, Ventura Research
High Margins
Low Margins
- 4 of 21- Wednesday 23
rd
September, 2015
This document is for private circulation, and must be read in conjunction with the disclaimer on the last page.
 Key Investment Highlights
 Focus on international operations and scaling down of India government
business to boost revenues and profitability
Revenues of NIIT Tech have grown at a CAGR of 23% from FY11-FY14 led by
growth across all its verticals in various geographies. However, FY15 saw a
paltry growth of 4% due to de-growth in its US BFSI segment led by a slowdown
in two of its clients.
At the end of FY2011, developed markets (US and Europe) accounted for 63%
of the overall revenue (the US and Europe markets had an almost equal share).
However, with the US geography offering better margins, gradually the revenue
mix tilted in favour of the US business with its revenue share increasing from
31% in FY11 to 44% in FY15. Further, reduction of the domestic business has
led to the share of the international business growing from 76% in FY11 to 87%
in FY15.
Revenues to grow at a 2 year CAGR of 12%
0.00
500.00
1000.00
1500.00
2000.00
2500.00
3000.00
3500.00
2011 2012 2013 2014 2015 2016E 2017E
` Crores
Source: NIIT Tech, Ventura Research
- 5 of 21- Wednesday 23
rd
September, 2015
This document is for private circulation, and must be read in conjunction with the disclaimer on the last page.
Post 2008, to de-risk itself from the global melt down NIIT Tech had increased
its exposure to domestic business (primarily government sector). In FY11,
revenues from Indian operations accounted for 24% of the revenue pie, with ~
1/3rd of it coming from the government business. However, marred by delays in
project completion, high DSOs and low margin Purchase for Resale segment
(~2/3rds of Government business) stretched the balance sheet and marred
profitability.
NIIT Tech as part of its strategy consciously focused on de growing the India
business and focusing more on the international opportunity. Going forward, we
expect overall revenues to grow at a 2 year CAGR of 12% to `2,996 crores led
by expansion in international markets and strategic de-growth in its domestic
operations. By FY17, the share of overall revenues from the international
markets is expected to rise by 400 bps to 91% driven by:
International business expected to grow at a 2 year CAGR of 14% and account for 91% of FY17 revenues
31
37 38 42 44 47 48
32
38 39
37 35
36 36
24
12
13
14 13 11 9
13 13 10 7 8 8 7
0%
10%
20%
30%
40%
50%
60%
70%
80%
90%
100%
2011 2012 2013 2014 2015 2016E 2017E
America EMEA India Others
0
500
1000
1500
2000
2500
3000
2011 2012 2013 2014 2015 2016E 2017E
` Crores
Source: NIIT Tech, Ventura Research
Post scaling down of India operations DSO days and margins set to improve
50
55
60
65
70
75
80
85
90
95
100
2011 2012 2013 2014 2015 2016E 2017E
DSO
10.0
11.0
12.0
13.0
14.0
15.0
16.0
17.0
18.0
19.0
20.0
2011 2012 2013 2014 2015 2016E 2017E
EBITDA %
Margins have bottomed
out in 2015.
Source: NIIT Tech, Ventura Research
- 6 of 21- Wednesday 23
rd
September, 2015
This document is for private circulation, and must be read in conjunction with the disclaimer on the last page.
 Boost to the Travel and Transportation vertical
 Accentuation of revenues from BFSI
 Expansion of business in its IMS service line
 Conscious de-growth in government business
 Boost to the Travel and Transportation Vertical:
NIIT Tech strengthened its position in the Travel & Transportation (T&T)
segment with the acquisition of Softech GMBH in FY09. Later it consolidated its
position by another successful acquisition of Proyecta, Spain in FY12.
Revenues from T&T vertical grew at a robust 43% CAGR from FY11-FY13 to
`809 crore backed by large marquee client wins in the international markets. In
FY14 however the segment experienced slow growth on account of a weak
environment in Europe and slowdown of a large account in the US.
Travel and Transportation (T&T) segment currently forms the highest share of
revenues at 40% and among Indian peers it is the second leading player. Going
ahead, we expect revenues from T&T to grow at a 2 year CAGR of 12% to
`1,195 crores by FY17 on the back of:
 10 new client wins in FY15 (with another in the process of finalizing by
Q2FY16).
 Further almost half of revenues from this vertical come from international
airlines. Some consolidations of other airlines with the clients of NIIT
Tech like International Airlines Group could present NIIT Tech an
opportunity to add more business in this space..
T&T Revenues estimated to grow at a 2 yr CAGR of 12% to `1,195 Crs
0
200
400
600
800
1000
1200
1400
2011 2012 2013 2014 2015 2016E 2017E
` Crores
Source: NIIT Tech, Ventura Research
- 7 of 21- Wednesday 23
rd
September, 2015
This document is for private circulation, and must be read in conjunction with the disclaimer on the last page.
 Accentuation of revenues from BFSI vertical:
The BFSI segment accounts for 33% of the revenue share with more than a half
being contributed by the insurance vertical (17%). Within the insurance sub-
segment majority (2/3 rd) of the business is from the US geography (wherein it
facilitates implementation of third party software) with the rest being contributed
by UK (where it operates through its subsidiary NITL formed after acquisition of
Room Solutions).
Although during the period FY11-FY14, the BFSI segment grew at a robust
CAGR of 15%, FY15 witnessed a de-growth in revenues on account of a
slowdown in business from two of its BFSI clients in the US.
We expect the BFSI segment to resume its growth trajectory and scale
revenues to `1,058 crores by FY17 (2 year CAGR of 17%) on account of:
i) Launch of its new product - Advantage+ Suite which:
 Aids in policy administration, exposure management and analytics,
 Single platform for all insurance functions,
 Driving underwriting productivity and profitability for clients.
ii) Foray into the fast growing digital space through acquisition of Incessant
Technologies:
Incessant Technologies, a Hyderabad based company, is engaged in
business process management and IT consulting with focus mainly on the
BFS vertical. NIIT Tech acquired a 51% stake in this company May, 2015.
BFSI Revenues estimated to grow at a 2 yr CAGR of 17% to `1,058 Crs
0
200
400
600
800
1000
1200
2011 2012 2013 2014 2015 2016E 2017E
` Crores
Degrowth 0.1%
Source: NIIT Tech, Ventura Research
- 8 of 21- Wednesday 23
rd
September, 2015
This document is for private circulation, and must be read in conjunction with the disclaimer on the last page.
The major benefits of this merger being:
 Incessant provides digital services (mainly digital integration) majorly in
the BFS business in UK and APAC regions which enables NIIT Tech to
expand its footprint in those geographies.
 It is a relatively new company (~4 yrs old) with a consistent 20% top line
growth to $17 mn in FY15 (which is expected to scale up to $ 24.5 mn
by FY17) and operates at significantly high margins (~25%).
 Opens doors to extensive cross-selling opportunities as Incessant is
scarcely present in the US, and also it brings in 15 new client
relationships.
iii) Acquisition of 5 new BFSI accounts (excluding Incessant) one of which
is a Top 10 Insurance company in the US.
 Expansion of business in its IMS service line:
The Infrastructure Management Services business currently contributes ~17%
to the overall revenues. While the business has a steady state in nature, it
provides the company with non linear growth opportunities through cross selling
of services without incurring a corresponding growth in costs. The IMS business
was a star performing segment growing at a healthy 43% despite overall the
company experiencing a marked slowdown. Moving forward, we expect the
revenues of its IMS business to grow at a CAGR of 28% to `694 crores by FY17
mainly from the manufacturing vertical wherein the company has acquired a
new client.
Incessant’s revenues are expected to grow at a 2 yr CAGR of 20%
0
5
10
15
20
25
30
2014 2015 2016E 2017E
$ Mn
Source: NIIT Tech, Ventura Research
- 9 of 21- Wednesday 23
rd
September, 2015
This document is for private circulation, and must be read in conjunction with the disclaimer on the last page.
 Conscious de-growth of the government business in India:
During the period FY12-14, NIIT Tech’s India business grew robustly from `189
crores to `308 crores (27% CAGR) driven by business procured from
government sponsored projects. Government business formed approximately
50% of the Indian geography. However, marred by delays in project completion,
high DSOs and wafer thin margins of the Purchase for Resale segment (~2/3rds
of Government business), it decided to scale down its operations in the
government vertical considerably.
In FY15 revenues from this segment de-grew by 36% to ` 118 crores. Over the
forecast period FY15-17, we expect the revenues from government to further
decline to `44 crores (2% of the overall revenues).
IMS expected to grow at a 2 year CAGR of 28%, while Manufacturing is expected to grow at 30% CAGR
0
100
200
300
400
500
600
700
800
2012 2013 2014 2015 2016E 2017E
` Crores
0
50
100
150
200
250
300
350
2011 2012 2013 2014 2015 2016E 2017E
` Crores
Source: NIIT Tech, Ventura Research
Government Revenues expected to stand at `44 crores by FY17
0
20
40
60
80
100
120
140
160
180
200
2012 2013 2014 2015 2016E 2017E
` Crores
Source: NIIT Tech, Ventura Research
- 10 of 21- Wednesday 23
rd
September, 2015
This document is for private circulation, and must be read in conjunction with the disclaimer on the last page.
 Stable operations in other verticals:
NIIT Tech’s other verticals include Media, Distribution and GIS Technology. All
of which have healthy clients with a sustainable and stable order inflow.
Its media operations comprise of a JV which was signed with Morris
Communications, Georgia for a deal worth $85 Mn over a period of 5 years in
FY12, wherein NIIT Tech provides integrated IT and BPO services to Morris
Communications. After the period of initial agreement, the business foreseen
from the JV stands at ~$20 Mn per year.
In its services to the manufacturing and distribution vertical, it provides IMS
services to Holcim and for Toyota, its engagement includes setting up
dealership management systems, an association which has lasted for 15 years.
For the GIS business, NIIT Tech has set up a subsidiary in which Esri Inc, USA
has a minority stake of 11%. The subsidiary is a sole distributor of ESRI’s GIS
platform in India and it accounts for ~4% of its overall revenues.
Looking forward to gradual business growth in its other verticals, we expect the
revenues from other verticals to stand at `379 crores by FY17 (2 year CAGR of
3%.)
Revenues from other verticals are estimated to remain flattish
100
150
200
250
300
350
400
2011 2012 2013 2014 2015 2016E 2017E
` Crores
Source: NIIT Tech, Ventura Research
- 11 of 21- Wednesday 23
rd
September, 2015
This document is for private circulation, and must be read in conjunction with the disclaimer on the last page.
 Operating Initiatives to drive efficiency and improve employee metrics:
NIIT has recently undertaken new initiatives as a part of its strategy to improve
operational efficiency, which includes
1) Identifying Must have Accounts and Growing Top Accounts:
Certain must have accounts have been identified while also growing its top
accounts with sticky deals wherein there are miniscule chances of clients
changing their IT partners. This in turn boosts revenue sustainability and
stability.
2) Reinforcement and Changes in Front End Leadership:
Significant changes in leadership in key areas clearly spells out that NIIT Tech
is aggressively chasing growth and augurs well for the company.
3) New Sales Incentive Policy:
The company has designed a new incentive policy for improving efficiency of its
business heads. As per the new policy, the calculation of incentives will be
largely based on incremental business that is garnered from the same client
along with business from new MHAs. This can lead to creation of large
sustainable client accounts with continuous order inflow.
We expect the above initiatives to sustainably increase its Revenues/Billed
Employee while simultaneously lowering the employee cost.
Positions for which New Business Heads Appointed
Leadership Positions Sales and Marketing Positions New Position
Europe Head US BFS Head Digital Head
Global Marketing Head US Insurance head
NITL Head Sales Head - Europe and US (T&T)
Service Design Head Marketing Heads - Europe, US, APAC
Source: NIIT Tech, Ventura Research
- 12 of 21- Wednesday 23
rd
September, 2015
This document is for private circulation, and must be read in conjunction with the disclaimer on the last page.
 Thrust on Digital Services augurs well for future growth
According to McKinsey, Digital services which are estimated to constitute 9% of
overall industry IT spend in CY2013 is expected to jump to 36% of the overall
spend by CY2018. NIIT Tech’s Digital Services span across all service lines
and contributed to 14% of the overall revenues in Q4FY15.
NIIT Tech has identified four functional areas for implementing its digital
services strategy viz
i. Digital experience
ii. cloud
iii. analytics, and
iv. digital integration.
Within these functional segments it has identified focus areas to build service
offering around.
Operating Efficiencies to Sustainably Improve Employee Metrics
2500000
2800000
3100000
3400000
3700000
4000000
2012 2013 2014 2015 2016E 2017E
Revenue/Billed Employee (`)
54.0
54.5
55.0
55.5
56.0
56.5
57.0
2012 2013 2014 2015 2016E 2017E
Employee Cost/Sales %
Source: NIIT Tech, Ventura Research
Digital Strategy to Bolster Growth across all Verticals
Digital Experience Cloud Analytics Digital Integration
Multi-Channel SFDC Digital Foresight
Mobility Azure Business Intelligence
Digital Marketing Infra as a Service Exact + Acumen (NITL)
BA.com Leading Adviser Network Fortune 500 Insurer Large APAC Pipeline
Carey SCCC Bankers Financial Leading Air Transport Provider
Accelerators for Wealth
Management Advisors
Risk Aggregation for
Underwriters
AWS GTMPartnership Digital Foresight
Focus Areas
Marquee Examples
BPM
Middleware
IncessantService Offerings
Digital Commerce
Connected Passenger
Source: NIIT Tech, Ventura Research
- 13 of 21- Wednesday 23
rd
September, 2015
This document is for private circulation, and must be read in conjunction with the disclaimer on the last page.
The acquisition of Incessant will help bolster its service offerings in the digital
integration space which was sorely missing.
 Key Risks
1) Slowdown in global IT Spend:
According to Gartner, global IT Spend is expected to decline in 2015 by 5.5%
to $ 3,507 Bn driven by the strengthening dollar, albeit in constant currency
terms spending is expected to rise by 2.7%. However going forward, the
spending is estimated to increase at a 2 year CAGR of 2.6% to $ 3,692 Bn.
Increase in IT spending in constant currency terms holds the key. Any negative
movement in the IT budgets globally would be a downside risk.
2) Weakening of US $:
With NIIT’s growth story being mainly US geography dominant, USD/INR
remains a key factor to its revenue growth story. A weakening dollar would
mean low rupee convertibility, negatively affecting its revenues.
Global IT spending to grow at a 2 year CAGR of 2.6% to $ 3,692 Bn
3000
3100
3200
3300
3400
3500
3600
3700
3800
CY2012 CY2013 CY2014 CY2015E CY2016E CY2017E
$ Bn
Source: Gartner, Statista, Ventura Research
- 14 of 21- Wednesday 23
rd
September, 2015
This document is for private circulation, and must be read in conjunction with the disclaimer on the last page.
3) Slowdown in world economy:
IMF in its World Economic Outlook, July 2015 has estimated the US and Euro
Zone economies to improve marginally while it expects Middle East and Asian
economies to maintain plateaud growth.
NIIT’s growth story depends on its International business whose share is
estimated to rise to 91% in FY17 from 87% in FY15. US and EMEA’s share is
estimated to rise to 84% in FY17 from 79% in FY15. Hence, any effect of
slowdown or downside in economies where NIIT Tech operates could have a
crippling effect on revenues.
Global GDP trend remains a key monitorable
0.0
1.0
2.0
3.0
4.0
5.0
6.0
7.0
8.0
-1.0
-0.5
0.0
0.5
1.0
1.5
2.0
2.5
3.0
3.5
2014 2015 2016E 2017E
US Euro Area UK MEA (RHS) India (RHS)
%%
Source: IMF, Ventura Research
- 15 of 21- Wednesday 23
rd
September, 2015
This document is for private circulation, and must be read in conjunction with the disclaimer on the last page.
 Financial Performance
In Q1FY16, NIIT Tech reported a 9% Y-o-Y increase in revenues to `641.1
crores. On a Q-o-Q basis, revenues were up by 5%, mainly due to the
acquisition of Incessant. Ex-Incessant revenues were up by 1.5%. BFSI
revenues were up by 15%, while transportation recorded a growth of 1.5%. On
the other hand, manufacturing and government businesses were down by 15%
and 14% respectively. EBITDA grew 4.5% Y-o-Y to 104.2 crores in Q1FY16;
EBITDA margin remained flat Y-o-Y at 16.3%. Incessant had a positive impact
on margins and its acquisition has been EPS accretive.
Key takeaways from financial performance of FY15
The company had provided for some of its receivables and claims to the extent
of `49 crores from its government business in FY15 which is expected to reduce
gradually. Also an exceptional item to the tune `80 crores had to be expensed
out by the company on account of settlement of a dispute with one of its clients,
These have dragged its operating and PAT margins in FY15.
Quarterly Performance (` Crores)
Particulars Q1FY16 Q1FY15 FY15 FY14
Net Sales 641.1 611.2 2372.5 2305.0
Growth % 9.0 2.9
Total Expenditure 536.9 511.5 2036.6 1950.8
EBITDA 104.2 99.7 335.9 354.2
Margin % 16.3 16.3 14.2 15.4
Depreciation 27.6 24.2 91.6 61.9
EBIT (Excl. OI) 76.6 75.5 244.2 292.3
Other Income 7.9 -6.6 17.3 30.2
EBIT 84.5 68.9 261.5 322.5
Margin % 13.2 11.3 11.0 14.0
Finance Costs 1.6 0.9 5.7 4.2
Exceptional Item 0.0 80.0 -80.0 0.0
PBT 82.9 -12.0 175.9 318.4
Margin % 12.9 -2.0 7.4 13.8
Tax Expense 21.9 4.7 54.0 80.2
PAT 61.0 -16.7 121.9 238.2
Margin % 9.5 -2.7 5.1 10.3
Source: NIIT Tech, Ventura Research
- 16 of 21- Wednesday 23
rd
September, 2015
This document is for private circulation, and must be read in conjunction with the disclaimer on the last page.
 Financial Outlook
Over FY15-FY17 we expect the company to clock a 12.3% CAGR in revenues
to `2,996 crores led by growth in its international revenue through its various
business verticals. On a constant currency basis, revenues are expected to
grow by 6.5% and 8% respectively for FY16 and FY17.
This is expected lead to a 2 year CAGR growth of 27% and 58% in its EBITDA
and PAT respectively. We expect the EBITDA and PAT margins to bounce back
to 18.3% (+410 bps) and 9.5% (+470 bps) by FY17.
Revenues expected to grow at a 2 year CAGR of 12.3% to `2,996 crores
0.00
500.00
1000.00
1500.00
2000.00
2500.00
3000.00
3500.00
2011 2012 2013 2014 2015 2016E 2017E
` Crores
Source: NIIT Tech, Ventura Research
- 17 of 21- Wednesday 23
rd
September, 2015
This document is for private circulation, and must be read in conjunction with the disclaimer on the last page.
Improving profitability is expected to improve its RoCE and RoE which had taken
a dip in FY15 due to a muted growth in revenues along with provisions and write
offs. We expect RoCE to and RoE to stand at 35.1% and 17.8% respectively by
FY17 from 26.2% and 8.5% respectively in FY15.
EBITDA and PAT to grow at a 2 year CAGR of 27% and 58% by FY17 on the back of improving margins
0.0
5.0
10.0
15.0
20.0
25.0
0
100
200
300
400
500
600
2011 2012 2013 2014 2015 2016E 2017E
EBITDA EBITDA %
%` Crores
0
2
4
6
8
10
12
14
16
0
50
100
150
200
250
300
2011 2012 2013 2014 2015 2016E 2017E
PAT PAT %
` Crores %
Source: NIIT Tech, Ventura Research
Return ratios to improve on the back of rising profitability
20
22
24
26
28
30
32
34
36
38
40
2011 2012 2013 2014 2015 2016E 2017E
ROCE
%
0
5
10
15
20
25
30
2011 2012 2013 2014 2015 2016E 2017E
ROE
%
Source: NIIT Tech, Ventura Research
- 18 of 21- Wednesday 23
rd
September, 2015
This document is for private circulation, and must be read in conjunction with the disclaimer on the last page.
 Valuation
We initiate coverage on NIIT Tech as a BUY with a Target Price of `644
representing a potential upside of 47% on the CMP of `440 over a period of 18
months. Our target price implies a multiple of 14x over its FY17E EPS.
Peer Comparison
Y/E March
Sales
(` Crs.)
EBITDA
(` Crs.)
PAT
(` Crs.)
EBITDA
Margin (%)
PAT
Margin (%)
ROE (%) P/E (x) P/BV (x)
EV/
EBITDA (x)
NIIT Tech
2014 2305.0 354.2 230.5 15.4 10.0 19.1 11.8 2.1 7.1
2015 2372.5 335.9 114.1 14.2 4.8 8.5 24.0 2.0 7.4
2016E 2659.4 438.9 203.2 16.5 7.6 14.3 13.5 1.8 5.8
2017E 2996.0 539.8 281.0 18.0 9.4 17.7 9.7 1.6 4.2
Comparable IT Players
Mindtree
2014 3031.6 610.2 451.0 20.1 14.9 30.5 22.0 7.2 16.9
2015 3546.1 720.0 532.2 20.3 15.0 28.1 21.2 5.4 15.3
2016E 4354.3 808.0 587.1 18.6 13.5 24.6 19.7 4.5 13.5
2017E 4962.2 969.4 675.1 19.5 13.6 23.6 17.1 3.7 11.3
Zensar Technologies
2014 2335.0 388.4 237.5 16.6 10.2 25.1 16.2 4.1 9.4
2015 2627.7 391.8 264.6 14.9 10.1 22.5 13.4 3.0 9.6
2016E 2998.3 486.7 327.8 16.2 10.9 22.7 11.0 2.6 7.7
2017E 3410.3 530.1 376.0 15.5 11.0 21.1 9.6 2.2 7.1
Top IT Players
TCS
2014 81809.2 25115.4 19325.4 30.7 23.6 34.5 27.3 9.4 18.5
2015 46954.5 10460.9 8652.8 22.3 18.4 22.9 16.7 3.6 12.0
2016E 51286.5 11265.1 9191.1 22.0 17.9 20.9 15.5 3.1 11.0
2017E 56562.3 12492.3 10173.0 22.1 18.0 20.3 14.0 2.7 9.5
Infosys
2014 50133.0 13636.2 10648.0 27.2 21.2 22.9 24.3 5.6 16.2
2015 53319.0 14901.0 12329.0 27.9 23.1 24.7 20.2 4.7 14.6
2016E 60252.3 16641.1 13262.1 27.6 22.0 23.3 19.0 4.3 13.3
2017E 68100.7 19143.0 15197.8 28.1 22.3 24.2 16.6 3.8 11.4
Wipro
2014 43754.9 10046.0 7840.5 23.0 17.9 20.9 18.1 4.1 12.4
2015 1682.1 167.7 133.7 10.0 7.9 28.0 12.5 3.4 11.4
2016E 1887.0 189.0 150.0 10.0 7.9 32.2 9.7 2.9 10.5
2017E 1919.0 221.0 173.0 11.5 9.0 31.8 8.4 2.5 9.1
Source: Ventura Research
- 19 of 21- Wednesday 23
rd
September, 2015
This document is for private circulation, and must be read in conjunction with the disclaimer on the last page.
P/E
0
100
200
300
400
500
600
Mar-05 Mar-07 Mar-09 Mar-11 Mar-13 Mar-15
CMP 5X 8X 11X 14X 17X
`
Source: NIIT Tech, Ventura Research
EV/EBITDA
0
500
1000
1500
2000
2500
3000
3500
4000
Mar-05 Mar-07 Mar-09 Mar-11 Mar-13 Mar-15
EV 2X 4X 6X 8X 10X
` Crores
Source: NIIT Tech, Ventura Research
P/BV
0
100
200
300
400
500
600
700
800
Mar-05 Mar-07 Mar-09 Mar-11 Mar-13 Mar-15
CMP 0.5X 1.25X 2X 2.75X 3.5X
`
Source: NIIT Tech, Ventura Research
- 20 of 21- Wednesday 23
rd
September, 2015
This document is for private circulation, and must be read in conjunction with the disclaimer on the last page.
Financials and Projections
Y/E March, Fig in ` Cr FY 2014 FY 2015 FY 2016e FY 2017e Y/E March, Fig in ` Cr FY 2014 FY 2015 FY 2016e FY 2017e
Profit & Loss Statement Per Share Data (`)
Net Sales 2305.0 2372.5 2659.4 2996.0 EPS 38.0 18.7 33.3 46.0
% Chg. 14.0 2.9 12.1 12.7 Cash EPS 26.6 48.4 37.5 58.7
Total Expenditure 1950.8 2036.6 2220.5 2456.3 DPS 9.02 9.51 10.17 10.88
% Chg. 15.5 4.4 9.0 10.6 Book Value 218 222 244 277
EBITDA 354.2 335.9 438.9 539.8 Capital, Liquidity, Returns Ratio
EBITDA Margin % 15.4 14.2 16.5 18.0 Debt / Equity (x) 0.0 0.0 0.0 0.0
Other Income 30.2 17.3 16.0 15.7 Current Ratio (x) 2.7 2.1 2.4 2.8
Exceptional items 0.0 -80.0 0.0 0.0 ROE (%) 19.1 8.5 14.3 17.7
PBDIT 384.4 273.2 455.0 555.5 ROCE (%) 31.7 26.2 31.9 34.9
Depreciation 61.9 91.6 130.4 123.0 Dividend Yield (%) 2.0 2.2 2.3 2.5
Finance Costs 4.2 5.7 5.3 5.2 Valuation Ratio (x)
PBT 318.4 175.9 319.3 427.3 P/E 11.6 23.5 13.2 9.6
Tax Provisions 80.2 54.0 105.4 134.6 P/BV 2.0 2.0 1.8 1.6
Reported PAT 238.2 121.9 213.9 292.7 EV/Sales 1.1 1.0 0.9 0.7
Minority Interest -7.6 -7.9 -10.7 -11.7 EV/EBIDTA 6.9 7.2 5.6 4.1
PAT 230.5 114.1 203.2 281.0 Efficiency Ratios
PAT Margin (%) 10.0 4.8 7.6 9.4 Inventory Days 0.0 0.0 0.0 0.0
Employee Costs/Sales % 56.1 56.5 55.7 55.1 Debtors Days 89.4 93.2 85.0 80.0
Tax rate (%) 25.2 30.7 33.0 31.5 Creditors Days 63.3 83.5 76.7 69.4
Balance Sheet Cash Flow Statement
Share Capital 63.4 64.0 64.1 64.1 Profit Before Tax 318.38 175.91 319.28 427.34
Reserves & Surplus 1260.5 1293.3 1423.9 1627.2 Depreciation & Amortisation 61.9 91.6 130.4 123.0
Minority Interest 18.90 18.87 29.56 41.27 Working Capital Changes -116.0 125.9 -85.6 -33.9
Other Long Term Liabilities 31.0 33.9 37.0 41.3 Direct Taxes Paid & Others -102.5 -98.0 -135.1 -158.0
Total Loans 5.3 4.9 4.5 4.3 Operating Cash Flow 161.7 295.5 229 358
Total Liabilities 1379.0 1414.9 1559.1 1778.1 Capital Expenditure -149.7 -174.5 -208.2 -69.1
Gross Block 750.8 933.6 1229.6 1294.6 Other Income Received 30.2 17.3 16.0 15.7
Less: Acc. Depreciation 297.5 375.7 506.1 629.1 Others 8 -20 -10 23
Net Block 453.4 557.9 723.5 665.6 Cash Flow from Investing -111.2 -177 -203 -31
Capital Work in Progress 128.6 120.3 32.5 36.6 Inc/(Dec) in Loan Fund -0.3 -0.5 -0.7 -0.4
Long Terms Loans and Advances 24.3 44.3 44.8 36.7 Interest Paid and Others -61.9 -70.2 -78.3 -77.8
Net Current Assets 719.2 623.3 711.1 1000.0 Cash Flow from Financing -62.2 -70.8 -79.1 -78.2
Deferred Tax Assets 22.3 38.6 18.8 12.3 Net Change in Cash -11.7 48.0 -52.7 249.7
Other Non-Current Assets 31.2 30.5 28.5 27.0 Opening Cash Balance 232.9 221.2 269.2 216.5
Total Assets 1379.0 1414.9 1559.1 1778.1 Closing Cash Balance 221.2 269.2 216.5 466.2
- 21 of 21- Wednesday 23
rd
September, 2015
This document is for private circulation, and must be read in conjunction with the disclaimer on the last page.
Disclosures and Disclaimer
Ventura Securities Limited (VSL) is a SEBI registered intermediary offering broking, depository and portfolio management services to clients. VSL is member of
BSE, NSE and MCX-SX. VSL is a depository participant of NSDL. VSL states that no disciplinary action whatsoever has been taken by SEBI against it in last
five years except administrative warning issued in connection with technical and venial lapses observed while inspection of books of accounts and records.
Ventura Commodities Limited, Ventura Guaranty Limited, Ventura Insurance Brokers Limited and Ventura Allied Services Private Limited are associates of
VSL. Research Analyst (RA) involved in the preparation of this research report and VSL disclose that neither RA nor VSL nor its associates (i) have any
financial interest in the company which is the subject matter of this research report (ii) holds ownership of one percent or more in the securities of subject
company (iii) have any material conflict of interest at the time of publication of this research report (iv) have received any compensation from the subject
company in the past twelve months (v) have managed or co-managed public offering of securities for the subject company in past twelve months (vi) have
received any compensation for investment banking merchant banking or brokerage services from the subject company in the past twelve months (vii) have
received any compensation for product or services from the subject company in the past twelve months (viii) have received any compensation or other benefits
from the subject company or third party in connection with the research report. RA involved in the preparation of this research report discloses that he / she
has not served as an officer, director or employee of the subject company. RA involved in the preparation of this research report and VSL discloses that they
have not been engaged in the market making activity for the subject company. Our sales people, dealers, traders and other professionals may provide oral or
written market commentary or trading strategies to our clients that reflect opinions that are contrary to the opinions expressed herein. We may have earlier
issued or may issue in future reports on the companies covered herein with recommendations/ information inconsistent or different those made in this report. In
reviewing this document, you should be aware that any or all of the foregoing, among other things, may give rise to or potential conflicts of interest. We may
rely on information barriers, such as "Chinese Walls" to control the flow of information contained in one or more areas within us, or other areas, units, groups or
affiliates of VSL. This report is for information purposes only and this document/material should not be construed as an offer to sell or the solicitation of an offer
to buy, purchase or subscribe to any securities, and neither this document nor anything contained herein shall form the basis of or be relied upon in connection
with any contract or commitment whatsoever. This document does not solicit any action based on the material contained herein. It is for the general information
of the clients / prospective clients of VSL. VSL will not treat recipients as clients by virtue of their receiving this report. It does not constitute a personal
recommendation or take into account the particular investment objectives, financial situations, or needs of clients / prospective clients. Similarly, this document
does not have regard to the specific investment objectives, financial situation/circumstances and the particular needs of any specific person who may receive
this document. The securities discussed in this report may not be suitable for all investors. The appropriateness of a particular investment or strategy will
depend on an investor's individual circumstances and objectives. Persons who may receive this document should consider and independently evaluate
whether it is suitable for his/ her/their particular circumstances and, if necessary, seek professional/financial advice. And such person shall be responsible for
conducting his/her/their own investigation and analysis of the information contained or referred to in this document and of evaluating the merits and risks
involved in the securities forming the subject matter of this document. The projections and forecasts described in this report were based upon a number of
estimates and assumptions and are inherently subject to significant uncertainties and contingencies. Projections and forecasts are necessarily speculative in
nature, and it can be expected that one or more of the estimates on which the projections and forecasts were based will not materialize or will vary significantly
from actual results, and such variances will likely increase over time. All projections and forecasts described in this report have been prepared solely by the
authors of this report independently of the Company. These projections and forecasts were not prepared with a view toward compliance with published
guidelines or generally accepted accounting principles. No independent accountants have expressed an opinion or any other form of assurance on these
projections or forecasts. You should not regard the inclusion of the projections and forecasts described herein as a representation or warranty by VSL, its
associates, the authors of this report or any other person that these projections or forecasts or their underlying assumptions will be achieved. For these
reasons, you should only consider the projections and forecasts described in this report after carefully evaluating all of the information in this report, including
the assumptions underlying such projections and forecasts. The price and value of the investments referred to in this document/material and the income from
them may go down as well as up, and investors may realize losses on any investments. Past performance is not a guide for future performance. Future returns
are not guaranteed and a loss of original capital may occur. Actual results may differ materially from those set forth in projections. Forward-looking statements
are not predictions and may be subject to change without notice. We do not provide tax advice to our clients, and all investors are strongly advised to consult
regarding any potential investment. VSL, the RA involved in the preparation of this research report and its associates accept no liabilities for any loss or
damage of any kind arising out of the use of this report. This report/document has been prepared by VSL, based upon information available to the public and
sources, believed to be reliable. No representation or warranty, express or implied is made that it is accurate or complete. VSL has reviewed the report and, in
so far as it includes current or historical information, it is believed to be reliable, although its accuracy and completeness cannot be guaranteed. The opinions
expressed in this document/material are subject to change without notice and have no obligation to tell you when opinions or information in this report change.
This report or recommendations or information contained herein do/does not constitute or purport to constitute investment advice in publicly accessible media
and should not be reproduced, transmitted or published by the recipient. The report is for the use and consumption of the recipient only. This publication may
not be distributed to the public used by the public media without the express written consent of VSL. This report or any portion hereof may not be printed, sold
or distributed without the written consent of VSL. This document does not constitute an offer or invitation to subscribe for or purchase or deal in any securities
and neither this document nor anything contained herein shall form the basis of any contract or commitment whatsoever. This document is strictly confidential
and is being furnished to you solely for your information, may not be distributed to the press or other media and may not be reproduced or redistributed to any
other person. The opinions and projections expressed herein are entirely those of the author and are given as part of the normal research activity of VSL and
are given as of this date and are subject to change without notice. Any opinion estimate or projection herein constitutes a view as of the date of this report and
there can be no assurance that future results or events will be consistent with any such opinions, estimate or projection. This document has not been prepared
by or in conjunction with or on behalf of or at the instigation of, or by arrangement with the company or any of its directors or any other person. Information in
this document must not be relied upon as having been authorized or approved by the company or its directors or any other person. Any opinions and
projections contained herein are entirely those of the authors. None of the company or its directors or any other person accepts any liability whatsoever for any
loss arising from any use of this document or its contents or otherwise arising in connection therewith. The information contained herein is not intended for
publication or distribution or circulation in any manner whatsoever and any unauthorized reading, dissemination, distribution or copying of this communication
is prohibited unless otherwise expressly authorized. Please ensure that you have read “Risk Disclosure Document for Capital Market and Derivatives
Segments” as prescribed by Securities and Exchange Board of India before investing in Securities Market.
Ventura Securities Limited
Corporate Office: C-112/116, Bldg No. 1, Kailash Industrial Complex, Park Site, Vikhroli (W), Mumbai – 400079

Más contenido relacionado

La actualidad más candente

Symantec investor presentation february 2017
Symantec investor presentation february 2017Symantec investor presentation february 2017
Symantec investor presentation february 2017InvestorSymantec
 
Asia Pacific First Quarter Investment Report
Asia Pacific First Quarter Investment ReportAsia Pacific First Quarter Investment Report
Asia Pacific First Quarter Investment ReportKMC Savills, Inc.
 
Rockwell Automation - Q3 2016 Presentation
Rockwell Automation - Q3 2016 PresentationRockwell Automation - Q3 2016 Presentation
Rockwell Automation - Q3 2016 Presentationinvestorsrockwell
 
ICAEW/Grant Thornton UK Business Confidence Monitor Q3 2013
ICAEW/Grant Thornton UK Business Confidence Monitor Q3 2013ICAEW/Grant Thornton UK Business Confidence Monitor Q3 2013
ICAEW/Grant Thornton UK Business Confidence Monitor Q3 2013Grant Thornton UK LLP
 
2020 04 pax global investing case_updated
2020 04 pax global investing case_updated2020 04 pax global investing case_updated
2020 04 pax global investing case_updatedGabriel Castro, CFA
 
Investor Presentation for December 2015
Investor Presentation for December 2015Investor Presentation for December 2015
Investor Presentation for December 2015Intact
 
Csod investor deck first quarter
Csod investor deck first quarterCsod investor deck first quarter
Csod investor deck first quarterircornerstone
 
Market Update - Commerce and Industry 2015
Market Update - Commerce and Industry 2015Market Update - Commerce and Industry 2015
Market Update - Commerce and Industry 2015Badenoch & Clark
 
Investor presentation may 2012
Investor presentation may 2012Investor presentation may 2012
Investor presentation may 2012Intact
 
Investor Presentation April 2015
Investor Presentation April 2015Investor Presentation April 2015
Investor Presentation April 2015Intact
 
【SEPTENI HOLDINGS CO.,LTD.】Business Results for 2Q Fiscal Year September 2016
【SEPTENI HOLDINGS CO.,LTD.】Business Results for 2Q Fiscal Year September 2016【SEPTENI HOLDINGS CO.,LTD.】Business Results for 2Q Fiscal Year September 2016
【SEPTENI HOLDINGS CO.,LTD.】Business Results for 2Q Fiscal Year September 2016SEPTENI HOLDINGS CO.,LTD.
 
Belden Investor Day
Belden Investor DayBelden Investor Day
Belden Investor DayBeldenir
 
PAX GLOBAL CC FY 2022 TRANSCRIPT.pdf
PAX GLOBAL CC FY 2022 TRANSCRIPT.pdfPAX GLOBAL CC FY 2022 TRANSCRIPT.pdf
PAX GLOBAL CC FY 2022 TRANSCRIPT.pdfGabriel Castro, CFA
 
Goldman sachs-conference-leave-behind-final
Goldman sachs-conference-leave-behind-finalGoldman sachs-conference-leave-behind-final
Goldman sachs-conference-leave-behind-finalingersollrand2016
 

La actualidad más candente (20)

4Q 2018 EMEA ISG Index™
4Q 2018 EMEA ISG Index™4Q 2018 EMEA ISG Index™
4Q 2018 EMEA ISG Index™
 
Symantec investor presentation february 2017
Symantec investor presentation february 2017Symantec investor presentation february 2017
Symantec investor presentation february 2017
 
Asia Pacific First Quarter Investment Report
Asia Pacific First Quarter Investment ReportAsia Pacific First Quarter Investment Report
Asia Pacific First Quarter Investment Report
 
2Q18 EMEA ISG Index
2Q18 EMEA ISG Index2Q18 EMEA ISG Index
2Q18 EMEA ISG Index
 
It I Te S Sector Report - December 2018
It I Te S Sector Report - December 2018It I Te S Sector Report - December 2018
It I Te S Sector Report - December 2018
 
Rockwell Automation - Q3 2016 Presentation
Rockwell Automation - Q3 2016 PresentationRockwell Automation - Q3 2016 Presentation
Rockwell Automation - Q3 2016 Presentation
 
ICAEW/Grant Thornton UK Business Confidence Monitor Q3 2013
ICAEW/Grant Thornton UK Business Confidence Monitor Q3 2013ICAEW/Grant Thornton UK Business Confidence Monitor Q3 2013
ICAEW/Grant Thornton UK Business Confidence Monitor Q3 2013
 
2020 04 pax global investing case_updated
2020 04 pax global investing case_updated2020 04 pax global investing case_updated
2020 04 pax global investing case_updated
 
Investor Presentation for December 2015
Investor Presentation for December 2015Investor Presentation for December 2015
Investor Presentation for December 2015
 
Csod investor deck first quarter
Csod investor deck first quarterCsod investor deck first quarter
Csod investor deck first quarter
 
Market Update - Commerce and Industry 2015
Market Update - Commerce and Industry 2015Market Update - Commerce and Industry 2015
Market Update - Commerce and Industry 2015
 
Investor presentation may 2012
Investor presentation may 2012Investor presentation may 2012
Investor presentation may 2012
 
IT I Te S Sector Report - November 2018
IT I Te S Sector Report - November 2018IT I Te S Sector Report - November 2018
IT I Te S Sector Report - November 2018
 
Investor Presentation April 2015
Investor Presentation April 2015Investor Presentation April 2015
Investor Presentation April 2015
 
【SEPTENI HOLDINGS CO.,LTD.】Business Results for 2Q Fiscal Year September 2016
【SEPTENI HOLDINGS CO.,LTD.】Business Results for 2Q Fiscal Year September 2016【SEPTENI HOLDINGS CO.,LTD.】Business Results for 2Q Fiscal Year September 2016
【SEPTENI HOLDINGS CO.,LTD.】Business Results for 2Q Fiscal Year September 2016
 
Belden Investor Day
Belden Investor DayBelden Investor Day
Belden Investor Day
 
Advertising M&A Summary 2019
Advertising M&A Summary 2019Advertising M&A Summary 2019
Advertising M&A Summary 2019
 
Pax Global investing case
Pax Global investing casePax Global investing case
Pax Global investing case
 
PAX GLOBAL CC FY 2022 TRANSCRIPT.pdf
PAX GLOBAL CC FY 2022 TRANSCRIPT.pdfPAX GLOBAL CC FY 2022 TRANSCRIPT.pdf
PAX GLOBAL CC FY 2022 TRANSCRIPT.pdf
 
Goldman sachs-conference-leave-behind-final
Goldman sachs-conference-leave-behind-finalGoldman sachs-conference-leave-behind-final
Goldman sachs-conference-leave-behind-final
 

Similar a NIIT Tech Ltd

IT Sector Preview - Q2FY15 - HDFC Sec
IT Sector Preview - Q2FY15 - HDFC SecIT Sector Preview - Q2FY15 - HDFC Sec
IT Sector Preview - Q2FY15 - HDFC SecIndiaNotes.com
 
ir-presentation.pdf
ir-presentation.pdfir-presentation.pdf
ir-presentation.pdfssuserbe345f
 
2019_cib_investor_day_ba56d0e8 (1).pdf
2019_cib_investor_day_ba56d0e8 (1).pdf2019_cib_investor_day_ba56d0e8 (1).pdf
2019_cib_investor_day_ba56d0e8 (1).pdfMrGowhar
 
MindTree: Rupee appreciation drags revenue growth during Q1FY15
MindTree: Rupee appreciation drags revenue growth during Q1FY15MindTree: Rupee appreciation drags revenue growth during Q1FY15
MindTree: Rupee appreciation drags revenue growth during Q1FY15IndiaNotes.com
 
KPIT Technologies: Autonomous roadmap for growth; Retain buy - Prabhudas Lill...
KPIT Technologies: Autonomous roadmap for growth; Retain buy - Prabhudas Lill...KPIT Technologies: Autonomous roadmap for growth; Retain buy - Prabhudas Lill...
KPIT Technologies: Autonomous roadmap for growth; Retain buy - Prabhudas Lill...IndiaNotes.com
 
Stock Market Report For Investors -Sai Proficient
Stock Market Report For Investors -Sai ProficientStock Market Report For Investors -Sai Proficient
Stock Market Report For Investors -Sai Proficientsai proficient research
 
Intuit IR Deck - March 2015
Intuit IR Deck - March 2015Intuit IR Deck - March 2015
Intuit IR Deck - March 2015SYGroup
 
Abs return opportunities ownerhship - em peers
Abs return opportunities   ownerhship - em peersAbs return opportunities   ownerhship - em peers
Abs return opportunities ownerhship - em peersVarun Goenka
 
India Equity Analytics :IT Industry 3QFY14 results review
India Equity Analytics :IT Industry 3QFY14 results reviewIndia Equity Analytics :IT Industry 3QFY14 results review
India Equity Analytics :IT Industry 3QFY14 results reviewNARNOLIA SECURITIES LIMITED
 
Investor presentation-august-2015
Investor presentation-august-2015Investor presentation-august-2015
Investor presentation-august-2015Intact
 
Investment Funds Advisory for Today: Buy Stock of HCL tech due to Healthy Ear...
Investment Funds Advisory for Today: Buy Stock of HCL tech due to Healthy Ear...Investment Funds Advisory for Today: Buy Stock of HCL tech due to Healthy Ear...
Investment Funds Advisory for Today: Buy Stock of HCL tech due to Healthy Ear...NARNOLIA SECURITIES LIMITED
 
Cipla 07092021 1630988705
Cipla 07092021 1630988705Cipla 07092021 1630988705
Cipla 07092021 1630988705robertbrookes6
 
CEE Software Development M&A Report 2019
CEE Software Development M&A Report 2019CEE Software Development M&A Report 2019
CEE Software Development M&A Report 2019Yevgen Sysoyev
 

Similar a NIIT Tech Ltd (20)

IT Sector Preview - Q2FY15 - HDFC Sec
IT Sector Preview - Q2FY15 - HDFC SecIT Sector Preview - Q2FY15 - HDFC Sec
IT Sector Preview - Q2FY15 - HDFC Sec
 
ir-presentation.pdf
ir-presentation.pdfir-presentation.pdf
ir-presentation.pdf
 
TCS Fact Sheet Q1 FY15
TCS Fact Sheet Q1 FY15TCS Fact Sheet Q1 FY15
TCS Fact Sheet Q1 FY15
 
2019_cib_investor_day_ba56d0e8 (1).pdf
2019_cib_investor_day_ba56d0e8 (1).pdf2019_cib_investor_day_ba56d0e8 (1).pdf
2019_cib_investor_day_ba56d0e8 (1).pdf
 
IT Consulting - M&A Summary
IT Consulting - M&A SummaryIT Consulting - M&A Summary
IT Consulting - M&A Summary
 
MindTree: Rupee appreciation drags revenue growth during Q1FY15
MindTree: Rupee appreciation drags revenue growth during Q1FY15MindTree: Rupee appreciation drags revenue growth during Q1FY15
MindTree: Rupee appreciation drags revenue growth during Q1FY15
 
It ITES Sector Report - September 2018
It ITES Sector Report - September 2018It ITES Sector Report - September 2018
It ITES Sector Report - September 2018
 
KPIT Technologies: Autonomous roadmap for growth; Retain buy - Prabhudas Lill...
KPIT Technologies: Autonomous roadmap for growth; Retain buy - Prabhudas Lill...KPIT Technologies: Autonomous roadmap for growth; Retain buy - Prabhudas Lill...
KPIT Technologies: Autonomous roadmap for growth; Retain buy - Prabhudas Lill...
 
Stock Market Report For Investors -Sai Proficient
Stock Market Report For Investors -Sai ProficientStock Market Report For Investors -Sai Proficient
Stock Market Report For Investors -Sai Proficient
 
TCS Fact Sheet Q4 FY14
TCS Fact Sheet Q4 FY14TCS Fact Sheet Q4 FY14
TCS Fact Sheet Q4 FY14
 
Auto Parts - 2019 M&A Summary
Auto Parts - 2019 M&A SummaryAuto Parts - 2019 M&A Summary
Auto Parts - 2019 M&A Summary
 
Intuit IR Deck - March 2015
Intuit IR Deck - March 2015Intuit IR Deck - March 2015
Intuit IR Deck - March 2015
 
Abs return opportunities ownerhship - em peers
Abs return opportunities   ownerhship - em peersAbs return opportunities   ownerhship - em peers
Abs return opportunities ownerhship - em peers
 
India Equity Analytics :IT Industry 3QFY14 results review
India Equity Analytics :IT Industry 3QFY14 results reviewIndia Equity Analytics :IT Industry 3QFY14 results review
India Equity Analytics :IT Industry 3QFY14 results review
 
Investor presentation-august-2015
Investor presentation-august-2015Investor presentation-august-2015
Investor presentation-august-2015
 
Investment Funds Advisory for Today: Buy Stock of HCL tech due to Healthy Ear...
Investment Funds Advisory for Today: Buy Stock of HCL tech due to Healthy Ear...Investment Funds Advisory for Today: Buy Stock of HCL tech due to Healthy Ear...
Investment Funds Advisory for Today: Buy Stock of HCL tech due to Healthy Ear...
 
Cipla 07092021 1630988705
Cipla 07092021 1630988705Cipla 07092021 1630988705
Cipla 07092021 1630988705
 
CEE Software Development M&A Report 2019
CEE Software Development M&A Report 2019CEE Software Development M&A Report 2019
CEE Software Development M&A Report 2019
 
DSP Midcap Fund
DSP Midcap FundDSP Midcap Fund
DSP Midcap Fund
 
DSP Midcap Fund
DSP Midcap FundDSP Midcap Fund
DSP Midcap Fund
 

NIIT Tech Ltd

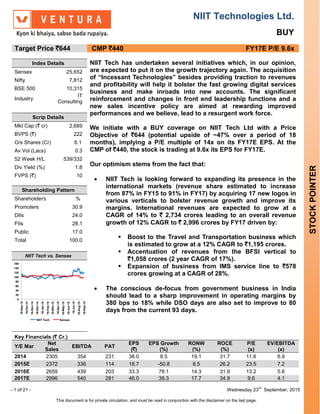
  • 1. NIIT Technologies Ltd. BUY - 1 of 21 - Wednesday 23 rd September, 2015 This document is for private circulation, and must be read in conjunction with the disclaimer on the last page. STOCKPOINTER Target Price `644 CMP `440 FY17E P/E 9.6x Index Details NIIT Tech has undertaken several initiatives which, in our opinion, are expected to put it on the growth trajectory again. The acquisition of “Incessant Technologies” besides providing traction to revenues and profitability will help it bolster the fast growing digital services business and make inroads into new accounts. The significant reinforcement and changes in front end leadership functions and a new sales incentive policy are aimed at rewarding improved performances and we believe, lead to a resurgent work force. We initiate with a BUY coverage on NIIT Tech Ltd with a Price Objective of `644 (potential upside of ~47% over a period of 18 months), implying a P/E multiple of 14x on its FY17E EPS. At the CMP of `440, the stock is trading at 9.6x its EPS for FY17E. Our optimism stems from the fact that:  NIIT Tech is looking forward to expanding its presence in the international markets (revenue share estimated to increase from 87% in FY15 to 91% in FY17) by acquiring 17 new logos in various verticals to bolster revenue growth and improve its margins. International revenues are expected to grow at a CAGR of 14% to ` 2,734 crores leading to an overall revenue growth of 12% CAGR to ` 2,996 crores by FY17 driven by:  Boost to the Travel and Transportation business which is estimated to grow at a 12% CAGR to `1,195 crores.  Accentuation of revenues from the BFSI vertical to `1,058 crores (2 year CAGR of 17%).  Expansion of business from IMS service line to `578 crores growing at a CAGR of 28%.  The conscious de-focus from government business in India should lead to a sharp improvement in operating margins by 380 bps to 18% while DSO days are also set to improve to 80 days from the current 93 days. Sensex 25,652 Nifty 7,812 BSE 500 10,315 Industry IT Consulting Scrip Details Mkt Cap (` cr) 2,689 BVPS (`) 222 O/s Shares (Cr) 6.1 Av Vol (Lacs) 0.3 52 Week H/L 539/332 Div Yield (%) 1.8 FVPS (`) 10 Shareholding Pattern Shareholders % Promoters 30.9 DIIs 24.0 FIIs 28.1 Public 17.0 Total 100.0 NIIT Tech vs. Sensex 0 20 40 60 80 100 120 140 160 16-Sep-14 16-Oct-14 16-Nov-14 16-Dec-14 16-Jan-15 16-Feb-15 16-Mar-15 16-Apr-15 16-May-15 16-Jun-15 16-Jul-15 16-Aug-15 16-Sep-15 NIIT Tech Sensex Key Financials (` Cr.) Y/E Mar Net Sales EBITDA PAT EPS (`) EPS Growth (%) RONW (%) ROCE (%) P/E (x) EV/EBITDA (x) 2014 2305 354 231 38.0 8.5 19.1 31.7 11.6 6.9 2015E 2372 336 114 18.7 -50.8 8.5 26.2 23.5 7.2 2016E 2659 439 203 33.3 78.1 14.3 31.9 13.2 5.6 2017E 2996 540 281 46.0 38.3 17.7 34.9 9.6 4.1
  • 2. - 2 of 21- Wednesday 23 rd September, 2015 This document is for private circulation, and must be read in conjunction with the disclaimer on the last page.  McKinsey expects global spending on digital services to grow from the current 9% to 36% by FY18. Given NIIT Techs thrust on this segment and the acquisition of Incessant (51% stake) augurs well for the company. Besides plugging a vital gap in its service offering the Incessant acquisition is expected to improve new client adds and revenue potential through cross selling. Incessant Technologies revenues (~ $17 Mn in FY15) are estimated to grow at a robust 20% CAGR over FY15-17. Also, it operates at significantly high margins of ~25%.  The company has undertaken a list of new operating initiatives such as:  Identifying ‘Must have Accounts’ and growing top accounts  Reinforcement and changes in front end leadership positions  Introduction of new sales incentive policy These measures are expected improve its efficiencies and reduce its employee cost / sales by 140bps to 55.1%.
  • 3. - 3 of 21- Wednesday 23 rd September, 2015 This document is for private circulation, and must be read in conjunction with the disclaimer on the last page. Company Background NIIT Technologies was established as a software services arm of NIIT in 1981. It demerged in 2004 and there onwards, NIIT Tech has expanded in various geographies through various verticals and provides a number of IT Based Services. Its Revenue Breakup is charted below: Revenue Breakup FY15 Source: Ventura Research Revenues `2,372 Crores America 44% EMEA 36% India 13% Others 7% ADM 61% SI & PI 7% BPO 6% IMS 17% IP Based 9% Others 15% Govt 5% Transportation 40% Mfg 7% BFSI 33% Service Line Wise Vertical Wise Geography Wise Margins wise Classification Service Lise Wise Vertical Wise Geography wise IP Based Transportation USA IMS BFSI Europe ADM Manufacturing MEA SI & PI Others Others BPO Govt India Source: NIIT Tech, Ventura Research High Margins Low Margins
  • 4. - 4 of 21- Wednesday 23 rd September, 2015 This document is for private circulation, and must be read in conjunction with the disclaimer on the last page.  Key Investment Highlights  Focus on international operations and scaling down of India government business to boost revenues and profitability Revenues of NIIT Tech have grown at a CAGR of 23% from FY11-FY14 led by growth across all its verticals in various geographies. However, FY15 saw a paltry growth of 4% due to de-growth in its US BFSI segment led by a slowdown in two of its clients. At the end of FY2011, developed markets (US and Europe) accounted for 63% of the overall revenue (the US and Europe markets had an almost equal share). However, with the US geography offering better margins, gradually the revenue mix tilted in favour of the US business with its revenue share increasing from 31% in FY11 to 44% in FY15. Further, reduction of the domestic business has led to the share of the international business growing from 76% in FY11 to 87% in FY15. Revenues to grow at a 2 year CAGR of 12% 0.00 500.00 1000.00 1500.00 2000.00 2500.00 3000.00 3500.00 2011 2012 2013 2014 2015 2016E 2017E ` Crores Source: NIIT Tech, Ventura Research
  • 5. - 5 of 21- Wednesday 23 rd September, 2015 This document is for private circulation, and must be read in conjunction with the disclaimer on the last page. Post 2008, to de-risk itself from the global melt down NIIT Tech had increased its exposure to domestic business (primarily government sector). In FY11, revenues from Indian operations accounted for 24% of the revenue pie, with ~ 1/3rd of it coming from the government business. However, marred by delays in project completion, high DSOs and low margin Purchase for Resale segment (~2/3rds of Government business) stretched the balance sheet and marred profitability. NIIT Tech as part of its strategy consciously focused on de growing the India business and focusing more on the international opportunity. Going forward, we expect overall revenues to grow at a 2 year CAGR of 12% to `2,996 crores led by expansion in international markets and strategic de-growth in its domestic operations. By FY17, the share of overall revenues from the international markets is expected to rise by 400 bps to 91% driven by: International business expected to grow at a 2 year CAGR of 14% and account for 91% of FY17 revenues 31 37 38 42 44 47 48 32 38 39 37 35 36 36 24 12 13 14 13 11 9 13 13 10 7 8 8 7 0% 10% 20% 30% 40% 50% 60% 70% 80% 90% 100% 2011 2012 2013 2014 2015 2016E 2017E America EMEA India Others 0 500 1000 1500 2000 2500 3000 2011 2012 2013 2014 2015 2016E 2017E ` Crores Source: NIIT Tech, Ventura Research Post scaling down of India operations DSO days and margins set to improve 50 55 60 65 70 75 80 85 90 95 100 2011 2012 2013 2014 2015 2016E 2017E DSO 10.0 11.0 12.0 13.0 14.0 15.0 16.0 17.0 18.0 19.0 20.0 2011 2012 2013 2014 2015 2016E 2017E EBITDA % Margins have bottomed out in 2015. Source: NIIT Tech, Ventura Research
  • 6. - 6 of 21- Wednesday 23 rd September, 2015 This document is for private circulation, and must be read in conjunction with the disclaimer on the last page.  Boost to the Travel and Transportation vertical  Accentuation of revenues from BFSI  Expansion of business in its IMS service line  Conscious de-growth in government business  Boost to the Travel and Transportation Vertical: NIIT Tech strengthened its position in the Travel & Transportation (T&T) segment with the acquisition of Softech GMBH in FY09. Later it consolidated its position by another successful acquisition of Proyecta, Spain in FY12. Revenues from T&T vertical grew at a robust 43% CAGR from FY11-FY13 to `809 crore backed by large marquee client wins in the international markets. In FY14 however the segment experienced slow growth on account of a weak environment in Europe and slowdown of a large account in the US. Travel and Transportation (T&T) segment currently forms the highest share of revenues at 40% and among Indian peers it is the second leading player. Going ahead, we expect revenues from T&T to grow at a 2 year CAGR of 12% to `1,195 crores by FY17 on the back of:  10 new client wins in FY15 (with another in the process of finalizing by Q2FY16).  Further almost half of revenues from this vertical come from international airlines. Some consolidations of other airlines with the clients of NIIT Tech like International Airlines Group could present NIIT Tech an opportunity to add more business in this space.. T&T Revenues estimated to grow at a 2 yr CAGR of 12% to `1,195 Crs 0 200 400 600 800 1000 1200 1400 2011 2012 2013 2014 2015 2016E 2017E ` Crores Source: NIIT Tech, Ventura Research
  • 7. - 7 of 21- Wednesday 23 rd September, 2015 This document is for private circulation, and must be read in conjunction with the disclaimer on the last page.  Accentuation of revenues from BFSI vertical: The BFSI segment accounts for 33% of the revenue share with more than a half being contributed by the insurance vertical (17%). Within the insurance sub- segment majority (2/3 rd) of the business is from the US geography (wherein it facilitates implementation of third party software) with the rest being contributed by UK (where it operates through its subsidiary NITL formed after acquisition of Room Solutions). Although during the period FY11-FY14, the BFSI segment grew at a robust CAGR of 15%, FY15 witnessed a de-growth in revenues on account of a slowdown in business from two of its BFSI clients in the US. We expect the BFSI segment to resume its growth trajectory and scale revenues to `1,058 crores by FY17 (2 year CAGR of 17%) on account of: i) Launch of its new product - Advantage+ Suite which:  Aids in policy administration, exposure management and analytics,  Single platform for all insurance functions,  Driving underwriting productivity and profitability for clients. ii) Foray into the fast growing digital space through acquisition of Incessant Technologies: Incessant Technologies, a Hyderabad based company, is engaged in business process management and IT consulting with focus mainly on the BFS vertical. NIIT Tech acquired a 51% stake in this company May, 2015. BFSI Revenues estimated to grow at a 2 yr CAGR of 17% to `1,058 Crs 0 200 400 600 800 1000 1200 2011 2012 2013 2014 2015 2016E 2017E ` Crores Degrowth 0.1% Source: NIIT Tech, Ventura Research
  • 8. - 8 of 21- Wednesday 23 rd September, 2015 This document is for private circulation, and must be read in conjunction with the disclaimer on the last page. The major benefits of this merger being:  Incessant provides digital services (mainly digital integration) majorly in the BFS business in UK and APAC regions which enables NIIT Tech to expand its footprint in those geographies.  It is a relatively new company (~4 yrs old) with a consistent 20% top line growth to $17 mn in FY15 (which is expected to scale up to $ 24.5 mn by FY17) and operates at significantly high margins (~25%).  Opens doors to extensive cross-selling opportunities as Incessant is scarcely present in the US, and also it brings in 15 new client relationships. iii) Acquisition of 5 new BFSI accounts (excluding Incessant) one of which is a Top 10 Insurance company in the US.  Expansion of business in its IMS service line: The Infrastructure Management Services business currently contributes ~17% to the overall revenues. While the business has a steady state in nature, it provides the company with non linear growth opportunities through cross selling of services without incurring a corresponding growth in costs. The IMS business was a star performing segment growing at a healthy 43% despite overall the company experiencing a marked slowdown. Moving forward, we expect the revenues of its IMS business to grow at a CAGR of 28% to `694 crores by FY17 mainly from the manufacturing vertical wherein the company has acquired a new client. Incessant’s revenues are expected to grow at a 2 yr CAGR of 20% 0 5 10 15 20 25 30 2014 2015 2016E 2017E 2014 2015 2016E 2017E $ Mn Source: NIIT Tech, Ventura Research
  • 9. - 9 of 21- Wednesday 23 rd September, 2015 This document is for private circulation, and must be read in conjunction with the disclaimer on the last page.  Conscious de-growth of the government business in India: During the period FY12-14, NIIT Tech’s India business grew robustly from `189 crores to `308 crores (27% CAGR) driven by business procured from government sponsored projects. Government business formed approximately 50% of the Indian geography. However, marred by delays in project completion, high DSOs and wafer thin margins of the Purchase for Resale segment (~2/3rds of Government business), it decided to scale down its operations in the government vertical considerably. In FY15 revenues from this segment de-grew by 36% to ` 118 crores. Over the forecast period FY15-17, we expect the revenues from government to further decline to `44 crores (2% of the overall revenues). IMS expected to grow at a 2 year CAGR of 28%, while Manufacturing is expected to grow at 30% CAGR 0 100 200 300 400 500 600 700 800 2012 2013 2014 2015 2016E 2017E ` Crores 0 50 100 150 200 250 300 350 2011 2012 2013 2014 2015 2016E 2017E ` Crores Source: NIIT Tech, Ventura Research Government Revenues expected to stand at `44 crores by FY17 0 20 40 60 80 100 120 140 160 180 200 2012 2013 2014 2015 2016E 2017E ` Crores Source: NIIT Tech, Ventura Research
  • 10. - 10 of 21- Wednesday 23 rd September, 2015 This document is for private circulation, and must be read in conjunction with the disclaimer on the last page.  Stable operations in other verticals: NIIT Tech’s other verticals include Media, Distribution and GIS Technology. All of which have healthy clients with a sustainable and stable order inflow. Its media operations comprise of a JV which was signed with Morris Communications, Georgia for a deal worth $85 Mn over a period of 5 years in FY12, wherein NIIT Tech provides integrated IT and BPO services to Morris Communications. After the period of initial agreement, the business foreseen from the JV stands at ~$20 Mn per year. In its services to the manufacturing and distribution vertical, it provides IMS services to Holcim and for Toyota, its engagement includes setting up dealership management systems, an association which has lasted for 15 years. For the GIS business, NIIT Tech has set up a subsidiary in which Esri Inc, USA has a minority stake of 11%. The subsidiary is a sole distributor of ESRI’s GIS platform in India and it accounts for ~4% of its overall revenues. Looking forward to gradual business growth in its other verticals, we expect the revenues from other verticals to stand at `379 crores by FY17 (2 year CAGR of 3%.) Revenues from other verticals are estimated to remain flattish 100 150 200 250 300 350 400 2011 2012 2013 2014 2015 2016E 2017E ` Crores Source: NIIT Tech, Ventura Research
  • 11. - 11 of 21- Wednesday 23 rd September, 2015 This document is for private circulation, and must be read in conjunction with the disclaimer on the last page.  Operating Initiatives to drive efficiency and improve employee metrics: NIIT has recently undertaken new initiatives as a part of its strategy to improve operational efficiency, which includes 1) Identifying Must have Accounts and Growing Top Accounts: Certain must have accounts have been identified while also growing its top accounts with sticky deals wherein there are miniscule chances of clients changing their IT partners. This in turn boosts revenue sustainability and stability. 2) Reinforcement and Changes in Front End Leadership: Significant changes in leadership in key areas clearly spells out that NIIT Tech is aggressively chasing growth and augurs well for the company. 3) New Sales Incentive Policy: The company has designed a new incentive policy for improving efficiency of its business heads. As per the new policy, the calculation of incentives will be largely based on incremental business that is garnered from the same client along with business from new MHAs. This can lead to creation of large sustainable client accounts with continuous order inflow. We expect the above initiatives to sustainably increase its Revenues/Billed Employee while simultaneously lowering the employee cost. Positions for which New Business Heads Appointed Leadership Positions Sales and Marketing Positions New Position Europe Head US BFS Head Digital Head Global Marketing Head US Insurance head NITL Head Sales Head - Europe and US (T&T) Service Design Head Marketing Heads - Europe, US, APAC Source: NIIT Tech, Ventura Research
  • 12. - 12 of 21- Wednesday 23 rd September, 2015 This document is for private circulation, and must be read in conjunction with the disclaimer on the last page.  Thrust on Digital Services augurs well for future growth According to McKinsey, Digital services which are estimated to constitute 9% of overall industry IT spend in CY2013 is expected to jump to 36% of the overall spend by CY2018. NIIT Tech’s Digital Services span across all service lines and contributed to 14% of the overall revenues in Q4FY15. NIIT Tech has identified four functional areas for implementing its digital services strategy viz i. Digital experience ii. cloud iii. analytics, and iv. digital integration. Within these functional segments it has identified focus areas to build service offering around. Operating Efficiencies to Sustainably Improve Employee Metrics 2500000 2800000 3100000 3400000 3700000 4000000 2012 2013 2014 2015 2016E 2017E Revenue/Billed Employee (`) 54.0 54.5 55.0 55.5 56.0 56.5 57.0 2012 2013 2014 2015 2016E 2017E Employee Cost/Sales % Source: NIIT Tech, Ventura Research Digital Strategy to Bolster Growth across all Verticals Digital Experience Cloud Analytics Digital Integration Multi-Channel SFDC Digital Foresight Mobility Azure Business Intelligence Digital Marketing Infra as a Service Exact + Acumen (NITL) BA.com Leading Adviser Network Fortune 500 Insurer Large APAC Pipeline Carey SCCC Bankers Financial Leading Air Transport Provider Accelerators for Wealth Management Advisors Risk Aggregation for Underwriters AWS GTMPartnership Digital Foresight Focus Areas Marquee Examples BPM Middleware IncessantService Offerings Digital Commerce Connected Passenger Source: NIIT Tech, Ventura Research
  • 13. - 13 of 21- Wednesday 23 rd September, 2015 This document is for private circulation, and must be read in conjunction with the disclaimer on the last page. The acquisition of Incessant will help bolster its service offerings in the digital integration space which was sorely missing.  Key Risks 1) Slowdown in global IT Spend: According to Gartner, global IT Spend is expected to decline in 2015 by 5.5% to $ 3,507 Bn driven by the strengthening dollar, albeit in constant currency terms spending is expected to rise by 2.7%. However going forward, the spending is estimated to increase at a 2 year CAGR of 2.6% to $ 3,692 Bn. Increase in IT spending in constant currency terms holds the key. Any negative movement in the IT budgets globally would be a downside risk. 2) Weakening of US $: With NIIT’s growth story being mainly US geography dominant, USD/INR remains a key factor to its revenue growth story. A weakening dollar would mean low rupee convertibility, negatively affecting its revenues. Global IT spending to grow at a 2 year CAGR of 2.6% to $ 3,692 Bn 3000 3100 3200 3300 3400 3500 3600 3700 3800 CY2012 CY2013 CY2014 CY2015E CY2016E CY2017E CY2012 CY2013 CY2014 CY2015E CY2016E CY2017E $ Bn Source: Gartner, Statista, Ventura Research
  • 14. - 14 of 21- Wednesday 23 rd September, 2015 This document is for private circulation, and must be read in conjunction with the disclaimer on the last page. 3) Slowdown in world economy: IMF in its World Economic Outlook, July 2015 has estimated the US and Euro Zone economies to improve marginally while it expects Middle East and Asian economies to maintain plateaud growth. NIIT’s growth story depends on its International business whose share is estimated to rise to 91% in FY17 from 87% in FY15. US and EMEA’s share is estimated to rise to 84% in FY17 from 79% in FY15. Hence, any effect of slowdown or downside in economies where NIIT Tech operates could have a crippling effect on revenues. Global GDP trend remains a key monitorable 0.0 1.0 2.0 3.0 4.0 5.0 6.0 7.0 8.0 -1.0 -0.5 0.0 0.5 1.0 1.5 2.0 2.5 3.0 3.5 2014 2015 2016E 2017E US Euro Area UK MEA (RHS) India (RHS) %% Source: IMF, Ventura Research
  • 15. - 15 of 21- Wednesday 23 rd September, 2015 This document is for private circulation, and must be read in conjunction with the disclaimer on the last page.  Financial Performance In Q1FY16, NIIT Tech reported a 9% Y-o-Y increase in revenues to `641.1 crores. On a Q-o-Q basis, revenues were up by 5%, mainly due to the acquisition of Incessant. Ex-Incessant revenues were up by 1.5%. BFSI revenues were up by 15%, while transportation recorded a growth of 1.5%. On the other hand, manufacturing and government businesses were down by 15% and 14% respectively. EBITDA grew 4.5% Y-o-Y to 104.2 crores in Q1FY16; EBITDA margin remained flat Y-o-Y at 16.3%. Incessant had a positive impact on margins and its acquisition has been EPS accretive. Key takeaways from financial performance of FY15 The company had provided for some of its receivables and claims to the extent of `49 crores from its government business in FY15 which is expected to reduce gradually. Also an exceptional item to the tune `80 crores had to be expensed out by the company on account of settlement of a dispute with one of its clients, These have dragged its operating and PAT margins in FY15. Quarterly Performance (` Crores) Particulars Q1FY16 Q1FY15 FY15 FY14 Net Sales 641.1 611.2 2372.5 2305.0 Growth % 9.0 2.9 Total Expenditure 536.9 511.5 2036.6 1950.8 EBITDA 104.2 99.7 335.9 354.2 Margin % 16.3 16.3 14.2 15.4 Depreciation 27.6 24.2 91.6 61.9 EBIT (Excl. OI) 76.6 75.5 244.2 292.3 Other Income 7.9 -6.6 17.3 30.2 EBIT 84.5 68.9 261.5 322.5 Margin % 13.2 11.3 11.0 14.0 Finance Costs 1.6 0.9 5.7 4.2 Exceptional Item 0.0 80.0 -80.0 0.0 PBT 82.9 -12.0 175.9 318.4 Margin % 12.9 -2.0 7.4 13.8 Tax Expense 21.9 4.7 54.0 80.2 PAT 61.0 -16.7 121.9 238.2 Margin % 9.5 -2.7 5.1 10.3 Source: NIIT Tech, Ventura Research
  • 16. - 16 of 21- Wednesday 23 rd September, 2015 This document is for private circulation, and must be read in conjunction with the disclaimer on the last page.  Financial Outlook Over FY15-FY17 we expect the company to clock a 12.3% CAGR in revenues to `2,996 crores led by growth in its international revenue through its various business verticals. On a constant currency basis, revenues are expected to grow by 6.5% and 8% respectively for FY16 and FY17. This is expected lead to a 2 year CAGR growth of 27% and 58% in its EBITDA and PAT respectively. We expect the EBITDA and PAT margins to bounce back to 18.3% (+410 bps) and 9.5% (+470 bps) by FY17. Revenues expected to grow at a 2 year CAGR of 12.3% to `2,996 crores 0.00 500.00 1000.00 1500.00 2000.00 2500.00 3000.00 3500.00 2011 2012 2013 2014 2015 2016E 2017E ` Crores Source: NIIT Tech, Ventura Research
  • 17. - 17 of 21- Wednesday 23 rd September, 2015 This document is for private circulation, and must be read in conjunction with the disclaimer on the last page. Improving profitability is expected to improve its RoCE and RoE which had taken a dip in FY15 due to a muted growth in revenues along with provisions and write offs. We expect RoCE to and RoE to stand at 35.1% and 17.8% respectively by FY17 from 26.2% and 8.5% respectively in FY15. EBITDA and PAT to grow at a 2 year CAGR of 27% and 58% by FY17 on the back of improving margins 0.0 5.0 10.0 15.0 20.0 25.0 0 100 200 300 400 500 600 2011 2012 2013 2014 2015 2016E 2017E EBITDA EBITDA % %` Crores 0 2 4 6 8 10 12 14 16 0 50 100 150 200 250 300 2011 2012 2013 2014 2015 2016E 2017E PAT PAT % ` Crores % Source: NIIT Tech, Ventura Research Return ratios to improve on the back of rising profitability 20 22 24 26 28 30 32 34 36 38 40 2011 2012 2013 2014 2015 2016E 2017E ROCE % 0 5 10 15 20 25 30 2011 2012 2013 2014 2015 2016E 2017E ROE % Source: NIIT Tech, Ventura Research
  • 18. - 18 of 21- Wednesday 23 rd September, 2015 This document is for private circulation, and must be read in conjunction with the disclaimer on the last page.  Valuation We initiate coverage on NIIT Tech as a BUY with a Target Price of `644 representing a potential upside of 47% on the CMP of `440 over a period of 18 months. Our target price implies a multiple of 14x over its FY17E EPS. Peer Comparison Y/E March Sales (` Crs.) EBITDA (` Crs.) PAT (` Crs.) EBITDA Margin (%) PAT Margin (%) ROE (%) P/E (x) P/BV (x) EV/ EBITDA (x) NIIT Tech 2014 2305.0 354.2 230.5 15.4 10.0 19.1 11.8 2.1 7.1 2015 2372.5 335.9 114.1 14.2 4.8 8.5 24.0 2.0 7.4 2016E 2659.4 438.9 203.2 16.5 7.6 14.3 13.5 1.8 5.8 2017E 2996.0 539.8 281.0 18.0 9.4 17.7 9.7 1.6 4.2 Comparable IT Players Mindtree 2014 3031.6 610.2 451.0 20.1 14.9 30.5 22.0 7.2 16.9 2015 3546.1 720.0 532.2 20.3 15.0 28.1 21.2 5.4 15.3 2016E 4354.3 808.0 587.1 18.6 13.5 24.6 19.7 4.5 13.5 2017E 4962.2 969.4 675.1 19.5 13.6 23.6 17.1 3.7 11.3 Zensar Technologies 2014 2335.0 388.4 237.5 16.6 10.2 25.1 16.2 4.1 9.4 2015 2627.7 391.8 264.6 14.9 10.1 22.5 13.4 3.0 9.6 2016E 2998.3 486.7 327.8 16.2 10.9 22.7 11.0 2.6 7.7 2017E 3410.3 530.1 376.0 15.5 11.0 21.1 9.6 2.2 7.1 Top IT Players TCS 2014 81809.2 25115.4 19325.4 30.7 23.6 34.5 27.3 9.4 18.5 2015 46954.5 10460.9 8652.8 22.3 18.4 22.9 16.7 3.6 12.0 2016E 51286.5 11265.1 9191.1 22.0 17.9 20.9 15.5 3.1 11.0 2017E 56562.3 12492.3 10173.0 22.1 18.0 20.3 14.0 2.7 9.5 Infosys 2014 50133.0 13636.2 10648.0 27.2 21.2 22.9 24.3 5.6 16.2 2015 53319.0 14901.0 12329.0 27.9 23.1 24.7 20.2 4.7 14.6 2016E 60252.3 16641.1 13262.1 27.6 22.0 23.3 19.0 4.3 13.3 2017E 68100.7 19143.0 15197.8 28.1 22.3 24.2 16.6 3.8 11.4 Wipro 2014 43754.9 10046.0 7840.5 23.0 17.9 20.9 18.1 4.1 12.4 2015 1682.1 167.7 133.7 10.0 7.9 28.0 12.5 3.4 11.4 2016E 1887.0 189.0 150.0 10.0 7.9 32.2 9.7 2.9 10.5 2017E 1919.0 221.0 173.0 11.5 9.0 31.8 8.4 2.5 9.1 Source: Ventura Research
  • 19. - 19 of 21- Wednesday 23 rd September, 2015 This document is for private circulation, and must be read in conjunction with the disclaimer on the last page. P/E 0 100 200 300 400 500 600 Mar-05 Mar-07 Mar-09 Mar-11 Mar-13 Mar-15 CMP 5X 8X 11X 14X 17X ` Source: NIIT Tech, Ventura Research EV/EBITDA 0 500 1000 1500 2000 2500 3000 3500 4000 Mar-05 Mar-07 Mar-09 Mar-11 Mar-13 Mar-15 EV 2X 4X 6X 8X 10X ` Crores Source: NIIT Tech, Ventura Research P/BV 0 100 200 300 400 500 600 700 800 Mar-05 Mar-07 Mar-09 Mar-11 Mar-13 Mar-15 CMP 0.5X 1.25X 2X 2.75X 3.5X ` Source: NIIT Tech, Ventura Research
  • 20. - 20 of 21- Wednesday 23 rd September, 2015 This document is for private circulation, and must be read in conjunction with the disclaimer on the last page. Financials and Projections Y/E March, Fig in ` Cr FY 2014 FY 2015 FY 2016e FY 2017e Y/E March, Fig in ` Cr FY 2014 FY 2015 FY 2016e FY 2017e Profit & Loss Statement Per Share Data (`) Net Sales 2305.0 2372.5 2659.4 2996.0 EPS 38.0 18.7 33.3 46.0 % Chg. 14.0 2.9 12.1 12.7 Cash EPS 26.6 48.4 37.5 58.7 Total Expenditure 1950.8 2036.6 2220.5 2456.3 DPS 9.02 9.51 10.17 10.88 % Chg. 15.5 4.4 9.0 10.6 Book Value 218 222 244 277 EBITDA 354.2 335.9 438.9 539.8 Capital, Liquidity, Returns Ratio EBITDA Margin % 15.4 14.2 16.5 18.0 Debt / Equity (x) 0.0 0.0 0.0 0.0 Other Income 30.2 17.3 16.0 15.7 Current Ratio (x) 2.7 2.1 2.4 2.8 Exceptional items 0.0 -80.0 0.0 0.0 ROE (%) 19.1 8.5 14.3 17.7 PBDIT 384.4 273.2 455.0 555.5 ROCE (%) 31.7 26.2 31.9 34.9 Depreciation 61.9 91.6 130.4 123.0 Dividend Yield (%) 2.0 2.2 2.3 2.5 Finance Costs 4.2 5.7 5.3 5.2 Valuation Ratio (x) PBT 318.4 175.9 319.3 427.3 P/E 11.6 23.5 13.2 9.6 Tax Provisions 80.2 54.0 105.4 134.6 P/BV 2.0 2.0 1.8 1.6 Reported PAT 238.2 121.9 213.9 292.7 EV/Sales 1.1 1.0 0.9 0.7 Minority Interest -7.6 -7.9 -10.7 -11.7 EV/EBIDTA 6.9 7.2 5.6 4.1 PAT 230.5 114.1 203.2 281.0 Efficiency Ratios PAT Margin (%) 10.0 4.8 7.6 9.4 Inventory Days 0.0 0.0 0.0 0.0 Employee Costs/Sales % 56.1 56.5 55.7 55.1 Debtors Days 89.4 93.2 85.0 80.0 Tax rate (%) 25.2 30.7 33.0 31.5 Creditors Days 63.3 83.5 76.7 69.4 Balance Sheet Cash Flow Statement Share Capital 63.4 64.0 64.1 64.1 Profit Before Tax 318.38 175.91 319.28 427.34 Reserves & Surplus 1260.5 1293.3 1423.9 1627.2 Depreciation & Amortisation 61.9 91.6 130.4 123.0 Minority Interest 18.90 18.87 29.56 41.27 Working Capital Changes -116.0 125.9 -85.6 -33.9 Other Long Term Liabilities 31.0 33.9 37.0 41.3 Direct Taxes Paid & Others -102.5 -98.0 -135.1 -158.0 Total Loans 5.3 4.9 4.5 4.3 Operating Cash Flow 161.7 295.5 229 358 Total Liabilities 1379.0 1414.9 1559.1 1778.1 Capital Expenditure -149.7 -174.5 -208.2 -69.1 Gross Block 750.8 933.6 1229.6 1294.6 Other Income Received 30.2 17.3 16.0 15.7 Less: Acc. Depreciation 297.5 375.7 506.1 629.1 Others 8 -20 -10 23 Net Block 453.4 557.9 723.5 665.6 Cash Flow from Investing -111.2 -177 -203 -31 Capital Work in Progress 128.6 120.3 32.5 36.6 Inc/(Dec) in Loan Fund -0.3 -0.5 -0.7 -0.4 Long Terms Loans and Advances 24.3 44.3 44.8 36.7 Interest Paid and Others -61.9 -70.2 -78.3 -77.8 Net Current Assets 719.2 623.3 711.1 1000.0 Cash Flow from Financing -62.2 -70.8 -79.1 -78.2 Deferred Tax Assets 22.3 38.6 18.8 12.3 Net Change in Cash -11.7 48.0 -52.7 249.7 Other Non-Current Assets 31.2 30.5 28.5 27.0 Opening Cash Balance 232.9 221.2 269.2 216.5 Total Assets 1379.0 1414.9 1559.1 1778.1 Closing Cash Balance 221.2 269.2 216.5 466.2
  • 21. - 21 of 21- Wednesday 23 rd September, 2015 This document is for private circulation, and must be read in conjunction with the disclaimer on the last page. Disclosures and Disclaimer Ventura Securities Limited (VSL) is a SEBI registered intermediary offering broking, depository and portfolio management services to clients. VSL is member of BSE, NSE and MCX-SX. VSL is a depository participant of NSDL. VSL states that no disciplinary action whatsoever has been taken by SEBI against it in last five years except administrative warning issued in connection with technical and venial lapses observed while inspection of books of accounts and records. Ventura Commodities Limited, Ventura Guaranty Limited, Ventura Insurance Brokers Limited and Ventura Allied Services Private Limited are associates of VSL. Research Analyst (RA) involved in the preparation of this research report and VSL disclose that neither RA nor VSL nor its associates (i) have any financial interest in the company which is the subject matter of this research report (ii) holds ownership of one percent or more in the securities of subject company (iii) have any material conflict of interest at the time of publication of this research report (iv) have received any compensation from the subject company in the past twelve months (v) have managed or co-managed public offering of securities for the subject company in past twelve months (vi) have received any compensation for investment banking merchant banking or brokerage services from the subject company in the past twelve months (vii) have received any compensation for product or services from the subject company in the past twelve months (viii) have received any compensation or other benefits from the subject company or third party in connection with the research report. RA involved in the preparation of this research report discloses that he / she has not served as an officer, director or employee of the subject company. RA involved in the preparation of this research report and VSL discloses that they have not been engaged in the market making activity for the subject company. Our sales people, dealers, traders and other professionals may provide oral or written market commentary or trading strategies to our clients that reflect opinions that are contrary to the opinions expressed herein. We may have earlier issued or may issue in future reports on the companies covered herein with recommendations/ information inconsistent or different those made in this report. In reviewing this document, you should be aware that any or all of the foregoing, among other things, may give rise to or potential conflicts of interest. We may rely on information barriers, such as "Chinese Walls" to control the flow of information contained in one or more areas within us, or other areas, units, groups or affiliates of VSL. This report is for information purposes only and this document/material should not be construed as an offer to sell or the solicitation of an offer to buy, purchase or subscribe to any securities, and neither this document nor anything contained herein shall form the basis of or be relied upon in connection with any contract or commitment whatsoever. This document does not solicit any action based on the material contained herein. It is for the general information of the clients / prospective clients of VSL. VSL will not treat recipients as clients by virtue of their receiving this report. It does not constitute a personal recommendation or take into account the particular investment objectives, financial situations, or needs of clients / prospective clients. Similarly, this document does not have regard to the specific investment objectives, financial situation/circumstances and the particular needs of any specific person who may receive this document. The securities discussed in this report may not be suitable for all investors. The appropriateness of a particular investment or strategy will depend on an investor's individual circumstances and objectives. Persons who may receive this document should consider and independently evaluate whether it is suitable for his/ her/their particular circumstances and, if necessary, seek professional/financial advice. And such person shall be responsible for conducting his/her/their own investigation and analysis of the information contained or referred to in this document and of evaluating the merits and risks involved in the securities forming the subject matter of this document. The projections and forecasts described in this report were based upon a number of estimates and assumptions and are inherently subject to significant uncertainties and contingencies. Projections and forecasts are necessarily speculative in nature, and it can be expected that one or more of the estimates on which the projections and forecasts were based will not materialize or will vary significantly from actual results, and such variances will likely increase over time. All projections and forecasts described in this report have been prepared solely by the authors of this report independently of the Company. These projections and forecasts were not prepared with a view toward compliance with published guidelines or generally accepted accounting principles. No independent accountants have expressed an opinion or any other form of assurance on these projections or forecasts. You should not regard the inclusion of the projections and forecasts described herein as a representation or warranty by VSL, its associates, the authors of this report or any other person that these projections or forecasts or their underlying assumptions will be achieved. For these reasons, you should only consider the projections and forecasts described in this report after carefully evaluating all of the information in this report, including the assumptions underlying such projections and forecasts. The price and value of the investments referred to in this document/material and the income from them may go down as well as up, and investors may realize losses on any investments. Past performance is not a guide for future performance. Future returns are not guaranteed and a loss of original capital may occur. Actual results may differ materially from those set forth in projections. Forward-looking statements are not predictions and may be subject to change without notice. We do not provide tax advice to our clients, and all investors are strongly advised to consult regarding any potential investment. VSL, the RA involved in the preparation of this research report and its associates accept no liabilities for any loss or damage of any kind arising out of the use of this report. This report/document has been prepared by VSL, based upon information available to the public and sources, believed to be reliable. No representation or warranty, express or implied is made that it is accurate or complete. VSL has reviewed the report and, in so far as it includes current or historical information, it is believed to be reliable, although its accuracy and completeness cannot be guaranteed. The opinions expressed in this document/material are subject to change without notice and have no obligation to tell you when opinions or information in this report change. This report or recommendations or information contained herein do/does not constitute or purport to constitute investment advice in publicly accessible media and should not be reproduced, transmitted or published by the recipient. The report is for the use and consumption of the recipient only. This publication may not be distributed to the public used by the public media without the express written consent of VSL. This report or any portion hereof may not be printed, sold or distributed without the written consent of VSL. This document does not constitute an offer or invitation to subscribe for or purchase or deal in any securities and neither this document nor anything contained herein shall form the basis of any contract or commitment whatsoever. This document is strictly confidential and is being furnished to you solely for your information, may not be distributed to the press or other media and may not be reproduced or redistributed to any other person. The opinions and projections expressed herein are entirely those of the author and are given as part of the normal research activity of VSL and are given as of this date and are subject to change without notice. Any opinion estimate or projection herein constitutes a view as of the date of this report and there can be no assurance that future results or events will be consistent with any such opinions, estimate or projection. This document has not been prepared by or in conjunction with or on behalf of or at the instigation of, or by arrangement with the company or any of its directors or any other person. Information in this document must not be relied upon as having been authorized or approved by the company or its directors or any other person. Any opinions and projections contained herein are entirely those of the authors. None of the company or its directors or any other person accepts any liability whatsoever for any loss arising from any use of this document or its contents or otherwise arising in connection therewith. The information contained herein is not intended for publication or distribution or circulation in any manner whatsoever and any unauthorized reading, dissemination, distribution or copying of this communication is prohibited unless otherwise expressly authorized. Please ensure that you have read “Risk Disclosure Document for Capital Market and Derivatives Segments” as prescribed by Securities and Exchange Board of India before investing in Securities Market. Ventura Securities Limited Corporate Office: C-112/116, Bldg No. 1, Kailash Industrial Complex, Park Site, Vikhroli (W), Mumbai – 400079