2. This article is an open access article
distributed under the terms and
conditions of the Creative Commons
Attribution (CC BY) license (https://
creativecommons.org/licenses/by/
4.0/).
sensors
Review
A Systematic Review of Wearable Sensors for Monitoring
Physical Activity
Annica Kristoffersson * and Maria Lindén
School of Innovation, Design and Engineering, Mälardalen
University, Box 883, 721 23 Västerås, Sweden;
[email protected]
* Correspondence: [email protected]
Abstract: This article reviews the use of wearable sensors for
the monitoring of physical activity (PA)
for different purposes, including assessment of gait and balance,
prevention and/or detection of falls,
recognition of various PAs, conduction and assessment of
rehabilitation exercises and monitoring
of neurological disease progression. The article provides in-
depth information on the retrieved
articles and discusses study shortcomings related to
demographic factors, i.e., age, gender, healthy
participants vs patients, and study conditions. It is well known
3. that motion patterns change with age
and the onset of illnesses, and that the risk of falling increases
with age. Yet, studies including older
persons are rare. Gender distribution was not even provided in
several studies, and others included
only, or a majority of, men. Another shortcoming is that none of
the studies were conducted in
real-life conditions. Hence, there is still important work to be
done in order to increase the usefulness
of wearable sensors in these areas. The article highlights flaws
in how studies based on previously
collected datasets report on study samples and the data
collected, which makes the validity and
generalizability of those studies low. Exceptions exist, such as
the promising recently reported open
dataset FallAllD, wherein a longitudinal study with older adults
is ongoing.
Keywords: wearable sensors; sensor systems; gait and balance;
fall detection; physical activity
recognition; rehabilitation; neurological diseases; data sets;
research shortcomings; user demography
1. Introduction
In this article, we review the use of wearable sensors for
monitoring physical activity
(PA). The monitoring of PA has a number of different purposes.
These include: the assess-
ment of gait and balance, prevention and/or detection of falls,
the recognition of various
PAs. PA monitoring is also useful for the conduction and
assessment of rehabilitation
exercises and for the monitoring of neurological disease
progression. The monitoring of
PAs may seem distant from the monitoring of patients with
4. neurological diseases, but
neurological diseases are often characterized by mobility
disturbances and the same types
of wearable sensors can, and are, being used in both areas. The
WHO [1] pinpoints neuro-
logical diseases as being one of the greatest threats to public
health. Common neurological
diseases include dementia, epilepsy, headache disorders,
multiple sclerosis, neuroinfections,
Parkinson’s disease, stroke and traumatic injuries but also
neurological diseases associated
with malnutrition and pain.
Undoubtedly, the development and evaluations of advanced
wearable sensor sys-
tems have the potential to generate algorithms allowing for
personalized diagnoses and
treatment, i.e., precision health. However, for this to be
realized, algorithms need to be
developed based on data that is representative to the expected
users of the wearable sensor
systems. In a previously published systematic review,
Kristoffersson and Lindén (2020a) [2]
discussed a number of issues that are important to consider
when developing and eval-
uating wearable sensor systems to be used in real-life
conditions. These issues include
studies conducted with small samples but also those not taking
demographic factors,
Sensors 2022, 22, 573. https://doi.org/10.3390/s22020573
https://www.mdpi.com/journal/sensors
https://doi.org/10.3390/s22020573
https://creativecommons.org/
https://creativecommons.org/licenses/by/4.0/
5. https://creativecommons.org/licenses/by/4.0/
https://www.mdpi.com/journal/sensors
https://www.mdpi.com
https://orcid.org/0000-0002-4368-4751
https://orcid.org/0000-0003-1940-1747
https://doi.org/10.3390/s22020573
https://www.mdpi.com/journal/sensors
https://www.mdpi.com/article/10.3390/s22020573?type=check_
update&version=2
Sensors 2022, 22, 573 2 of 39
namely age, gender and healthy participants vs patients
sufficiently into account. Here, we
highlight those factors that are within the scope of this review.
Starting with gait, 35% of
the non-institutional adults were reported to have an abnormal
gait in [3]. Further, age, fall
history, mobility impairments, sleep disturbance and
neurological disorders are all factors
affecting fall risk [4]. Chronic conditions, which become more
common in aging persons,
affect PA levels, but also activities such as raising from a chair
can become demanding [3].
Kristoffersson and Lindén (2020a) [2] write that “the whole
motion pattern changes with
age and the onset of illnesses related to the human locomotor
system” (p. 15). This issue is
also discussed in [4] which points out that existing systems
have mainly been tested under
controlled conditions in laboratory environments and that future
work must focus on the
conduction of longitudinal studies in real-life conditions on
samples including frequent
fallers, aging adults and those with neurological disorders [4].
6. There are also gender differences related to the scope of this
article. For example,
osteoporosis is more common among women but under-
diagnosed among men. The
characteristics of osteoporosis are decreased bone mass density
and disrupted normal
trabecular architecture reducing bone strength [5]. While
increasing the risk of fractures
after a fall, symptoms may remain unnoticed until a fracture has
already occurred [6]. Not
only that, but, changes in bone mass density and bone strength
are factors increasing the
fall risk among patients with osteoporosis. The fear of falling,
particularly among women,
is associated with more falls [7]. Confidence in balance is also
reported as being related
to balance and mobility among older women [8]. Another illness
associated with falls is
thoracic kyphosis, an abnormal convex curvature of the spine at
chest height. The illness is
more common among older women than men due to losses in
estrogen levels [9]. Women
with thoracic kyphosis were found to be more likely to have had
a recent fall in [7].
Evidently, healthy participants and patients differ in many
aspects. Therefore, the
inclusion of patients in evaluations of wearable systems is a
necessity for increasing the
validity of these systems. In addition, studies must be conducted
with sufficiently large
samples for achieving generalizable results.
The remainder of this article is organized as follows. Section 2
provides a summarized
7. description of the systematic method used for selecting articles
from the two literature
searches. Section 3 reports on terminology aimed to facilitate
the reading of this article.
Thereafter, Section 4 reports on all articles relating to fall
prevention. This is a complex
issue, therefore the section includes articles on gait and balance
(Section 4.1), fall detection
(Section 4.2) and physical activity recognition (Section 4.3).
Section 5 reports on rehabil-
itation articles and Section 6 on neurological diseases articles.
Section 7 reports on the
included articles not fitting directly into any of the
aforementioned sections. A considerable
number of notes are deliberately used within Sections 4–7.
There are multiple reasons for
this; to facilitate the reading of this article and the
identification of suitable methods that are
already being used in different contexts. Section 8 provides a
discussion and concluding
remarks on the material analyzed in this article.
2. Methodology
Previously, Kristoffersson and Lindén (2020a) [2] per formed
and published a sys-
tematic review on the use of wearable body sensors for health
monitoring. The original
article, which covered a large field of health monitoring,
provided a qualitative synthesis of
sociodemographic and research-methodological aspects of 73
articles. These articles were
retrieved during a literature search conducted in April 2019.
The search was repeated on
6 August 2020 and resulted in the retrieval of 31 additional
articles fulfilling the original
8. inclusion criteria. Broadly speaking, these articles can be
divided into two areas: one being
the monitoring and prevention of noncommunicable diseases (45
articles), and one being
the monitoring of physical activity and neurological diseases
(54 articles). The present
systematic review focuses solely on the articles related to the
monitoring of physical activity
and neurological diseases and provides a deep analysis of these
articles.
Sensors 2022, 22, 573 3 of 39
Following the requirements of MDPI Sensors, the literature
searches were systematic
and followed the PRISMA guidelines [10]. Search phrases were
selected based on the main
research question “How are wearable sensors used for health
monitoring?” Seven databases
were used: Web of Science Core Collection, MEDLINE, Scopus,
ScienceDirect, Academic
Search Elite, ACM Digital Library and IEEE Xplore. Web of
Science Core Collection itself
included six indices: SCI-EXPANDED, SSCI, A&HCI, CPCI-S,
SPCI-SSH and ESCI. The
search phrases varied slightly between databases but the same
search phrases were used,
both in April 2019 and August 2020. No time limit for the
publications were set in the
April 2019 search, the August 2020 search was limited to
publications from January 2019
to August 2020. An overview of search phrases, hits, the ar ticle
selection process and
distribution of articles is provided in Kristoffersson and Lindén
9. (2020b) [11], which focuses
on the use of wearable sensors for monitoring and preventing
noncommunicable diseases.
2.1. Selection of Articles for This Review
This article presents more in-depth information on a subset of
the original 104 articles.
Narrowing down the scope of the review to articles on the use
of wearable sensors for
monitoring physical activity and neurological diseases, articles
falling into categories not
relating to physical activity monitoring were out of scope. A
few articles included in the
article category “Additional” in [2] were excluded in this article
as it does not report on
studies already conducted but only studies to come.
2.2. Articles Included in This Review
In this article, we have divided the articles into six article
categories: gait and balance
(6 articles), fall detection (10), physical activity recognition
(12), rehabilitation (10), neuro-
logical diseases (9), and additional (7). The category “gait and
fall” used in [2] was divided
into two separate categories: “gait and balance” and “fall
detection”. Further, a few articles
in [2] were re-categorized in this article. In total, this review
includes 54 articles.
The 54 articles were published between 2010 and 2020. The
distribution per year was
the following: 2010 (1 article), 2011 (1), 2012 (5), 2013 (2),
2014 (2), 2015 (6), 2016 (4), 2017
(6), 2018 (8), 2019 (14) and 5 articles were published and
10. indexed prior to 6 August 2020.
Five articles [12–16] were based on data from ≥1 previously
published datasets [17–26].
These five articles [12–16] were published in 2017 or later and
were found to report on the
datasets’ demographics and sensors/activities to varying
degrees. We therefore report on
these articles within Sections 4–7. Appendix A provides
information provided in articles
based on datasets [12–16] in Table A1 and the original datasets
[17–26] in Table A2.
In addition, we have conducted follow up searches if the
included articles reported
on were ongoing or were planned studies. These searches
resulted in an additional four
included articles. Three of them, which are discussed in Section
4.2, were published during
2019–2021. Interestingly, one of them [27] reports on a new
dataset that is also included in
Table A2 in Appendix A. Another article, from 2014, is
discussed in Section 5.
3. Abbreviations and Terminology
To facilitate the reading, this section introduces abbreviations
and terminology com-
monly used within this article. The majority of works use
sensors measuring PA, i.e.,
inertial measurement units (IMUs). For readability, we use the
notations accelerometer,
6D IMU and 9D IMU in the remainder of this paper. The
notation 6D IMU is used for
sensors including a 3D accelerometer and a 3D gyroscope. The
notation 9D IMU is used for
sensors that also include a 3D magnetometer. A few works use
11. sensors measuring vital
signs, such as heart rate (HR), peripheral oxygen saturation
(SpO2) and respiration rate
(RR). Other sensors included are electrocardiography (ECG),
electrodermal activity (EDA),
electromyography (EMG), energy expenditure (EE), finger
tapping, inter-beat interval,
photoplethosmography (PPG), pressure, skin temperature (ST)
and surface EMG (sEMG).
A few works report on the use of motion capture systems such
as Vicon1 and Microsoft
Kinect [28] for validation.
Sensors 2022, 22, 573 4 of 39
Several common tests for assessing gait and balance are used
within the included
articles. These include the: sit-to-stand (S2S) test, six-minute
walk test (6MWT), 30-s chair
stand (30SCS) test, and the Timed Up and Go (TUG) test. A
number of works adopt
machine learning algorithms, these include: artificial neural
network (ANN), bagged tree,
convolutional neural network (CNN), decision tree (DT),
dynamic time warping (DTW),
hidden Markov model (HMM), k-nearest neighbors (kNN),
linear discriminate analysis
(LDA), naïve Bayes (NB), nearest neighbor with DTW (NN-
DTW), random forest (RF),
recurrent convolutional neural network (RCNN), support vector
machine (SVM), support
vector machine recursive feature extraction (SVM-RFE),
support vector regression (SVR),
time kNN, weighted-SVM (W-SVM) and wireless kNN.
12. 4. Fall Prevention
Falls have been pointed out as the second leading cause of
accidental or unintentional
injury deaths worldwide by the WHO [29] who reports an
estimated 646,000 fatal falls
per year. Only traffic incidents result in more deaths by
unintentional injury. The death
rate after a fall is highest among adults aged ≥60. Studying the
number of falls leading to
death, adults aged ≥65 suffer the greatest number of falls. The
majority of the non-fatal
37.3 million yearly falls require medical attention. Together,
they are responsible for a loss
of more than 17 million disability-adjusted life years (DALYs).
Needless to say, the financial
costs resulting from fall-related injuries are high. It is reported
that the average hospital
cost for a fall injury exceeds $30,000 [4]. Preventing falls is
important not only from an
economical perspective but also for the well-being of
individuals. Being afraid of falling is
associated with the avoidance of activities in daily living
(ADLs), a reduction in performed
PAs, depression, the perception of a lower quality of life and
falls [30]. Rajagopalan et al. [4]
reviewed the state-of-the-art (SoA) in fall detection and
prediction systems and found that
existing systems focus mainly on detecting falls. There is a need
for monitoring systems
that can reduce the number of falls and improve quality of life
and safety for those who
have fallen or are afraid of falling. Fall prediction and
prevention systems are important [4].
We argue that reliable fall prediction methods are necessary if
13. we are to prevent falls.
The WHO [29] outlines different measures for identifying and
reducing the risk of
falling, these include: screening for fall risk within living
environments, clinical interven-
tions (e.g., medication reviews, low blood pressure treatment,
recommendations on vitamin
intake, and correction of visual impairment), home assessment
and modification to reduce
risk, the prescription of assistive devices addressing physical
and/or sensory impairments,
muscle and balance training, etc.
Predicting falls is complex. The motion patterns, i.e., gait and
balance, changes with
age and the onset of illnesses affecting human locomotion.
Distinguishing near-fall events
and fall events require the ability to discriminate between ADLs
and fall-related events, i.e.,
a wearable sensor system should assist in preventing falls from
happening. At the same
time, the system should not issue alarms when the user is
carrying out normal ADLs. In the
remainder of this section, we first present articles related to gait
and balance in Section 4.1.
Thereafter, we present articles related to fall detection and near-
fall detection in Section 4.2
and physical activity recognition in Section 4.3.
4.1. Gait and Balance
Six works use wearable sensors for assessing gait and balance.
Gait is at focus in [31–33]
while [34,35] focus on balance. TUG is known to predict older
adult’s ability to walk
14. independently and [36] presents work on a mobile real -time
TUG test for home use. Table 1
shows that the number of older participants, i.e., adults being
≥65 years, in the included
studies is low. Most studies have been conducted with both
male and female participants.
All studies were conducted with healthy participants, i.e., not
with patients. One work [35]
provides little information on demographics. Both young and
old adults participated
in two of the gait studies [32,33], however only [33] compares
the two groups. Young
participants are used in [31,34,36]. Three studies [34–36] have
been conducted with less than
Sensors 2022, 22, 573 5 of 39
10 participants and all studies are observational. As shown in
Table 2, there is no consistency
in the sensor types used, number of sensors, sensor locations or
parameters assessed.
Table 1. Participant demographics for studies on gait and
balance. - = no information.
Ref. Research Design No. of Participants Age Group Age
Statistics Male/Female Patient/Healthy
[31] observational 34 - 28.22 ± 12.77 21 /13 0/34
[32] observational 24 (12/12) 20–40 32.5 ± 4.8 7/5 0/12
65.0 ± 8.8 5/7 0/12
[33] observational 56 (28/28) - 24.6 ± 2.7 14/14 0/28
15. >55 66.1 ± 5.0 18/10 0/28
[34] observational 2 28 and 24 - 1/1 0 /2
[35] observational 3 40–70 - - -
[36] observational 5–6 (1/5) 27 - 1/0 -
21–36 27 4/1 -
Table 2. Study characteristics for studies on gait and balance.
Ref. Sensor and Amount Sensor Location Aim
[31]
1 accelerometer, 1 force-place
instrumented treadmill for validation
on the ear
validating the use of an ear-worn
accelerometer for monitoring gait
[32]
1 accelerometer, 1 GaitRite
instrumented walkway for validation
on the lumbar vertebrae (L5)
validate the use of an accelerometer
worn on the lower back for monitoring
gait
[33] 4 6D IMUs on the ankles and wrists
assess and compare younger and older
adults’ gait
[34]
1 6D IMU, 1 Qualisys motion capture
system for validation
16. on the back at waist estimate state of balance
[35] 1 accelerometer between the lower shoulder blades
improving balance through feedback
when center of mass is shifted
[36] 5 9D IMUs
on the foot, thigh, two shins, torso
side
mobile TUG test
Starting with the works focusing on gait, references [31–33]
present three different
approaches. Aiming at validating the use of an ear-worn
accelerometer for gait monitoring,
Atallah et al. (2012) [31] asked 34 participants to walk on a
force-plate instrumented
treadmill at seven different speeds while wearing an
accelerometer behind the ear. The
features extracted per speed and participant were the zero-
crossing, which indicates new
gait cycles per axis, the maximal amplitude per stride for each
acceleration axis and all
possible combinations of axes. Then, multiple linear regression
was conducted for assessing
the relationship between the maximal amplitude features for all
speeds and participants.
For comparison, a number of normalized gait parameters
derived from the treadmill were
used: maximal force, weight-acceptance peak force and impulse.
Regarding maximal force,
the highest R2 values and lowest estimate of error variance
values were obtained for a
combination of the VT/AP axes, and for a combination of the
VT/AP/ML axes where VT is
17. the vertical axis, AP is the anterior–posterior axis and ML is the
medio-lateral axis (the axes
are depicted in Figure 1). Regarding weight-acceptance peak
force, the highest R2 values
were obtained for the same combinations of axes, i.e., the
VT/AP and VT/AP/ML axes,
whereas the derived R2 values for impulse were lower.
Comparing gait cycle parameters
predicted by the treadmill and zero-crossings, the errors were
higher for the AP and VT
axes at lower speeds. Atallah et al. [31] discuss that these
speeds may allow for more
sway and head movement. The gait cycle parameters derived
from accelerometer data
were close to the values derived from the treadmill, particularly
for the ML axis, with a
mean difference of 0.02 s for data within the first standard
deviation. It is concluded that
Sensors 2022, 22, 573 6 of 39
the development of regression models using the methodology
could provide real-time
force-loading features at different speeds.
Figure 1. Axes of rotation and anatomical planes. The frontal
plane (coronal plane) is dividing the
body into anterior and posterior sections, the sagittal plane is
dividing the body into left and right
sections and the transverse (horizontal) plane is dividing the
body into upper and lower sections.
Godfrey et al. (2014) [32] assess the validity and reliability of
using an accelerometer
18. on the lumbar vertebrae (L5) to assess gait. An equal portion of
12 younger and 12 older
adults performed two tasks during which they walked five laps
along a 25-m oval route at
a normal or fast speed. The participants rested for 1 min
between the two walking tasks.
Additional data was collected using a 7-m-long GaitRite
instrumented walkway located
along one of the oval’s long-sides (gait characteristics) and a
video camera (step counting).
Information on step and stride times was estimated based on the
extracted initial and final
contacts from the accelerometer data collected during laps 2–4
for each speed, according to
the method in [37], which is a modification of the method in
[38]. Step length was estimated
according to the method in [39], after which step velocity was
calculated. To compare the
accelerometer data with the GaitRite data, only the data
segments collected when walking
along the GaitRite were extracted. All gait parameters were
validated with the younger
group. For the older group, similar validity values were
achieved for step time and stride
times. The estimated step velocity was less accurate for the
older group but acceptable
according to [40]. Future work on replicating the full gait model
[41] and conducting studies with
healthy older adults is reported but we have not found such
work.
Zhong et al. (2019) [33] explored differences in gait patterns
between 28 healthy
younger and 28 older adults. The 56 participants wore four
bracelets equipped with 9D
IMUs on their ankles and wrists while walking ten times along a
19. 14-m-long corridor at
three self-selected paces: slow, normal and fast. Tape indicated
the start and end points and
only the middle 10 m for the third and fifth walking trial at each
walking pace were used for
assessing gait patterns. Gait speed, stride frequency, average
stride length, stride regularity,
stride time variability and magnitude of acceleration were
extracted. In total, the analysis
included 336 trials (56 people performing two walking trials at
three different speeds). The
magnitude of the acceleration, i.e., the root-mean-square (RMS)
acceleration was found to
increase significantly when the walking pace increased. The
RMS accelerations along the
AP and ML directions (see Figure 1) were significantly lower
for the older group. There
was no significant difference between the groups when
comparing stride regularity and
variability. Technology acceptance was assessed using a 15-
item questionnaire. There were
significant differences (ρ < 0.05) between the older and younger
adults’ responses to seven
items. The older adults found the “ability to learn how to use
the bracelet” and “family
support” more important. They also found items relating to the
risk of harming the body,
Sensors 2022, 22, 573 7 of 39
measurement accuracy, costs and protecting the privacy of
personal data less important
than the younger adults. In addition, the older adults were less
concerned with the bracelet
20. being inconspicuous, i.e., not clearly visible or attracting
attention. The evaluation resulted
in a number of possible enhancements: provision of feedback on
the bracelet display, access
to a gait analysis report and the possibility of sharing data with
family members.
Moving on to the works focusing on balance, Paiman et al.
(2016) [34] reasoned that
knowledge of a user’s current state of balance is necessary to
actively prevent falls and
to mitigate their consequences. In their work, Paiman et al. [34]
proposed to augment
collected data with an online observer containing a combination
of validated concepts for
modelling human gait. The observer’s performance was
evaluated by two young people
who walked on a treadmill for ≥10 s while wearing a 6D IMU
on the back of the waist
in four different ways: (1) normal walking at low speed and free
arms, (2) normal-speed
walking, (3) high-speed walking and (4) normal-speed walking
with arms folded at chest
height. A motion capture system with five 3D cameras and
reflective markers attached
to the body from Qualisys was used for tracking movements.
Markers were attached
to the center of mass (CoM), shoulder joints, hip joints and feet.
The participants had
difficulties to stand still while the system recorded initial
angles. This caused the angle
to vary approx. 3◦ and the calculated error was fed into the
observer. Paiman et al. [34]
write that the observer could estimate human walking if the
system is properly tuned and
if instances of foot contact can be estimated correctly. Further,
21. with the virtual pendulum
model combined with the virtual pivot concept, the extrapolated
CoM and an additive
unscented Kalman filter could be used in predictions of human
balance. However, the study
was performed with only two young participants. In another
work, Tino et al. (2011) [35] focus
on improving body balance by providing vibrotactile feedback.
The system contains an
accelerometer and vibrating gloves. The accelerometer is worn
between the lower shoulder
blades and feedback is provided if the CoM has shifted.
Insufficient information is reported on
the evaluation.
Aiming towards a stroke rehabilitation system for home use,
Williams et al. (2015) [36]
present work on a mobile version of the TUG test, in which a
person sits on a chair, stands
up, walks 3 m, turns around, returns and sits down again. The
mobile TUG test [36] consists
of an app and five IMUs. A person conducting the test wears
five 9D IMUs: three are
attached to the foot, shin and thigh of one leg. One is attached
to the torso side and one is
attached to the other shin. The mobile TUG test is started when
a button is pushed and
ends automatically when the person is seated again. The app
provides information on
when to turn, the person’s position, distance walked, time
elapsed and walking velocity.
During the 3-m walk, stride length (SL) is calculated using the
law of cosines. i.e., taking
the maximum angle between the legs α and the length of the
right leg (L) as input, α is the
sum of the two shin angles while the person is walking. The
22. shin angle is 0 when standing
straight. Hence, SL is calculated by solving Equation (1).
SL =
√
2L2 − 2L2 cos α (1)
To determine that the person is seated again, data from the two
IMUs attached to the
torso and thigh are used. If an IMU is in a vertical position, its’
accelerometer value on
the z-axis is ±1g while the values on the x and y axes are 0. If
an IMU is in a horizontal
position, the value on the z-axis is 0 and the absolute value for
the other two axes is
√
2
2 g or
higher. A person is sitting if the thigh’s IMU is horizontal and
the torso’s IMU is vertical.
The x, y and z values for the two accelerometers in the standing
and sitting positions are
depicted in Figure 2.
Williams et al. [36] report on two evaluations with young
people. First, the system’s
performance in determining the knee and ankle angles in
relation to three prior studies was
evaluated by letting one person conduct the mobile TUG test.
The knee and ankle angles
were detected using the VICON motion analysis system and the
mobile TUG app. The
app uses the foot and shin IMUs to calculate the ankle angle,
23. and the shin and thigh IMUs
to calculate the knee angle. The root-mean-square error (RMSE)
of the knee angle for the
Sensors 2022, 22, 573 8 of 39
TUG system in relation to the VICON motion analysis system
was found to be lower than
in their reference studies. Second, the app’s performance in
estimating time and walked
distance was evaluated by asking five participants to perform
the mobile TUG test five
times in a setting wherein the 3-m distance was marked on the
floor. They were observed
by a physiotherapist who used a stopwatch and by another
person who pushed the start
button in the app. The physiotherapist told the participants to
start and both observers
pushed their start buttons when the participants were not in
contact with the chair. The
physiotherapist pushed the stopwatch button when the
participants were in contact with
the chair again. The RMSE of time was 0.907 s, i.e., lower than
the standard error for TUG,
1.14 s. The RMSE of distance walked was 1.036 m. There were
approx. five steps per TUG
test. i.e., the RMSE was approx. 0.21 m per stride.
(a) (b)
Figure 2. TUG: accelerometer data for thigh and torso in the
standing and sitting positions. (a) Sensor
values when standing. Both sensors are in the vertical position.
(b) Sensor values when sitting. The
24. thigh sensor is in the horizontal position.
In this section, we report on six studies. Despite the fact that
motion patterns change with age
and the onset of illnesses, none of them included both gait and
balance. Studies combining these
factors would be of interest. Two studies report on the results
with older adults. Worth noticing
is that step velocity was less accurate among older adults than
young adults in [32], and that the
magnitude of the acceleration in the AP and ML directions was
significantly lower among older
adults than young adults when asked to increase the speed in
[33]. Therefore, a shortcoming with the
remaining four studies is their lack of validation with older
adults, i.e., the ones with an increased
risk of falling. Another shortcoming with the studies is that
none of them were conducted in real-life
conditions, a need pointed out in both [2] and [4].
4.2. Fall Detection
In this section, we report on seven works in which the data was
collected by the
authors [42–48]. Two additional works [12,13] used datasets as
the basis for their work.
In addition, we report on [49] although it is unclear how the
system was evaluated. One
work focuses solely on fall detection [12]. Six works
discriminate between falls and
ADLs [13,42–45,49]. Four works focus on near-fall detection
[44,46–48]. Three works
select optimal sensor locations [13,47,48], however only [48]
provides a clear motivation for
their selection. One work [13] adds a risk category parameter
and classifies subjects into the
25. categories of low-risk, medium-risk and high-risk of falling. As
shown in Table 3, only [43]
was conducted with older participants or patients. This work
also strove to detect abnormal
HR. Four works [42,45–47] provide information on the
participants’ gender. We note that
only [42,45] report on the inclusion of female participants. All
studies were observational.
Only [43] was conducted with more than 20 participants, and
three studies [45,47,48] had
less than ten participants. There is no consistency in the sensor
types used, number of
sensors or sensor locations (see Table 4).
Sensors 2022, 22, 573 9 of 39
Table 3. Participant demographics for studies on fall detection.
- = no information.
Ref. Research Design No. of Participants Age Group Age
Statistics Male/Female Patient/Healthy
[42] observational 18 - 25 ± 3.24 12/6 0/18
[43] observational 4 2 23–29, 2 61–66 - - 2/2
12 12 23–29 - - 0/12
12 12 61–66 - - 12/0
[44] observational 15 20–27 - - 0/15
[45] observational 7 - young 4/3 -
[46] observational 11 - 27.6 ± 4.3 11/0 0/11
[47] observational 8 - 23 ± 3.45 8/0 0/8
[48] observational 8 - 28.5 ± 4.3 - 0/8
26. Table 4. Study characteristics for studies on fall detection.
Ref. Sensor and Amount Sensor Location Assessment
[42] 1 6D IMU on the waist
discriminate between falls and ADLs, separation
of fall data into three phases: pre-impact, impact
and post-impact
[43] 1 accelerometer, 1 PPG, 1 SpO2
accelerometer and PPG on upper
left arm, SpO2 on the finger tip
discriminate between falls and ADLs, detect
abnormal HR
[44] 2 6D IMUs on the waist and right thigh
discriminate between falls and ADLs,
classification into: non-fall, backward fall and
forward fall, pre-impact fall detection
[45] 1 accelerometer on the wrist
discriminate between falls and ADLs, machine
learning is used to avoid false alarms
[46] 1 9D IMU on the anterior side of waist near-fall detection
[47] 4 9D IMUs on the chest, waist, shank, thigh
discriminate between falls and ADLs, best
feature for pre-impact and impact detection
of falls
[48] 9 9D IMUs
on the chest, fore-waist, left waist,
right and left thigh, right and left
shank, right and left foot
27. optimal placement for preventing/detecting
falls, pre-impact thresholds
[49] 1 smartwatch (1 6D IMU) on the wrist discriminate
between falls and ADLs
Starting at the lowest level of complexity, i.e., detecting falls
which can occur forward,
backward and sideways, as depicted in Figure 3, Boutellaa et al.
(2019) [12] used data from
two datasets2 in their work on a covariance matrix for detecting
falls. In a first step, one
covariance matrix per dataset was built using the variance of
each raw sensor signal and
the covariance of each sensor signal pair, i.e., the linear
association between two sensor
signals. Second, data from fused sensors were entered into the
matrices. For the CogentLabs
dataset, the fused matrix included 15 rows, i.e., one for each
possible sensor combinations
(the accelerometers, the gyroscopes, six pairs of sensors, four
triplets of sensors, and one
quadruple of sensors). The corresponding fused matrix for the
DLR dataset included seven
rows. Third, considering that the datasets include data collected
during different activities,
three metrics for measuring dissimilarities were applied:
Euclidian metric, affine-invariant
Riemannian metric (AIRM) and log-Euclidian metric. Accuracy
and F-score per row and
method were calculated. Analyzing the individual sensors’
ability to detect falls, the data
from accelerometers resulted in a high accuracy (>90%) and F-
score for both datasets,
regardless of sensor location. An even higher accuracy and F-
28. score was retrieved for the
magnetometer data in the DLR dataset. Regarding sensor fusion
into sensor pairs, the
reliability in terms of the F-score was generally not altered
regardless of method. Applying
the Euclidean metric on the pair of accelerometers, and the log-
Euclidean metric on one of
the accelerometer-gyroscope pairs in the CogentLabs dataset
provided a higher accuracy
Sensors 2022, 22, 573 10 of 39
(92.06 and 92.24% respectively) than data from single sensors.
An even higher accuracy
(98.31%) was achieved by applying the log-Euclidean metric on
the DLR dataset. When
fusing data of more than two sensors, the highest accuracy
(92.51%) was retrieved by
applying AIRM on the quadruple of sensors in the CogentLabs
dataset. Comparing to SoA
machine learning algorithms, Boutellaa et al. [12] found that
their method outperformed
other methods.
(a) (b) (c)
Figure 3. Illustration of people having fallen forward, backward
or sideways: (a) fallen forward;
(b) fallen backwards; (c) fallen side-ways.
Moving on to the works focusing on discriminating between
falls and ADLs [13,42,43,49],
Liang et al. (2018) [42] evaluate a system aimed to provide
assistance after the occurrence
29. of a fall. To test the reliability, 18 participants wore a 6D IMU
on their waist while falling
backwards and performing four ADLs3. Each participant
performed 20 falls and the four
ADLs five times each. Then a subset of the collected data was
used to train a HMM and
HMM-based SVM model that was used for determining the
maximum separation boundary
between falls and ADLs. The evaluation indicated that the
model’s accuracy, sensitivity
and specificity in discriminating between falls and ADLs
exceeded 93%.
Fakhrulddin and Gharghan (2019) [43] proposed an autonomous
wireless health
monitoring system for which they developed algorithms to
discriminate between ADLs
and falls, and to detect abnormal HR. The fall detection
algorithm (TB-AIC) combined an
acceleration-threshold (Ath) with an activity/inactivity function
(i.e., time threshold—Tth).
The acceleration in all directions decreases to near zero after a
fall. The signal magnitude
vector (SMV, see Equation (2)) is compared with the Ath.
SMV =
√
A2x + A2y + A2y (2)
Then, the acceleration values are assessed until Tth, e.g., 20 s.
If SMV is unaltered
after the 20 s have passed, the TB-AIC algorithm determines
that a fall has occurred. To
evaluate the algorithm, two healthy young adults and two older
adults on medication per-
30. formed seven different ADLS and falls according to a pre-
defined script while wearing an
accelerometer on the upper left arm. The script, which consi sted
of seven sub-experiments
was repeated four times by each participant. First, the
participants did an ADL (e.g., walk-
ing) for 1 min after which they deliberately fell. The sub-
experiment was completed 1 min
after the fall. The participants then continued with the
remaining six sub-experiments. Dur-
ing the experiments, a researcher manually recorded the results
from each sub-experiment,
including the performance of the accelerometer and whether
classification was correct. In
total, 224 samples were collected from the four participants,
112 ADLs and 112 falls. One
ADL (running down the stairs) was falsely detected as a fall. In
addition, one fall, from
being seated on the bed to the ground, was not detected.
Fakhrulddin and Gharghan [43]
reason that the distance was small and that the participant used
the arms to break the fall
by instinct. We note that this is also likely to occur instinctively
in real-life situations. Accuracy,
sensitivity and specificity for the TB-AIC algorithm all
exceeded 99%. The algorithm devel-
oped for detecting abnormal HR was evaluated in an experiment
with 12 healthy young
adults and 12 older adults on medication. The young adults
jogged for 3 min while the
older adults walked for 3 min while wearing a PPG sensor on
their upper arm and a pulse
oximeter. The HR estimated from the PPG and the SpO2 were
statistically compared and
there was a good agreement between the two measures. The
results reveal that the older
31. adults’ HR was lower than the younger adults’ HR during the
activities. This was due to
the medication but nevertheless a factor that needs to be taken
into account when detecting
Sensors 2022, 22, 573 11 of 39
abnormal HR. While not discussed in the future work of [43],
we find the approach of combining
data from the PPG and accelerometers interesting when
discriminating between ADLs and falls.
Further, a gender difference to consider when using HR as a
measure is that cardiac rehabilitation
after acute myocardial infarction is both underused and under -
prescribed among women despite
being recommended in evidence-based guidelines according to
[50], which outlines a number of
socio-demographic factors associated with lower use of cardiac
rehabilitation.
Information on a system aimed to provide healthcare and fall -
detection services is
presented by Ghazal et al. (2015) [49]. For fall detection,
authors propose using an ANN and
a smartwatch’s accelerometer and gyroscope. An alarm should
be sent if a fall is detected.
For each axis and sensor, a set of unnormalized readings was
extracted at a window size of
512. After normalizing the data and noise removal, all filtered
windows were merged into
a feature vector. The vector’s size was reduced through
resampling, then data was fed into
a three-layer cascade feed-forward network with 25 neurons per
layer. The overall accuracy
32. for activity classification for the non-fall activities was 93.33%.
Comparing the performance
with DTW, authors found that DTW had a lower fall detection
accuracy, which suggests
that classification can be improved using the proposed
algorithm [49]. The authors claim to
have evaluated the performance by simulating fall events and
other activities, however the number
of participants is not clearly presented.
Ramachandran et al. (2018) [13] conducted a literature study
resulting in the identifi-
cation of 23 biological risk factors for falling that were applied
to a simulated dataset with
10,000 entries. The odds ratio for each factor was used to derive
a weighted normalized
score per subject in the dataset. Based on the score, each subject
was classified into one
of three fall risk categories: high-risk, medium-risk or low-risk.
Thereafter, the UMAFall
dataset4 was used to assess the variation in detection accuracy
with and without classifying
each subject into a risk category. Then, data was preprocessed
in terms of the vector magni-
tude of acceleration and angular velocity. In a first evaluation
phase, the performance of the
ANN, kNN, NB and SVM classifiers in identifying forward,
backward and lateral falls as
well as the ADLs walking, bending, jogging, running, sitting
and lying were evaluated. It
was concluded that kNN performed better in this phase. In a
second phase, a risk category
parameter was added to the already existing feature set of data.
Thereafter, the classification
performance using only data from the wrist sensor was
evaluated. Again, kNN performed
33. best. In a follow up work, Ramachandran et al. (2019, 2020)
[51,52] explored the effect
on performance of combining IMU and HR data in fall
detection. A labelled dataset was
created by asking 10 young healthy participants (gender not
reported) to perform 14 ADLs
and six different falls, twice, while wearing a smartwatch. RF,
which was added as an
additional classifier in [51], performed best and the
performance increased when adding
HR as a feature. Using the same dataset [52] replaced SVM with
XGBoost, RF outperformed
also XGBoost. We wish to stress here that no motivation to the
choice of adding the RF classifier is
provided and statistical tests for differences are not presented.
Motivation for replacing SVM with
XGBoost in [52] is also lacking. We find it peculiar that SVM
was replaced since SVM outperformed
NB in the other works [13,51].
Two works aim to minimize the number of false fall alarms
[44,45]. Wu et al. (2019) [44]
proposed and evaluated a novel method for detecting falls prior
to impact during walk-
ing. Thigh and waist angles, and angular velocity around the y-
axis were collected from
15 participants wearing two 6D IMUs on the right thigh and
waist. Each of them performed
15 walking trials including ≥five gait cycles, 15 fall -like
activities5, 17 backward falls and
17 forward falls. A fall trial was valid if including ≥two gait
cycles. The participants
watched fall movies and tried to mimic the falls. After
developing a hierarchical classifier
based on Fisher discriminant analysis, human activities were
classified as: non-fall, back-
34. ward fall or forward fall. The accuracy in discriminating
between activities and falls was
≥95%. In addition, the number of false alarms was significantly
reduced when fusing the
data from the two sensors (sensitivity: 95.5%, specificity:
97.3%).
Saleh et al. (2019) [45] used a two-step strategy to detect falls
and avoid false alarms.
The technology used was a wrist-worn accelerometer with a
built in embedded algorithm
Sensors 2022, 22, 573 12 of 39
sharing strong similarities with the TB-AIC algorithm for
detecting falls [43]. Saleh et al. [45]
also compared SMV (see Equation (2)) with a predefined
threshold to detect impact. If
inactivity was detected, data was sent to a remote server. An
experiment was conducted
in order to train the SVM and to evaluate the performance in
discriminating between
real falls and false alarms. Seven young participants per formed
19 different ADLs and
simulated 35 types of falls. Applying a 10-fold cross validation,
it was found that the
accuracy was 92.35% for a quadratic-kernel-based SVM and
91.58% for a linear SVM. Then,
121 features (of 12,000 features) were selected usi ng SVM-
RFE. Using these features, the
accuracy was 100%. To follow up on this work, Saleh et al.
(2021) [27] developed an open
dataset FallAllD, which contains data from 15 subjects (8 men
and 7 women between 21 and
35. 53 years of age) who wore three 9D IMUs combined with a
barometer on the neck, waist
and/or wrist while performing a selection of 35 possible falls
and 44 ADLs. It is shown
that using machine learning classifiers is more feasible than
deep learning due to lesser
energy consumption and that accuracy increases when sampling
at 40 Hz instead of 20 Hz.
Furthermore, accuracy increases with acceleration measurement
range and performance is
worse when using data collected at the wrist. However, falling
from bed and slowly falling
by sliding the back along the wall were difficult to detect
regardless of sensor location.
It is also discussed that alarms need to be issued even if there is
a recovery after a fall.
Otherwise, instances of subdural hematoma may remain
undetected. It is demonstrated
in [27] that performance decreases when taking recovery
periods into account. The location
resulting in the lowest number of false negatives was the waist.
A study with 20 older
adults is reported as ongoing.
Moving on to the works focusing on near-fall detection [44,46–
48], Lee et al. (2015) [46]
address the problem of detecting near-falls, falls and ADLs.
Eleven students performed a
number of falls, near-falls and ADLs while wearing a 9D IMU.
The participants performed
seven different types of falls found in prior research. Similarly
as done in [44], the par-
ticipants watched movies and tried to mimic the falls witnessed.
Each participant made
three falls of each type. The near-fall experiments included
performing five types of falls6
36. three times. The participants were asked to regain balance
instead of falling. The other
two fall types were not recorded (faint and stand-to-sit) due to
the participants failing
to regain balance. All types of falls and near-falls were selected
based on prior research.
In addition, the participants performed five types of ADLs7
three times. Two methods
were used to detect falls, one was based on vertical velocity and
the other on acceleration.
The methods’ performance in discriminating between falls and
ADLs was comparable.
The vertical velocity based method showed a much higher
accuracy (sensitivity: 95.2%,
specificity: 97.6%) in discriminating between falls and non-falls
(near-falls and ADLs) than
the accelerometer-based method (sensitivity: 84.0%, specificity:
85.5%).
The two last works, ref. [47,48] focus on selecting the optimal
sensor location for
near-fall detection. In [47], Liang et al. (2012) collected data
from eight participants wearing
four 9D IMUs on the chest, waist, shank and thigh. The
participants performed four
ADLS once and four types of falls three times each8. Liang et
al. [47] found using a SMV
(see Equation (2)) on accelerometer data to discriminate better
between falls and ADLs
than did vertical velocity or SMV for gyroscope data. Falling
data was separated into
three phases: pre-impact, impact and post-impact, where pre-
impact is a weightlessness
state, impact is when the body hits the ground and post-impact
is what happens after the
37. ground hitting. Liang et al. discuss thresholds for altering falls
(5 m/s2) and ensuring falls
(35 m/s2) providing the pre-impact leadtime of 500 ms.
Regarding the selection of optimal
sensor location, accelerometry data from the waist- and chest-
worn 9D IMUs had higher
amplitudes and a lower number of peaks. The waist location was
recommended since it
lowers the risk of being hurt when falling. Recall that the waist
location also resulted in the
lowest number of false negatives when taking the recovery
period into account in [27]. Finally,
ref. [47] discusses how data recorded with older adults could
differ. It is noted that the
recording of data and video monitoring in their living
environments would allow for a
more true fall analysis.
Sensors 2022, 22, 573 13 of 39
In another work by Zhao et al. (2012) [48], i.e., the same
authors as in [47] and a few
additional ones, it was found that the chest is the optimal sensor
location for preventing
and detecting falls. A system consisting of nine 9D IMUs was
implemented and eight
participants performed a number of ADLs and falls while
wearing the sensors on the chest,
fore-waist, left waist, right and left thigh, right and left shank
and right and left foot. The
ADLs included calibrating the sensors once for each of the
actions: stand-sit-stand, walk
and stand-sit-lie. Each ADL was conducted three times. The
falling activities included one
38. calibration for falling followed by three right sideways falls,
three forward falls and three
backward falls. Using, again, the SMV equation (see Equation
(2)), the authors revised their
previous acceleration thresholds for altering falls to 7 m/s2 and
20 m/s2 for ensuring falls.
In addition, the critical angles of postural stability during the
three types of falls along with
pre-impact lead times were studied. The largest postural
stability angle (49.9 ± 4.1◦) was
associated with sideways falls. The corresponding postural
stability angles for forward
falls and backward falls were 23.9 ± 3.3◦ and 9.9 ± 2.5◦
respectively. Studying the pre-
impact lead times, forward falls were associated with the
longest time of body adjustment
(329 ± 21) ms. Corresponding pre-impact lead time for sideways
falls and backward falls
were 265 ± 35 and 257 ± 36) ms. Given these numbers,
backward falls are those most
difficult to avoid due to the small postural stability angle and
shorter pre-impact lead time.
We note that the participants in [46] failed to regain balance
when simulating falls while changing
from a standing-to-sitting position. The altered CoM during
backward falls and falls while sitting
down is difficult to restore.
In another article, Kristoffersson et al. (2021) [53] review the
existing evidence for
sensor-based fall risk assessment and risk factors for study bias.
The review covered
33 studies including ≥10 participants aged ≥60. Approximately
33% of them included at
least 100 participants. In 22 of the studies, participants were
classified as a faller/non-faller
39. through feature selection. In the remaining 11 studies,
classification models were applied.
Several sensor features and three classification models were
found to vary significantly
between fallers and non-fallers. However, too few studies used
prospective data, samples
were too small and too few participants were fallers. In
addition, the used features varied
significantly and validation with recommended methods was
limited.
Several of these risk factors have also been identified in this
section, ten works about which
we have reported on, retrieved during the literature search, and
on another three works [27,51,52].
Despite the fact that both age and gender affect fall risk, and
potentially, also, injuries after a fall, only
a total of 14 older adults (who were aged 61-66) were recruited
to the studies. Gender distribution
was only provided for five studies, two of them included only
men and the remaining ones included
a majority of men. None of the studies were conducted in real -
life conditions. Hence, the validity
and the generalizability of the reported results are low. Worth
mentioning, though, is the recently
published [27] on the open dataset FallAllD, wherein a
longitudinal study with older adults is
reported as ongoing.
4.3. Physical Activity Recognition
In this section, we report on nine works [54–62] where authors
have collected data and
three works [14–16] based on datasets. Five works focus on
classification of PA, postures,
and/or PA energy expenditure (PAEE) in controlled
40. environments [54–58]. One work takes
this one step further by classifying PAs and estimating PAEE in
real-life (2013) [59]. Four
works deal with the issue of large-scale monitoring in real-life
[14,60–62]. The last two focus
at detecting bed-exits [15] and life logging to prevent obesity
[62]. The observant reader
may have noticed the terminology change from ADLs to PAs in
this section on physical
activity recognition. Table 5 shows that remarkably little
information has been provided
regarding the participant demographics. Only 5/10 of the
conducted studies report age or
gender and none of them include older adults (≥65 years). Only
one study was conducted
with patients. Three works report on sub-studies [58,59,61].
Only [58,59,62] report studies
with 20 or more participants. All studies were observational. A
variety of different sensor
types, number of sensors and sensor locations is reported (see
Table 6).
Sensors 2022, 22, 573 14 of 39
Table 5. Participant demographics for studies on physical
activity recognition. - = no information.
Ref. Research Design No. of Participants Age Group Age
Statistics Male/Female Patient/Healthy
[54,55] observational 3 - - - -
[56] observational 17 - - 10/7 -
[57] observational 10 25–60 - 5/5 -
[58] observational 50 16–32 - - 0/50
41. 30 16–32 - - 0/30
[59] observational 65 - - - -
20 - - - -
[60] observational 14 - - - -
[61] observational 4 - - - -
3 - - - 0/3
5 - - - 5/0
6 - - 3/3 -
[62] observational 66 young - - -
Aiming towards reducing the risk of falling, Awais et al. (2019)
[15] propose an
internet of things (IoT)-based solution for classifying ADLs.
The idea is to detect bed-exits
and allow for alerting healthcare professionals such that
precautionary actions can be
taken. Two datasets [23,24]9 were used for this purpose. In
[23], 10% of the data was
labelled as on-bed, 13% as lying and 87% as off-bed. The
proportions were different
in [24], wherein 74% of the data was labelled as lying, 24% as
on-bed and only 2% as
off-bed. During feature extraction, it was noted that a SVM (see
Equation (2)) was useful
for discriminating between sedentary activities, such as lying
and sitting and high intensity
activities. Therefore, features extracted from the two datasets
included both statistical
descriptors and features in the time-frequency domain obtained
by the accelerometer and
SVM data (see Equation (2)). In addition, the same features
were extracted for the received
42. signal strength indicator (RSSI) in [24]. RF, SVM and a W-
SVM penalizing the majority
represented class were used to classify the data. Studying the
classification performance of
the data in [23], all classifiers achieved an overall performance
of 90% but the performance
was lower during sedentary activities for RF and SVM.
Performance improved using W-
SVM. Awais et al. [15] reason that this is caused by the fact
that the activity level is much
higher off-bed than during sedentary activities. Studying the
classification performance
of the data in [24], which included considerably more sedentary
behavior than [23], RF
performed best overall (88.4%) while W-SVM performed worst.
Awais et al. [15] reason
that this is in-line with their prior research [63] and that more
samples are needed. The
recognition of off-bed activities in [24] was approx. 70% for RF
and SVM, and 66% for
W-SVM. The dataset [24] is affected by noise and packet loss to
a larger degree, i.e., the
SNR varies with the distance between the RFID’s transmitter
and receiver. For detecting
bed-exits and alerting staff, the classification needs to be
correct and performed in real-time.
It is claimed that the proposed system can issue alarms within a
0.1-s delay. Future work
outlined includes validating and testing the proposed system in
real settings (clinical or
residential, however we have not found such work published
yet.
Continuing with the works focusing on classification of PA,
postures and/or PAEE in
controlled settings [54–58], Castro et al. (2017) [54] presented
43. an IoT system consisting of a
chest-worn band equipped with sensors for measuring HR, RR,
ST and accelerometry, a
smartphone application (for data reception, classification and
visualization) and a cloud
(for storage of raw data and recognized activities). The system
can provide visual feedback
while conducting PAs. Machine learning algorithms were
applied on data recorded when
three students performed four PAs10 in a pre-set order, twice.
After feature extraction using
a straight line as structural detector and pre-processing using
principal component analysis
(PCA), classification using C4.5 was correct for 95.83% of the
PAs. Future work include a
comparison of the performance when using different structural
detectors, collection of a
larger and more heterogeneous set of training data and the
implementation of a classifier
Sensors 2022, 22, 573 15 of 39
in the cloud to overcome current hardware limitations [54],
however we have not found such
work. The work by Rodriguez et al. (2017) [55] has strong
similarities with [54] but the
number of participants is lacking and jogging is replaced by
running.
Table 6. Study characteristics for studies on physical activity
recognition.
Ref. Sensor and Amount Sensor Location Assessment
44. [54,55] HR, RR, ST, 1 accelerometer elastic band on chest
discriminate between four PAs
[56]
Class-act: 11 accelerometers,
Shimmer: 5 accelerometers
Class-act: symmetrically on the right
calves, upper and lower arms, the chest
and on the right hip and ankle.
Shimmer: right calf, thigh, upper arm,
lower arm and chest
classify eight postures
[57]
24 force-sensitive resistor sensors, 2
9D IMUs
X73-compliant insoles PA life logging
[58] 1 6D IMU on the wrist detection of PA and PAEE
[59]
2 accelerometers, up to eight 6D
IMUs, EE, HR, inter-beat interval,
O2, CO2
a mask on the mouth, other locations
unclear
detect PA and posture, PAEE
1 accelerometer, 1 6D IMU, EE, HR,
inter-beat interval
45. IMU on the hip, other locations unclear
detect PA and posture, PAEE, real-life
data PA
[60] 4 9D IMUs
on the dominant wrist, knee, ankle and
mid-waist
context classification, context-driven
activity classification, real-life PA
[61]
4 9D IMUs, GPS, Vicon motion
capture system, Kinect system
above the elbow and wrist on the
dominant arm, on the top-front of shoes
context-guided activity classification,
real-life PA
[62] 1 Apple Watch on the non-dominant wrist
reduce energy consumption in
real-life PA monitoring
Rednic et al. (2012) [56] focused on experimental design
features (number of sensors,
sampling rate, training set size and extracted features) that can
influence performance
when classifying eight postures11 used in explosive ordinance
disposal missions. Data was
collected from 17 participants using two sets of sensors12. The
sampling rates for the two
systems were 10 and 100 Hz, respectively. After processing the
data using a sliding window
of 30 samples and a sampling rate of 10 Hz and applying eight
46. different machine classifiers,
the classification accuracy for all postures and sensors was
cross validated using leave-one-
subject-out. It was found to be insensitive down to a reduction
to two sensors positioned on
the right thigh and calf. The accuracy decreased significantly if
only one sensor was used.
Then, the most optimal position was the calf. Adequate
performance was also achieved
when using the hip sensor. The performance was insensitive to
sampling rate. Further, the
classification accuracy stopped increasing after the inclusion of
eight participants in the
training set. Studying how the extracted data features affected
the classification accuracy,
it was found that windowed variance performed best for the
postures walking, standing
and crawling, whereas exponentially weighted moving average
performed best for the
postures laying on one side or with face up. The performance in
classifying sitting was
high regardless of the extracted feature.
Laamarti et al. (2020) [57] presented a digital twin framework
for collection of health
and well-being data and for motivational interaction with the
real twin. Proposing the use
of the digital twin for physical exercise motivation and
encouragement, a case study was
presented. Data was collected from 10 participants performing
three PAs13 while wearing
X73-compliant insoles. Each PA was manually labelled but no
further information on the
experimental setup was provided. Using a CNN, authors found
that the best performance
was achieved when the model was trained with data from all
47. participants. Plans for more
large-scale and long-term studies were reported.
Sensors 2022, 22, 573 16 of 39
Aiming at assessing PAEE, Caya et al. (2019) [58] reported on
two experiments for
training and testing an ANN used for classifying four PAs14
associated with different
metabolic equivalent task (MET) values. The PAEE was
calculated by multiplying the MET
value with the duration of the PA. The two experiments
included 50 and 30 young adults
of both genders but no gender distribution was provided. The
participants performed the
PAs while wearing a 6D IMU on the wrist. It is not clear how
the ANN was trained. For
testing the ANN, 30 participants performed each PA for 20 s,
and each PA was performed
three times. The ANN classified 91.11% of the 360 PAs
correctly. The future work suggested
included changing sensor locations and classifiers.
Advancing to classifying PAs and estimating PAEE in real -life,
Doron et al. (2013) [59]
reported the results from an SVELTE project in which a few
prototypes and algorithms
for classifying nine PAs15 were developed. Data was collected
in two steps. First, in the
laboratory where 65 participants followed a PA path including a
total of 23 standardized PAs
or postures for 2 h. Each participant spent up to 5 min per PA
except for when lying down,
where metabolism was estimated over 45 min via indirect
48. calorimetry based on O2 and CO2.
The participants wore two accelerometers, up to eight 6D IMUs,
a mask for measuring O2
and CO2 and an Actiheart (for measuring EE, HR and inter-beat
interval). Information was
lacking regarding sensor positions but through sensitivity
analysis, ref. [59] determined
that the best location for a 6D IMU is the hip. We note that this
was also the second best location
in Rednic et al. (2012) [56], which focused on classifying
postures used during explosive ordinance
disposal missions. Modelling the PAs with a Gaussian mixture
model of two Gaussians, 79.3%
of all PAs were correctly identified. However, the detection rate
ranged from 55% for sitting
to >90% for lying down, walking and running. The real-life
experiment was conducted
with 20 participants following a PA path in Lyon for approx.
3.5 h while wearing a 6D
IMU on the hip, an accelerometer and an Actiheart. A
researcher followed the participants
and annotated the start and end of each PA. Applying the
Gaussian mixture model on
the real-life dataset, which included many additional PAs,
showed that the algorithm was
limited when discriminating between the PAs lying down,
slouching and sitting, as well as
between the PAs standing and stalling. It should be noted that
[59] provides no definition for
what constitutes any of its PAs. Therefore, it is difficult to
compare the algorithms’ performance with
the aforementioned works [54,56] which appear to present
higher classification accuracies for sitting
activities. Ascending stairs was classified as walking 68% or
stalling as 20% of the time.
Descending stairs was classified as walking during 57% of the
49. time but as running 42%
of the time. Standing in a vehicle was identified as stalling 92%
of the time while sitting
in a vehicle was identified either as slouching, sitting or
stalling. It is unclear if and how
information on EE was used in the classification and a database
mainly related to EE is reported as
being under collection in [59]. A search for this database was
unsuccessful.
Several works [14,60–62] dealt with issues related to large-
scale monitoring in real-life.
Rokni and Ghasemzadeh (2019) [14] argued that the need to
retrain machine learning
algorithms for new sensor contexts (on-body locations, new
users etc) is a major obstacle.
Share-n-Learn, where the idea is that new sensor contexts
should be automatically detected
using a repository of shared expert models, was introduced in
[14]. Algorithms should
detect dynamic sensor contexts (on-body locations) and activate
the most accurate machine
learning algorithm for these locations. Such a solution allows
for non-static sensor locations.
Share-n-Learn trains a gating function using a static sensor
together with a dynamic sensor.
For each static sensor, there is an expert model for PA
recognition. The dynamic sensor is
moved around to obtain a repository of expert models, i.e., the
static sensor teaches the
dynamic sensor (learner) by presenting probability information.
The learner compares the
probability information with the probabilities provided by the
different experts. To demon-
strate Share-n-Learn’s effectiveness, data from three datasets
16) performing ADLs while
50. wearing IMUs at different locations. Treating one IMU at a time
as the static sensor and the
other sensors as dynamic, a repository of experts was built.
Assessing the performance of
Share-n-Learn when moving a sensor, it was found that Share-n-
Learn could accurately
detect 68.4% of PAs [14]. A number of planned future works,
including the collection of data in
Sensors 2022, 22, 573 17 of 39
real time, was reported in [14], but we have not found such
work. We argue that this is a necessity
for overcoming the problem of having to retrain machine
learning algorithms for new sensor contexts.
We appreciate the intention to develop algorithms allowing for
learning from already trained expert
models and the possibility to use dynamically moving sensors.
Xu et al. (2014) [60] presented a system allowing healthcare
professionals to subscribe
to individualized training programs and to monitor quality and
patient compliance. Ac-
tivities are separated from contexts. Context is the subset of
external attributes which
characterize an environment or a situation, i.e., meeting is a
context whereas sitting in a
meeting is not since the latter includes an activity. Different
individual activities may be
prescribed in each context. Further, ref. [60] introduced
scenarios wherein “A scenario is the
combination of a context, and a set of activities of interest
under that context, with a model
for distinguishing the activities” (p. 1017). On a high-level, the
51. system operates in three
modes: (1) prescription, (2) training with end users such that
the classification system can
recognize the context and the end users’ motions and (3) the
live monitoring of end users.
The system—which comprises an Android tablet app, four 9D
IMUs positioned on the mid
waist and on the dominant wrist, knee and ankle—obtains
sensor data and determines
the context and motions using a number of classifiers running as
core components in the
app. The system’s ability to classify contexts and activities was
evaluated by collecting
data from 14 participants who spent 30 min in eight different
contexts. For each context,
they performed a number of PAs for 2–5 min. Then, 30% of the
data was used for training
four context classifiers: wireless kNN, time kNN, AdaBoost
using sound features and
a committee approach, performing a linear combination of
results from the other three
classifiers. The remaining 70% was used for testing. The
committee approach performed
best. Wireless kNN was not sufficiently accurate in buses and
outdoors due to the detection
of new access points along bus routes and the simultaneous
detection of access points
belonging to different outdoor contexts. Time kNN was not
sufficiently accurate in a num-
ber of contexts due to variations in when contexts were visited
by participants. AdaBoost
worked well in most contexts, however, misclassifications
occurred during long periods
of silence and if a bus passed nearby. Thereafter, the
performance of the context-driven
personalized activity classifier approach was evaluated by
52. comparing it against a hierarchical
NB using the wireless health institute sensor fusion toolkit
(WHISFT). The context-driven
approach, in which the system needed to consider only the PAs
related to the current
context, resulted in a substantially higher classification
accuracy and a significantly lower
classification time. The number of sensors required to be active
can vary between scenarios.
Therefore, the approach could lower the energy consumption.
In a more recent work [61], Xu et al. (2016) extend the work by
adding the reporting
of PAs at different granularity levels including location
categories a person can visit, and
which PAs can be performed at each location category. Motion
trajectories and metrics are
computed and can be used for visualizing each PA. A location
context detection model
using WiFi augmented GPS was also added. The system’s
capability of detecting context
was evaluated by four participants equipped with a tablet who
visited any places matching
a number of contexts during a period of 7 h while wearing four
9D IMUs, above the
elbow and wrist of the dominant arm and at the top of both
shoes. The system performed
well in classifying commercial contexts such as restaurants and
gyms but less well during
residential visits due to the system API’s lack of residential
coordinates. WiFi augmented
GPS resulted in an improved tablet battery time. The lower
body motion tracking algorithm
was evaluated in two steps. First, three healthy participants
performed three different
PAs17. Comparing the results against data captured by the
53. Vicon motion capture system,
the method [61] was found to reconstruct their lower body
motions accurately. Second, five
patients with hemiparetic gait after stroke performed the 10 m
walking test. The absolute
error for distance estimation was lower for the healthy side than
for the hemiparetic side.
To verify the results, a control group also performed the same
test. The upper body motion
tracking algorithm was evaluated by six participants performing
a number of arm motions.
A comparison with the Kinect system for capturing skeleton
movements indicated a low
Sensors 2022, 22, 573 18 of 39
error, on average. It was stated that a larger study is needed to
ascertain system robustness
and to compare the results against golden standards. Further,
clinical trials are needed to
assess the efficacy of the data provision.
Starting from the standpoint that continuous monitoring of PAs
requires energy-
efficient strategies, Culman et al. (2020) [62] introduced a
change point-based activity
monitoring (CPAM) algorithm in which the sampling rate is
adapted based on state changes.
To test the algorithm, 66 participants wore an Apple Watch on
the non-dominant wrist
while performing and labelling nine PAs18. The watch included
an IMU (acceleration,
gyroscope, compass), a HR sensor and GPS. It was argued that
some PAs are easy to
54. recognize while others, more complex PAs, such as watching
TV and listening to a lecture,
require location data. The PA recognition accuracy increased
from 0.78 to 0.95 when adding
location data, and CPAM was found to reduce energy
consumption by 74.64%.
Finally, Dobbins et al. (2017) [16] focused on life logging to
prevent obesity. Two
datasets19 are used as input to the system which uses a
smartwatch for displaying results.
The 16 PAs in the two datasets represent three different PA
levels: light, moderate and
highly energetic, i.e., PAs associated with different MET
values. The approach [16] includes
collecting, processing, classifying and visualizing data. Ten
different classifiers were
evaluated and the approach showed a higher classification
accuracy than four prior studies.
Future work includes system implementation, a focus group,
user acceptance tests and
examination of unsupervised methods. However, we have not
found such work.
This section has analyzed twelve works. The differences related
to age, gender and healthy
participants vs patients that were outlined in Section 1 show
that PAs may be performed differently
depending on the demographic variables. Generally, very little
information on demographics is
provided. Only one work [15], which is based on a dataset
considers older people but without
reporting any other sociodemographic information. Therefore, it
is unclear how representative the
results of the studies in this section are from a broader
perspective.
55. 5. Rehabilitation
Ten works report on the use of wearable sensors for
rehabilitation purposes. Two
works focus at orthopaedic rehabilitation [64,65] and five works
focus on stroke reha-
bilitation [66–70]. Other focus areas include assessing
endurance during low back pain
rehabilitation to improve trunk muscle status [71], personal
classification during lower
limb rehabilitation exercises [72] and gait retraining by
adjusting the foot progression angle
(FPA) [73]. Despite the fact that the studies target
rehabilitation, Table 7 shows that only
four studies include patients. Looking at the participants’ age,
different age spans have
been reported. The majority of the studies were observational,
only one article [66] was a
case-control study. Three studies [66,67,72] had more than 20
participants but [72] included
only healthy participants. Three other studies [69,71,73] were
conducted with ≤10 par-
ticipants. All demographics information is lacking in [70].
While several different focus
areas are reported, Table 8 shows that all but two articles
[70,71] use only accelerometers,
6D IMUs or 9D IMUs in their assessment. The number of
sensors used and the sensor
locations varied.
Starting with orthopaedic rehabilitation, Argent et al. (2018)
[64] explored the opin-
ions of using wearable technology in rehabilitation through one-
on-one semi-structured
interviews with ten participants representing the clinical
56. disciplines physiotherapy, oc-
cupational therapy, clinical nurse specialists, orthopaedic
assistants and staff nurse. A
prototype of a wearable exercise biofeedback system, consisting
of a shank-worn 6D IMU
and a tablet Android application, was demonstrated. Clinicians
saw a potential for the
technology but also design and implementation challenges
related to technical accuracy
and individual tailoring of rehabilitation. Further evaluation
was performed using a mixed
method approach in Argent et al. (2019) [65]. Fifteen patients
having undergone knee
replacement surgery used the system at home for 2 weeks, after
which they participated in
a semi-structured interview and filled out the System Usability
Scale (SUS), and the user
version of the Mobile Application Rating Scale (uMARS). To
minimize the risk of harming
Sensors 2022, 22, 573 19 of 39
acute patients because of system shortcomings, it was first
tested by five post-acute pa-
tients, who had undergone their surgeries ≥6 weeks prior to
being introduced to the study.
Then, 10 acute patients, representing the system’s target group,
were recruited 2–3 days
post-surgery. They were introduced to the system already before
undergoing surgery. The
tablet was used to: guide them through exercises, mirror their
movements in real-time,
count the number of repetitions and provide feedback on the
technique at the end of each
57. exercise. The feedback was based on supervised machine
learning. Prior to bringing the
system home, a 30 min training session including the full set of
prescribed rehabilitation
exercises was provided. The investigator visited and observed
the training twice during the
2-week period of system use, and took notes on system crashes
and user errors. SUS scores,
which indicates a high usability, was supported by qualitative
results. The mean adherence
rate was approx. 80% among those reporting a positive user
experience. The study [65]
resulted in the identification of a number of bugs and
inacurracies, but also suggestions for
features that could increase user engagement.
Table 7. Participant demographics for studies on rehabilitation.
- = no information.
Ref. Research Design No. of Participants Age Group Age
Statistics Male/Female Patient/Healthy
[65] observational 15 - 63 ± 8.32 6/9 15/0
[66] case-control 20 - 54.4 ± 10.1 - 20/0
10 53.8 ± 11.4 - 0/10
[67] observational 25 - 67 ± 12 - 25/0
[68] observational 18 18–40 - - 0/18
[69] observational 9 - 60.7 5/4 9/0
[70] observational - - - - -/0
[71] observational 10 21–37 - 8/2 -
[72] observational 55 - 24.21 ± 5.25 37/18 0/55
[73] observational 6 - 72.5 ± 6.0 3/3 -
Table 8. Study characteristics for studies on rehabilitation. * =
the system contains eight IMUs but
58. only six IMU locations are specified.
Ref. Sensor and Amount Sensor Location Aim
[65] 1 6D IMU on the shank
mirror movements during knee
rehabilitation exercises
[66] 2 6D IMUs on the wrists
detect whether an ADL is conducted with
the unaffected limb and encouraged the
use of the affected limb
[67]
2 prototypes of ring-worn
accelerometers, 2 MTw
accelerometers
rings on the index fingers, MTws on the
wrists
evaluate finger-worn accelerometers
efficacy in measuring information relevant
for clinicians
[68] 4 Arcus 9D IMUs 2 on fingers, 2 on the wrists monitor
amount of hand-use in ambulatorysettings
[69] 3 9D IMUs
on the thorax, upper and lower parts of
the affected arm
measure arm/hand function/activity and
program exercises tailored to the patient by
dividing skills into sub components
59. [70] 4 6D IMUs, 8 pressure sensors
IMUs on the shins and thighs, pressure
sensors in footwear insoles
recognize lower limb rehabilitation exercise
[71] 2 9D IMUs, 1 EMG IMUs on the lumbar zone (D12-
L1vertebrae and dorsal), EMG on back
measure trunk endurance in back pain
rehabilitation
[72] 1 9D IMU on the left thigh
personalized classification to evaluate
exercise technique
[73] 8* 9D IMUs
top of each foot, and two providing
vibrotactile feedback on the medial and
lateral sides of each shank
measure FPA and provide vibrotactile
feedback to adjust FPA
Sensors 2022, 22, 573 20 of 39
Continuing with stroke rehabilitation [66–70], Lee et al. (2018)
[66] propose a system
for functional recovery of the upper limbs. The system detects if
an ADL is consistently
performed with the unaffected limb and encourages the use of
the affected limb instead.
Further, the system assesses the quality of motor performance
while the user conducts
home-rehabilitation exercises, and uses this knowledge to
60. provide feedback and promote
high-quality exercising. The main focus of [66] was the
development of algorithms based
on data from 20 stroke survivors and a control group with 10
age-matched participants
wearing two 6D IMUs on the wrist. The stroke survivors started
by performing the Fugl-
Meyer Motor Assessment (FMA) [74]. Thereafter, a therapist
selected a subset of motor
tasks and rehabilitation exercises (≥8 motor tasks and ≥5
exercises) that they should repeat
three-to-five times. The control group performed all motor tasks
and rehabilitation exercises.
All participants were video recorded, after which sensor data
was time-synchronized to
allow for offline analysis. The therapist used the videos to label
the data. First, all data from
the unaffected limb of the stroke survivor and both limbs of the
controls was labelled as goal
directed or non-goal directed. The therapist also used the videos
for providing feedback
on the performed rehabilitation exercises, i.e., how accurately
they were performed and if
there were compensatory movements. The label feedback was
provided if feedback was
provided for situations during which feedback would have been
provided during standard
rehabilitation. Otherwise, the label no feedback was provided.
The labelling was performed
for all participants. After preprocessing the ADL data (we
presume this refers to the motor
tasks), a ROC curve was generated using logistic regression and
leave-one-subject-out cross
validation. The ROC AUC of 87% indicates that there was a
strong classification ability
between goal-directed and non-goal-directed movements.
61. Feedback on rehabilitation
exercises was generated by: (1) pre-processing the time series
data, (2) classifying the
time-series using NN-DTW, (3) selecting features relevant for
determining feedback type
through a correlation-based algorithm and (4) classifying the
performance into “feedback”
or “no feedback” using RF. The system could detect poor
performance (F-score = 84.3%)
and detect 83.1% of the instances labelled as “feedback”. In
addition, ref. [66] reports on
focus groups with 17 chronic stroke survivors and 13
occupational therapists. The majority
of the occupational therapists found the system adequate and
were willing to use it in
their clinical practise, and a majority of the stroke survivors
would use the system if their
occupational therapist recommended them to.
Aiming towards post-stroke continuous monitoring of upper-
limb performance, Kim
et al. (2019) [67] designed a prototype of a finger-worn ring
containing an accelerometer and
investigated its efficacy in collecting meaningful information.
The use of a ring is motivated
by: (1) wrist-worn sensors being insufficient for studying fine-
hand movements [75], (2) in-
strumented gloves being cumbersome to use for real-time
monitoring [76] and (3) while a
combination of a magnetic ring and a magnetometer on the wrist
has been proposed [77],
a minimum number of sensors is preferred [78]. Assessment of
post-stroke upper-limb
performance requires the monitoring of both limbs. Hence, a
solution, such as the one
proposed in [77], would require four sensors, and Kim et al.
62. [67] argue that this may have a
negative effect on adherence. Prior work, ref. [79], indicated a
high correlation between
self-reported preferred handedness and measures of actual hand
usage. A quantitative
study with 25 stroke survivors, and two qualitative semi -
structured interview studies with
the stroke survivors and seven occupational therapists were
reported [67]. In this article, we
focus only on the quantitative study, which was conducted in
several steps:
1. Self-reporting using a motor activity log (MAL). For 30
items representing different
ADLs, the answer is provided on two scales: amount of use
(AoU) and quality of
movement (QoM). MAL-AoU focuses on usage of the affected
limb while MAL-QoL
focuses on the movement quality, i.e., speed and accuracy.
2. Research therapist assessment of impairment level and
quality of movement using
FMA and a subset of the Functional Ability Scale (FAS) [80].
3. Performing six motor tasks20 while wearing two
accelerometers on the index fingers
and two on the wrists, to allow for comparison. Most tasks were
bilateral, others also
Sensors 2022, 22, 573 21 of 39
included unilateral tasks, such as picking up a sock with one
hand. The tasks required
gross-arm and/or fine-hand motor skills. All tasks, except
63. walking and S2S, were
performed twice. Firstly, in the way they would normally
perform the task. Secondly,
while using the affected limb as much as possible.
The correlation was higher between the finger-worn
accelerometer data and MAL-
AoU than between the wrist-worn accelerometer and MAL-AoU.
The general findings
in [67] included: (1) the unaffected limb was more frequently
used, (2) the unaffected
limb’s intensity was higher than the affected limb’s during
bilateral tasks, (3) the use of
the unaffected limb increased with task complexity (particularly
during the buttoning
shirt task) and (4) mild impairment was associated with a more
symmetric limb usage
than moderate impairment. There was a significant different
between the two attempts at
putting on socks. Some with a moderate impairment did not
succeed at all when asked to
perform the task while using the affected limb as much as
possible. Kim et al. [67] reason
that those with a moderate impairment may not put in this effort
if having an mHealth
system at home. Their future plans included designing and
building a self-monitoring
system, and performing lab and field tests. We have not found
such work published yet.
Still21 focusing on using finger-worn accelerometers for hand-
use monitoring but
using a different sensor, Liu et al. (2019) [68] asked 18 healthy
participants to perform
11 motor tasks while wearing four 9D IMUs on the index
fingers and wrists. Reflective
64. markers were put on each IMU for Qualisys benchmarking. The
tasks, which required
different levels of fine-hand and gross-arm movements, were
both unilateral and bilateral.
The unilateral tasks were performed three times, twice with the
dominant hand, and
once with the non-dominant hand. There was a high correlation
between the first two
measures and a significant difference between the second and
third measures. Applying
SVR and leave-one-subject-out cross validation on the different
sensor configurations, it was
found that only the finger-worn IMU sensors could capture
sufficient information on hand
performance. The study limitations highlighted included the use
of only 11 motor tasks
and a low number of healthy participants. Therefore, the results
cannot be generalized to a
post-stroke patients or general population [68]. We note that
neither [67] nor [68] presented
information on the size or weight of the rings, which have
different shapes and different
sensors/batteries enclosed. Considering the aim of monitoring
gross and fine hand use
among post-stroke patients, we note that size and weight are
both important to consider.
Both these factors may cause problems for the carrier and affect
their ability to move their
fingers and their willingness to wear the rings.
Timmerman et al. (2010) [69] focused on a technology-
supported version of the task-
oriented arm training regime (T-TOAT), which decomposes
skills into smaller, related
and functional components. Patients trained by performing each
functional component
65. separately before performing the complete skill. An example is
the skill “drinking from
a cup”, which can be decomposed into functional components,
such as reaching out and
grasping. The system used was the Philips Research Stroke
Rehabilitation Exerciser [81],
which comprises a patient station and a therapist station. The
patient station includes three
9D IMUs to be worn on the thorax, upper arm and lower arm, an
active exercise board
for interaction with interactive objects in the real-world and a
PC providing exercises and
feedback. The therapist station is used to program exercises
tailored to the patient. To
evaluate patient motivation, system feasibility and the effects of
using the system, data was
collected from nine participants who were in a chronic stage
after a stroke, i.e., >1 year
post stroke and diagnosed with a central paresis of one of the
arms/hands [69]. The
participants trained regularly for 30 min at the clinic during 8
weeks (i.e., 2 times/day,
4 days/week). An occupational- or physiotherapist assisted the
participants in adjusting
the system, putting on the IMUs, initializing the system and
answering questions. To study
the impact of T-TOAT, three tests were performed at baseline,
after 4 and 8 weeks and
AT 6 months post training: (1) FMA to assess arm-hand
function/activity, (2) the Action
Research Arm test (ARA(T)) to assess upper limb activity level
and (3) to assess frequency
and quality of use of the affected limb. T-TOAT had a
significant and long-lasting positive
66. Sensors 2022, 22, 573 22 of 39
effect on arm-hand performance. Subjective outcomes from
Medical Outcomes Study
Short Forms (SF-36) and EuroQoL-5D were mixed. The system
usability was perceived as
good and participants felt intrinsically motivated and competent
while using the system.
Overall, ref. [69] found the system feasible but to follow up on
the study, Timmermans
et al. (2014) [82] performed a randomized control study in
which 22 chronic stroke patients
performed T-TOAT regularly with or without robotic assistance
at the same regularity as
in [69]. For every day, patients rested in between the two
training sessions for approx
30 min–1 h. Presumably, this occurred also in [69]. The patients
selected ≥2 skills to train at
the beginning of the study, after which they were taught the T-
TOAT principles and how
to perform the skills’ components and, subsequently, the whole
of each skill. Both groups
received the same training but one group received assistance by
a Haptic Master robot
(MOOG, NL), which guided the trajectory through haptic
feedback. It was found that the
robot-assisted group improved the ARA(T) score significantly
during the training and that
this improvement was maintained 6 months post-training. Both
groups improved the MAL
score significantly, also this improvement was maintained after
6 months. The FMA score
did not change during the training. Regarding SF-36 and
EuroQoL-5D, only the control
group showed significantly increased scores during the training.
67. However, the SF-36 score
was not maintained during the 6 month post training period.
Bisio et al. (2019) [70] focused on lower limb rehabilitation
exercises and proposed
the SmartPants system for the remote monitoring of post-stroke
patients. SmartPants is
composed by four 6D IMUs worn on the thighs and shins and
two insoles containing
four pressure sensors, each of them connected to the shin IMUs
through wires. To test the
system’s performance in discriminating between five common
rehabilitation exercises22,
data from patients was collected. However, information on
experimental protocol, the number
of patients and demographics was lacking. After data pre-
processing and feature extraction,
the performance of eight machine learning algorithms was
examined. The RF from any
multilayer perception algorithms performed best achieving an
accuracy of ≥95% for each
exercise. Future plans included applying tensor decomposition
and regression techniques
to estimate load balance using only the 6D IMUs. We have
found no such work yet.
Assessing muscle status by testing endurance is part of lower
back pain rehabilitation.
However, practical limitations in determining such measures
using traditional procedures
may cause inaccurate diagnoses. To overcome these problems,
Banos et al. (2015) [71]
conducted a case study on mDurance, a system measuring trunk
posture and electrical
activity produced by the trunk muscles. mDurance provides a
summarized report of the
68. training and a number of measures: total duration, endurance
ratio, RMS, average rectified
value (ARV), maximum voluntary muscle contraction (MVC)
values and a session rating
(bad, good or perfect). Trunk measurement is based on
Madgwick’s algorithm [83] and
uses data from two 9D IMUs worn on the lumbar zone (D12-L1
vertebra) and dorsal. The
algorithm outputs a quaternion (4D vector) that is translated to
Euler angles representing
yaw, pitch and roll. Muscle fatigue is estimated through back
EMG. RMS, ARV and MVC
values are compared between exercise sessions. In the case
study, ten participants (eight
men, two women) performed three widely-used functional
endurance tests twice. First,
while being monitored by a healthcare professional who
controlled the starting position
and the termination of the test according to pre-established
criteria, and second while being
instructed on the positions by the mDurance system. The three
tests were the: Static Trunk
Extensor Endurance Test (STEET [84]), Trunk Curl Static
Endurance Test (TCSET [85]), and
Side Bridge Endurance Test (SBET [86]). The tests were
performed in sequence with a
recovery time of >1 h between the two versions of each test. It
is unclear if resting was allowed
between tests within each version. The inter-rater reliability
between the traditional version
and the mDurance version of each test was estimated using: the
intraclass correlation
coefficient (ICC)(ρ), Cronbach’s α, and the Bland–Altman
“limits of agreements” statistic
for continuous variables. There was a high inter-rater reliability
for all three endurance
69. tests. Further, three physical therapists evaluated the use of
both procedures and found
mDurance’s ability to provide guidance on positioning more
adequate than the traditional
Sensors 2022, 22, 573 23 of 39
positioning based on instructions from visual inspection.
mDurance was considered
reliable, since the system indicated an appropriate angle for test
initiation. The physical
therapists were impressed by the precision of the estimated
angle and appreciated the real-
time EMG data and by the summarized test report. Automatic
logging of time and muscle
fatigue values was interesting as this would assist the
evaluation of patient improvement.
Finally, seven independent experts received instructions on how
to use mDurance, finalized
the tests and filled out a SUS form. The SUS scores indicated a
high acceptability, ease of
use and confidence but tests with more experts are needed [70].
The barbell squat is an exercise used during lower limb
rehabilitation, but naturally
occurring deviations between people is an issue with this
exercise. Whelan et al. (2017) [72]
adopted a personalized classification approach instead of
making a global classification.
Comparing the two approaches in a study with 55 healthy
participants, the personalized
classification performed at a higher accuracy. The approach,
which requires only one 9D
IMU on the left thigh, has a similar accuracy as a multiple-9D-
70. IMU setup. The approach
decreased cost while increasing usability.
Finally, Xu et al. (2017) [73] presented a research platform for
retraining gait by
adjusting the FPA, a measure related to knee pain. The platform
included eight 9D IMUs
and a central control unit. Each IMU could provide vibrotactile
feedback. In an experiment,
six older adults received FPA gait retraining. One 9D IMU was
attached to each foot and
two 9D IMUs, which provided vibrotactile feedback, were
attached at the medial and
lateral shanks. It is unclear if and how the two remaining 9D
IMUs were used. The training
was performed in three steps: (1) baseline data collection while
walking on a treadmill,
(2) toe-in gait training through the provision of feedback on the
lateral side of the shank if
FPA < −1◦ or on the medial side if FPA > 9◦ and (3) toe-out gait
training through feedback
if FPA < −15◦ or FPA > −5◦. The participants walked at 1 m/s
for 2 min in each step,
and prior to each step, they practised walking and adjusting to
feedback for 2 min. The
participants walked in the no feedback zone during 68.3% of
step 2, and during 89.4% of
the step 3. The FPA was highest during step 2 (toe-in gait
training).
This section has reported on nine works retrieved during the
literature search and one additional
randomized control study with chronic stroke patients [82].
Despite the focus on technology-
supported rehabilitation, only five of these works report on the
inclusion of patients [65–67,69,82].
71. One additional study [73] was conducted with older adults. This
is a strength considering its focus
on retraining gait, and the differences in gait between young
and old adults presented in [32,33] in
Section 4.1. Too much information is lacking in [70] to assess
the applicability of the work. We find
that [68,71,72] focus at rehabilitation monitoring. However, the
results from experiments performed
with their respective target groups are lacking.
6. Neurological Diseases
Nine works are reported in this section. Ref. [87] focuses on
discriminating between
healthy people and those with tremors, while [88–90] use the
Unified Parkinson’s Disease
Rating scale (UPDRS). UDPRS is a tool for assessing
Parkinson’s disease (PD) progression
over time through evaluating different motor and functional
abilities. Diagnosis of Multiple
Sclerosis (MS) is at focus in [91,92], and the remote assessment
of motor changes among
patients with MS (PwMS) is reported in [93]. We report briefly
on [94,95], where Memedi
et al. (2018) [94] present a mockup of a system for supporting
PD patients in symptom
management. The mockup was derived by a user-centered
design process involving
interviews and observations with 11 PD patients. Sok et al.
(2018) [95] present a static
classification model augmented with a dynamic state estimation
model for improved
activity recognition accuracy. The model’s effectiveness was
validated by 13 ambulatory
patients with incomplete spinal cord injuries who performed six
PAs23 while wearing an
72. accelerometer on the waist. The model aims to aid physicians in
selecting physical and drug
therapy for improved patient mobility. We believe that the
model could also provide guidance
for physicians focusing on patients with PD or MS. As shown in
Table 9, all studies but [87]
included patients. One study [91,92] was a case-control study
while the other studies were
Sensors 2022, 22, 573 24 of 39
observational. Three articles lack information on the
participants’ age and gender. The
age spans in the remaining five articles vary. Table 10 shows
that sensor type, number of
sensors and sensor locations varied. All of them used IMUs,
either accelerometers, 6D
IMUs or 9D IMUs. The two articles [89,90] reporting on the
cloudUDPRS Android app
used a smartphone’s accelerometer and screen as sensors.
cloudUDPRS is a Class I: medical
device for theclinical assessment of PD.
Table 9. Participant demographics for studies on neurological
diseases. - = no information.
Ref. Research Design No. of Participants Age Group Age
Statistics Male/Female Patient/Healthy
[87] observational 21 24–66 - 18/3 0/21
[88] observational 24 31–79 65.9 ± 12.3 17/7 24/0
[89,90] observational 12 - - - 12/0
[91,92] case-control 41 (28/13) - 40.5 ± 9.4 25%/75% 28/0
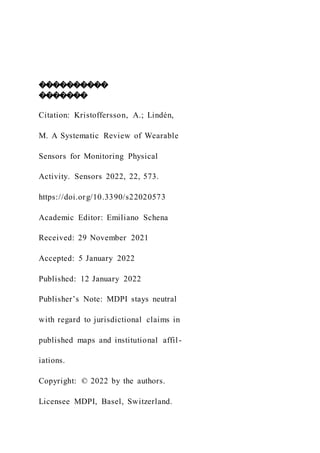
![This article is an open access article
distributed under the terms and
conditions of the Creative Commons
Attribution (CC BY) license (https://
creativecommons.org/licenses/by/
4.0/).
sensors
Review
A Systematic Review of Wearable Sensors for Monitoring
Physical Activity
Annica Kristoffersson * and Maria Lindén
School of Innovation, Design and Engineering, Mälardalen
University, Box 883, 721 23 Västerås, Sweden;
[email protected]
* Correspondence: [email protected]
Abstract: This article reviews the use of wearable sensors for
the monitoring of physical activity (PA)
for different purposes, including assessment of gait and balance,
prevention and/or detection of falls,
recognition of various PAs, conduction and assessment of
rehabilitation exercises and monitoring
of neurological disease progression. The article provides in-
depth information on the retrieved
articles and discusses study shortcomings related to
demographic factors, i.e., age, gender, healthy
participants vs patients, and study conditions. It is well known](data:image/gif;base64,R0lGODlhAQABAIAAAAAAAP///yH5BAEAAAAALAAAAAABAAEAAAIBRAA7)