The Global Evolution of Mobile Payments
•
0 recomendaciones•2,903 vistas

Mobile payments have taken off across the world, but differ from country to country in terms of adoption rate, model, and payment method. As the world takes a deeper look into the present and future of mobile payments, WEX shares with you some of the key trends and talking points: - The Four Primary Mobile Payments Models: Contactless NFC, Web-Based Payments, Direct Mobile Billing, and Premium SMS -How Much Money Consumers Spend Using Mobile Payments -General Global Readiness for Mobile Payments -The Market for Mobile Payments in the US -Speed of Mobile Adoption -Payment Types Used in Mobile Payments -Wearables, Now and in the Future -How Starbucks Captured Mobile Payments Success

Recomendados
Recomendados
Más contenido relacionado
Destacado
Destacado (20)
The Global Evolution of Mobile Payments
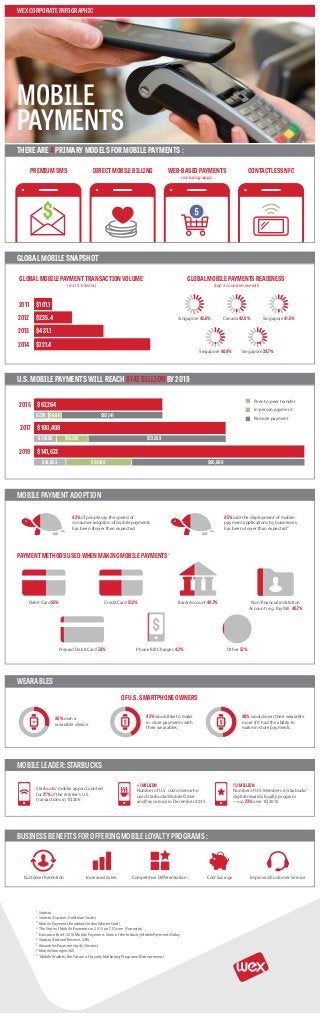
- 1. WEXCORPORATEINFOGRAPHIC MOBILE PAYMENTS THEREARE4PRIMARYMODELSFORMOBILEPAYMENTS1 : GLOBALMOBILESNAPSHOT MOBILEPAYMENTADOPTION U.S.MOBILEPAYMENTSWILLREACH$142BILLIONBY20194 WEARABLES OFU.S.SMARTPHONEOWNERS7 MOBILELEADER:STARBUCKS8 $101.1 $721.4 $235.4 $431.1 $67,264 $100,408 $141,673 1 Statista 2 Statista (Gartner; Goldman Sachs) 3 Mobile Payments Readiness Index (MasterCard) 4 The State of Mobile Payments in 2015 on CIO.com (Forrester) 5 Executive Brief: 2016 Mobile Payments State of the Industry MobilePaymentsToday 6 Statista (Federal Reserve, GfK) 7 Wearables Payment study (Stratos) 8 MobileStrategies360 9 'Mobile Wallets,' the Future of Loyalty Marketing Programs (Entrepreneur) DIRECTMOBILEBILLING WEB-BASEDPAYMENTS (including apps) PREMIUMSMS GLOBALMOBILEPAYMENTTRANSACTIONVOLUME2 (in U.S. billions) PAYMENTMETHODSUSEDWHENMAKINGMOBILEPAYMENTS6 GLOBALMOBILEPAYMENTSREADINESS2 (top 5 countries overall) CONTACTLESSNFC 2011 2014 2012 2013 2015 2017 2019 Singapore 45.6% Peer-to-peer transfer Canada 42.6% Singapore 40.4% Singapore 39.7% Singapore 41.5% $7.3K $53,141$6.8K $11,899 $72,269$16,240 $16,833 $90,680$34,160 In-person payment Remote payment 42% of people say the speed of consumer adoption of mobile payments has been slower then expected 45% said the deployment of mobile- payment applications by businesses has been slower than expected4 Debit Card 55% Prepaid Debit Card 7.6% Phone Bill Charges 4.2% Credit Card 51.2% Bank Account 40.7% Non-financial institution Account (e.g. PayPal) 40.7% Other 5.1% 30%own a wearable device 43%would like to make in-store payments with their wearables 48%would wear their wearable more if it had the ability to make in-store payments Starbucks’mobile app accounted for 21% of the retailer’s U.S. transactions in 1Q206 >1MILLION Number of U.S. customers who used Starbucks’Mobile Order and Pay service in December 2015 11.1MILLION Number of U.S. Members in Starbucks’ digital rewards loyalty program —up 23% over 1Q2015 BUSINESSBENEFITSFOROFFERINGMOBILELOYALTYPROGRAMS9 : Customer Retention Increased Sales Competitive Differentiation Cost Savings Improved Customer Service
- 2. WEXCORPORATEINFOGRAPHIC MOBILE PAYMENTS THEREARE4PRIMARYMODELSFORMOBILEPAYMENTS1 : GLOBALMOBILESNAPSHOT MOBILEPAYMENTADOPTION U.S.MOBILEPAYMENTSWILLREACH$142BILLIONBY20194 WEARABLES OFU.S.SMARTPHONEOWNERS7 MOBILELEADER:STARBUCKS8 $101.1 $721.4 $235.4 $431.1 $67,264 $100,408 $141,673 1 Statista 2 Statista (Gartner; Goldman Sachs) 3 Mobile Payments Readiness Index (MasterCard) 4 The State of Mobile Payments in 2015 on CIO.com (Forrester) 5 Executive Brief: 2016 Mobile Payments State of the Industry MobilePaymentsToday 6 Statista (Federal Reserve, GfK) 7 Wearables Payment study (Stratos) 8 MobileStrategies360 9 'Mobile Wallets,' the Future of Loyalty Marketing Programs (Entrepreneur) DIRECTMOBILEBILLING WEB-BASEDPAYMENTS (including apps) PREMIUMSMS GLOBALMOBILEPAYMENTTRANSACTIONVOLUME2 (in U.S. billions) PAYMENTMETHODSUSEDWHENMAKINGMOBILEPAYMENTS6 GLOBALMOBILEPAYMENTSREADINESS2 (top 5 countries overall) CONTACTLESSNFC 2011 2014 2012 2013 2015 2017 2019 Singapore 45.6% Peer-to-peer transfer Canada 42.6% Singapore 40.4% Singapore 39.7% Singapore 41.5% $7.3K $53,141$6.8K $11,899 $72,269$16,240 $16,833 $90,680$34,160 In-person payment Remote payment 42% of people say the speed of consumer adoption of mobile payments has been slower then expected 45% said the deployment of mobile- payment applications by businesses has been slower than expected4 Debit Card 55% Prepaid Debit Card 7.6% Phone Bill Charges 4.2% Credit Card 51.2% Bank Account 40.7% Non-financial institution Account (e.g. PayPal) 40.7% Other 5.1% 30%own a wearable device 43%would like to make in-store payments with their wearables 48%would wear their wearable more if it had the ability to make in-store payments Starbucks’mobile app accounted for 21% of the retailer’s U.S. transactions in 1Q206 >1MILLION Number of U.S. customers who used Starbucks’Mobile Order and Pay service in December 2015 11.1MILLION Number of U.S. Members in Starbucks’ digital rewards loyalty program —up 23% over 1Q2015 BUSINESSBENEFITSFOROFFERINGMOBILELOYALTYPROGRAMS9 : Customer Retention Increased Sales Competitive Differentiation Cost Savings Improved Customer Service